| Param | Original file | Final file |
|---|---|---|
| Filename | modeM0/AS1A04_210T02_9000001826_12349cztM0_level2.evt | modeM0/AS1A04_210T02_9000001826_12349cztM0_level2_quad_clean.evt |
| Size (bytes) | 142,312,320 | 12,752,640 |
| Size | 135.7 MB | 12.2 MB |
| Events in quadrant A | 1,054,401 | 62,178 |
| Events in quadrant B | 1,123,068 | 64,767 |
| Events in quadrant C | 949,974 | 64,766 |
| Events in quadrant D | 1,056,335 | 60,822 |
| Mode SS | |||
|---|---|---|---|
| Quadrant | BADHDUFLAG | Total packets | Discarded packets |
| A | 0 | 38 | 0 |
| B | 0 | 38 | 0 |
| C | 0 | 38 | 0 |
| D | 0 | 38 | 0 |
| Mode M9 | |||
|---|---|---|---|
| Quadrant | BADHDUFLAG | Total packets | Discarded packets |
| A | 0 | 7 | 0 |
| B | 0 | 7 | 0 |
| C | 0 | 7 | 0 |
| D | 0 | 7 | 0 |
| Mode M0 | |||
|---|---|---|---|
| Quadrant | BADHDUFLAG | Total packets | Discarded packets |
| A | 0 | 4257 | 2 |
| B | 0 | 4474 | 1 |
| C | 0 | 3990 | 1 |
| D | 0 | 4327 | 1 |
| Quadrant | Total seconds | Saturated seconds | Saturation percentage |
|---|---|---|---|
| A | 1817 | 165 | 9.080903% |
| B | 1817 | 191 | 10.511833% |
| C | 1817 | 107 | 5.888828% |
| D | 1817 | 129 | 7.099615% |
Noise dominated data is calculated using 1-second bins in cleaned event files. If a bin has >2000 counts, and if more than 50% of those come from <1% of pixels, then it is considered to be noise-dominated and hence unusable.
| Quadrant | # 1 sec bins | Bins with >0 counts | Bins with >2000 counts | High rate bins dominated by noise | Noise dominated (total time) | Noise dominated (detector-on time) | Marked lightcurve |
|---|---|---|---|---|---|---|---|
| A | 2523 | 1819 | 0 | 0 | 0.00% | 0.00% | 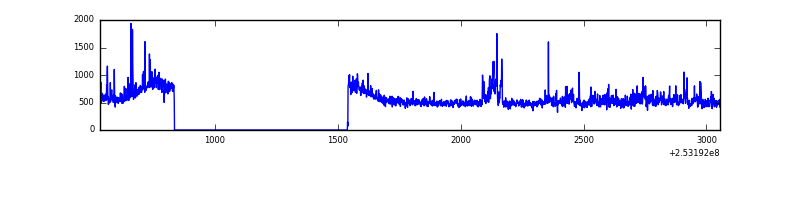 |
| B | 2523 | 1819 | 6 | 6 | 0.24% | 0.33% | 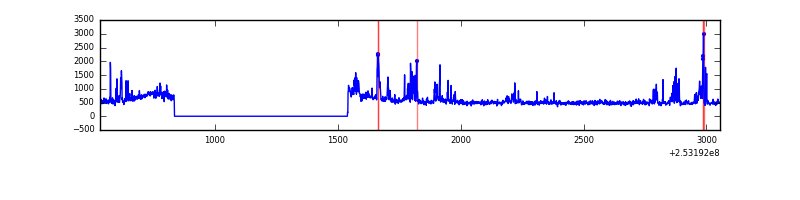 |
| C | 2523 | 1819 | 2 | 2 | 0.08% | 0.11% | 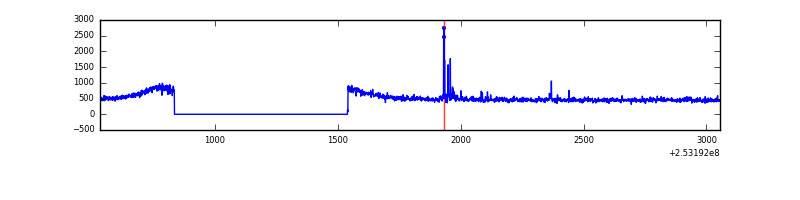 |
| D | 2523 | 1819 | 17 | 17 | 0.67% | 0.93% | 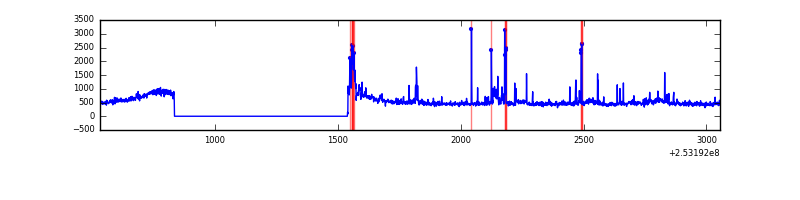 |
Top three noisy pixels from each quadrant. If the there are fewer than three noisy pixels in the level2.evt file, extra rows are filled as -1
| Pixel properties | Quadrant properties | ||||||
|---|---|---|---|---|---|---|---|
| Quadrant | DetID | PixID | Counts | Sigma | Mean | Median | Sigma |
| A | 1 | 162 | 29030 | 555.59 | 243 | 237 | 51.8 |
| A | 7 | 16 | 26799 | 512.54 | 243 | 237 | 51.8 |
| A | 13 | 251 | 15954 | 303.27 | 243 | 237 | 51.8 |
| B | 4 | 239 | 160000 | 3215.84 | 241 | 234 | 49.7 |
| B | 3 | 64 | 13931 | 275.7 | 241 | 234 | 49.7 |
| B | 12 | 111 | 5649 | 109.0 | 241 | 234 | 49.7 |
| C | 15 | 208 | 21138 | 362.4 | 237 | 237 | 57.7 |
| C | 13 | 61 | 1726 | 25.82 | 237 | 237 | 57.7 |
| C | 8 | 222 | 928 | 11.98 | 237 | 237 | 57.7 |
| D | 1 | 52 | 110687 | 1870.73 | 235 | 226 | 59.0 |
| D | 10 | 253 | 35933 | 604.72 | 235 | 226 | 59.0 |
| D | 13 | 122 | 5378 | 87.25 | 235 | 226 | 59.0 |
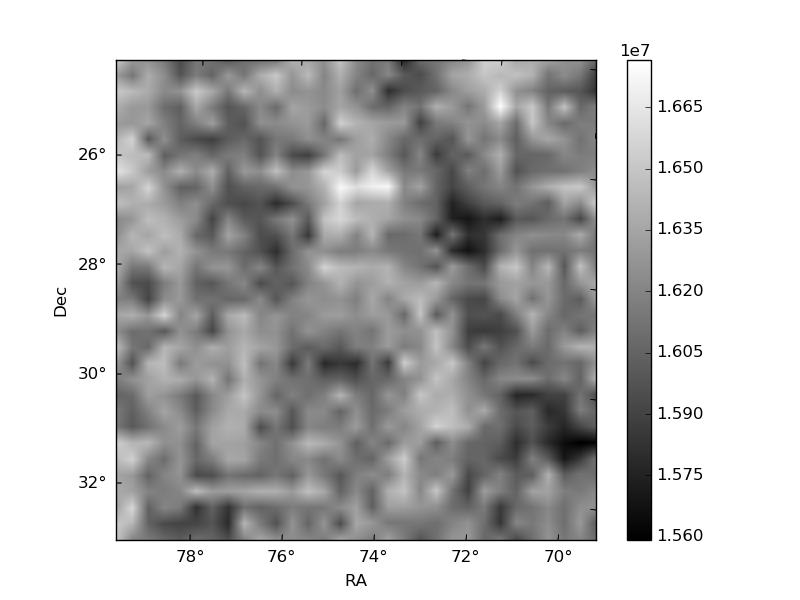
Histogram calculated using DETX and DETY for each event in the final _common_clean file
| Quadrant A | 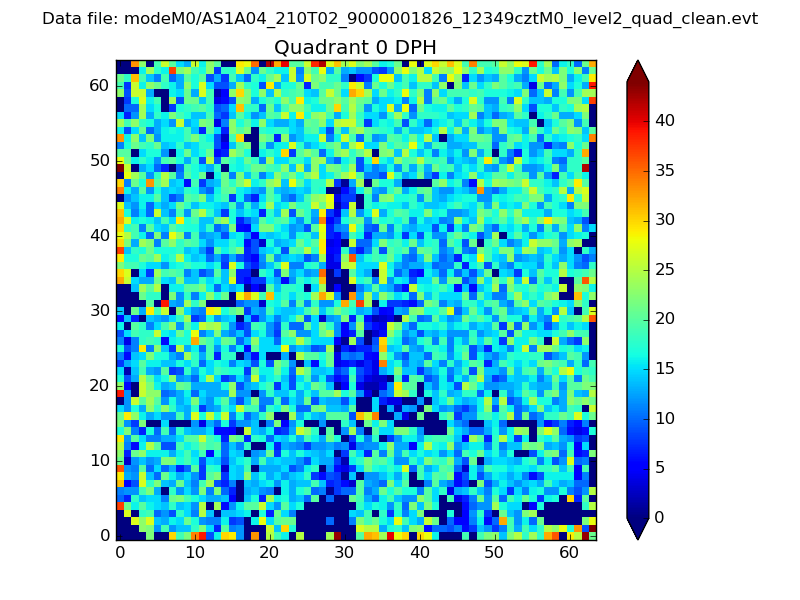 |
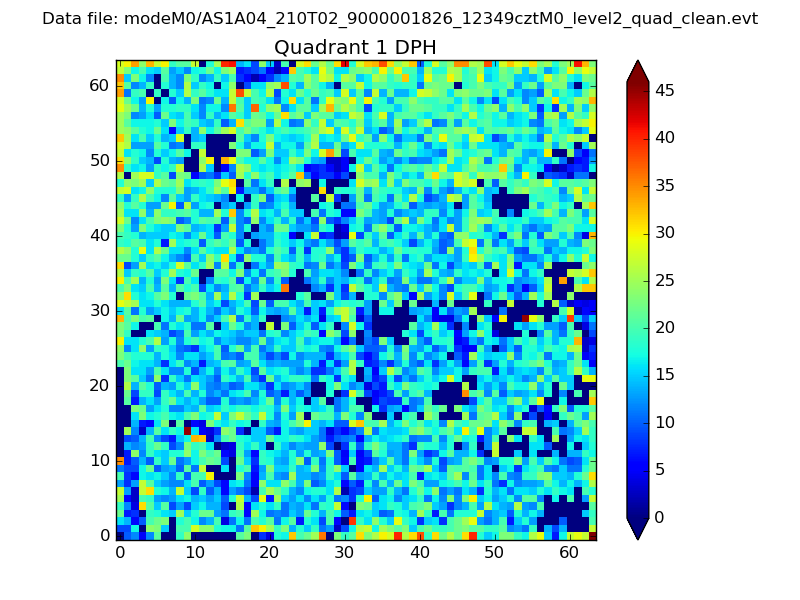 |
Quadrant B |
|---|---|---|---|
| Quadrant D | 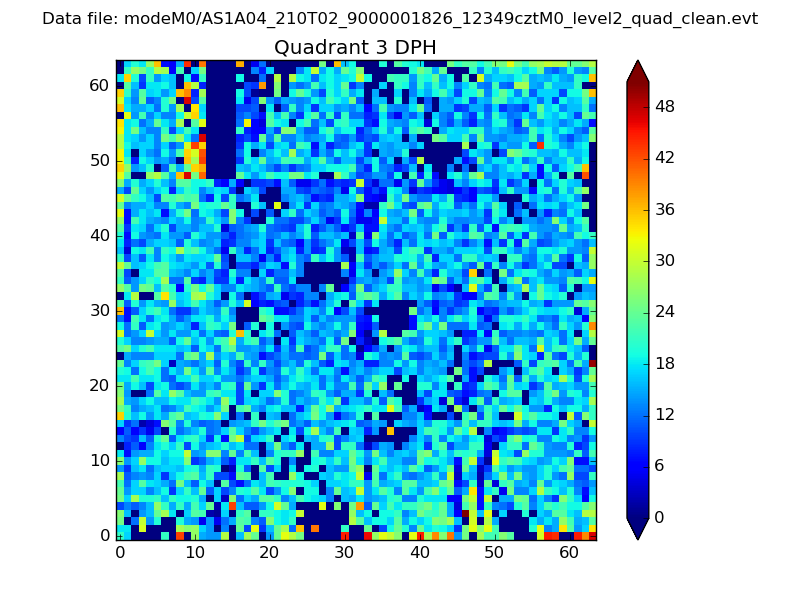 |
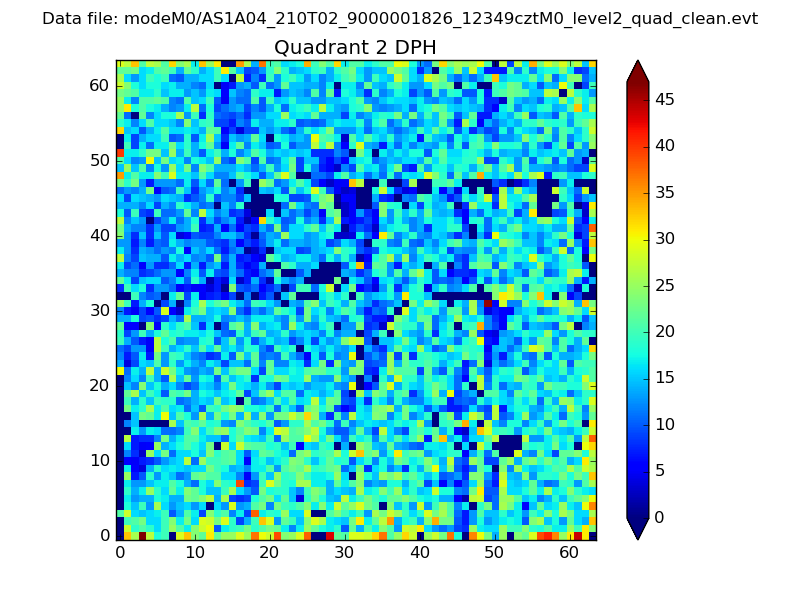 |
Quadrant C |
| Plot type | Count rate plots | Images |
|---|---|---|
| Comparison with Poisson distribution Blue bars denote a histogram of data divided into 1 sec bins. Red curve is a Poisson curve with rate = median count rate of data. |
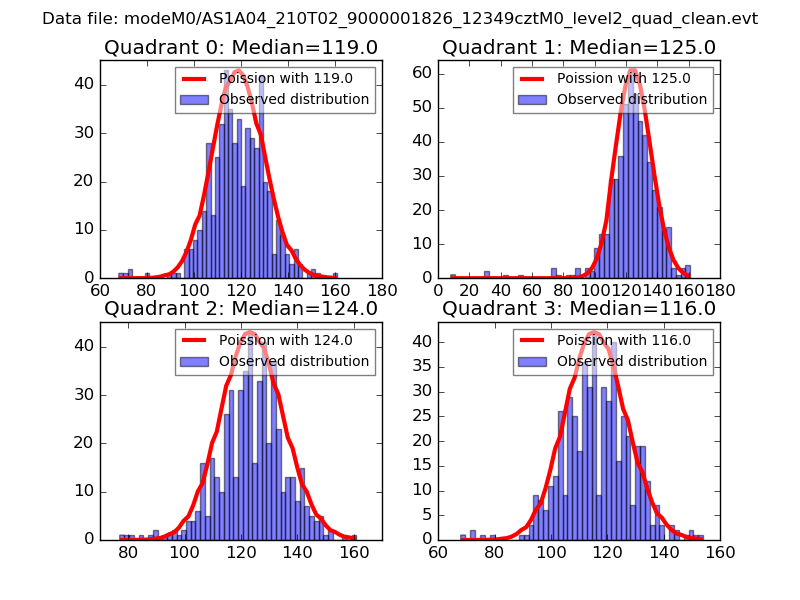 |
 |
| Quadrant-wise count rates Data is divided into 100 sec bins |
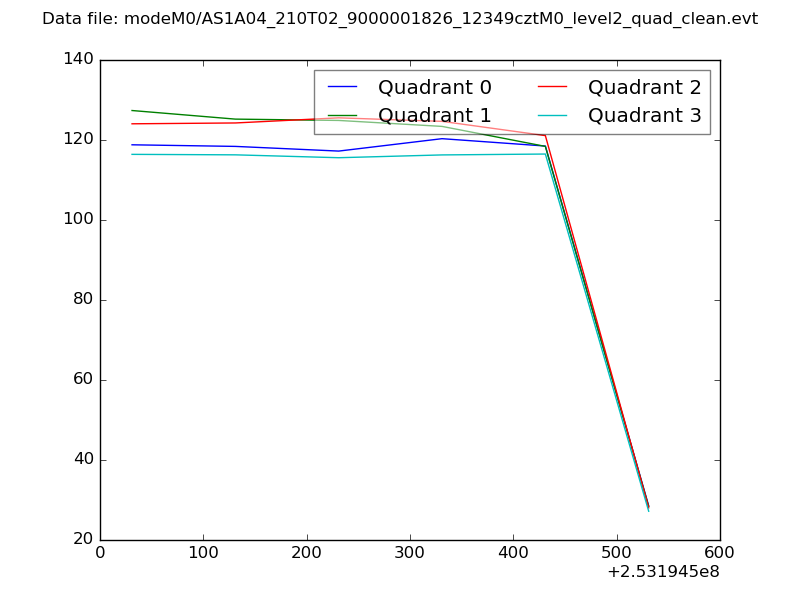 |
|
| Module-wise count rates for Quadrant A Data is divided into 100 sec bins |
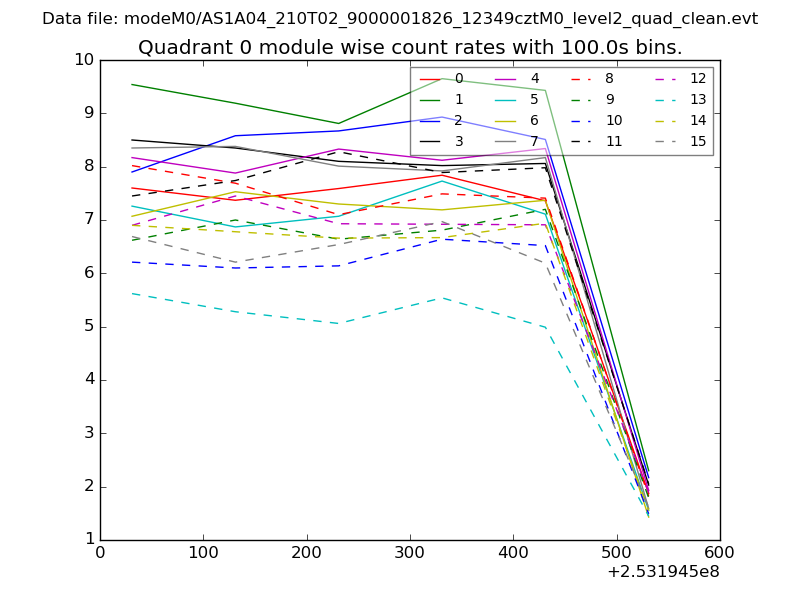 |
 |
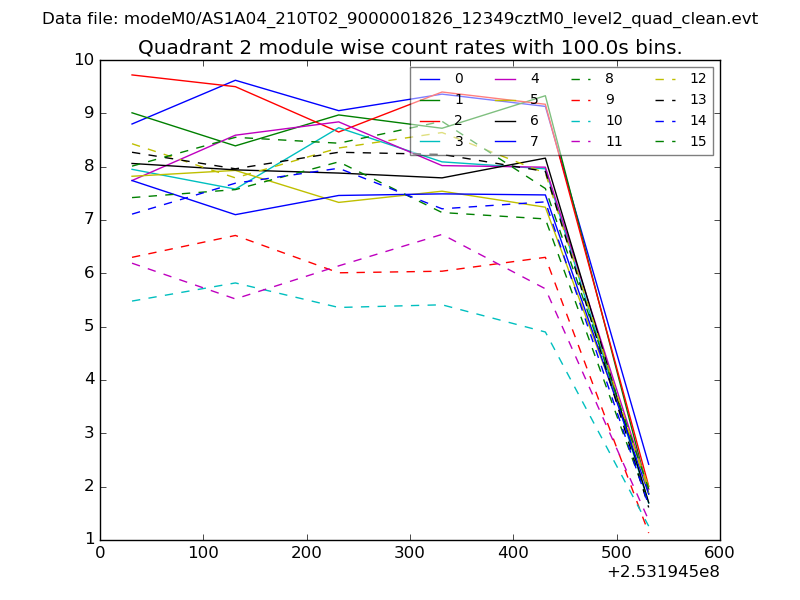
| Module-wise count rates for Quadrant B Data is divided into 100 sec bins |
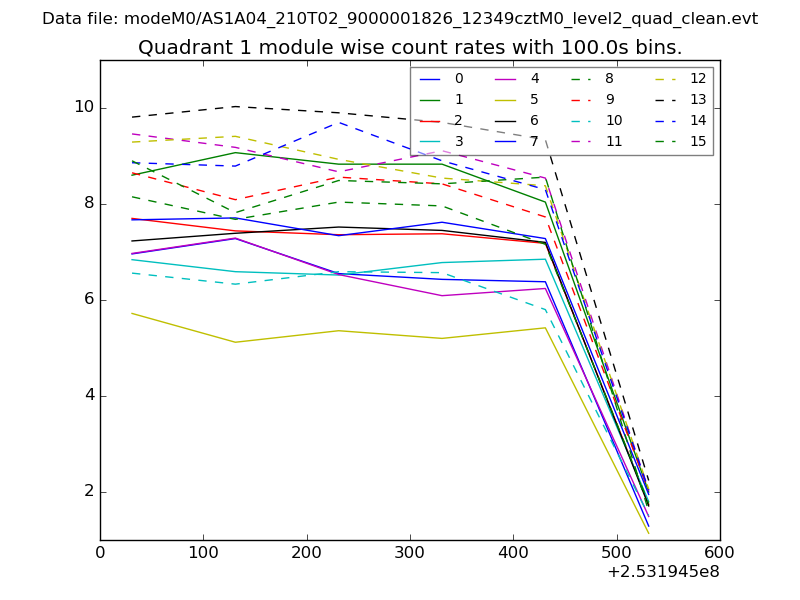 |
 |
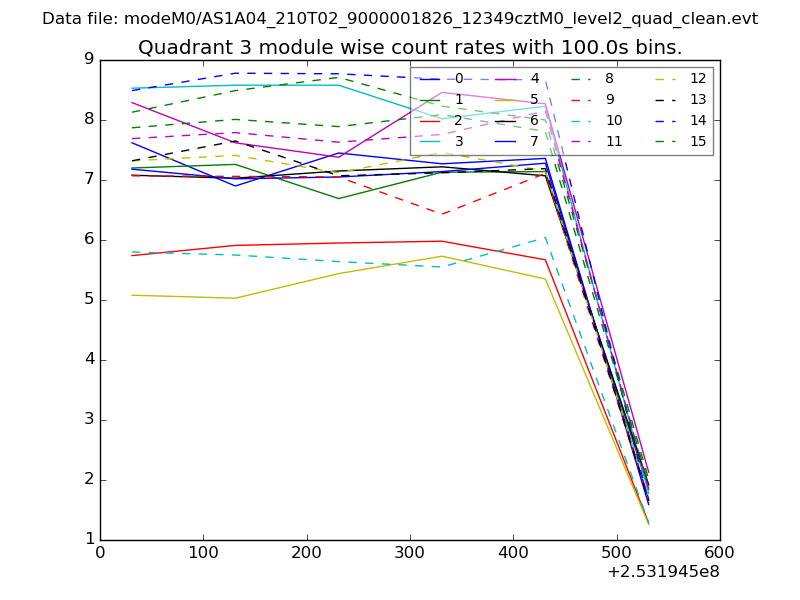
| Module-wise count rates for Quadrant C Data is divided into 100 sec bins |
 |
 |
| Module-wise count rates for Quadrant D Data is divided into 100 sec bins |
 |
 |
| Parameter | Plot |
|---|---|
| CZT HV Monitor | 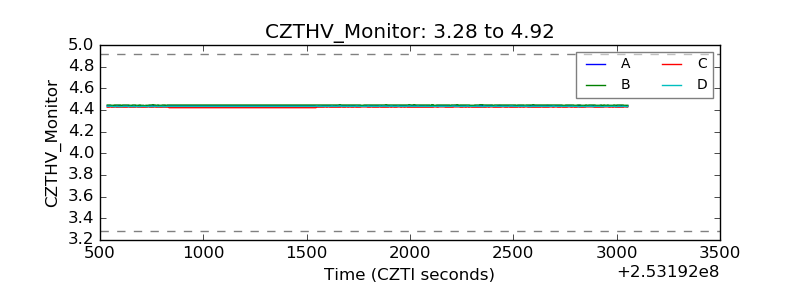 |
| D_VDD | 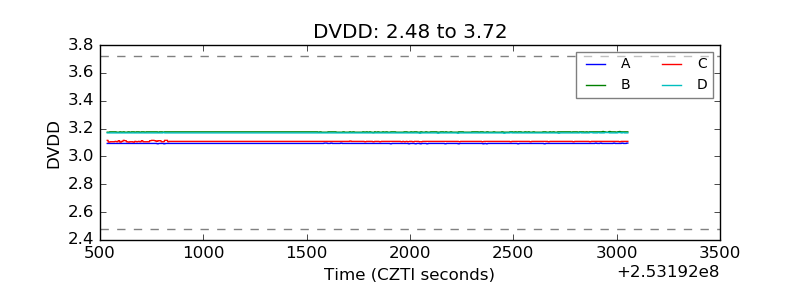 |
| Temperature 1 | 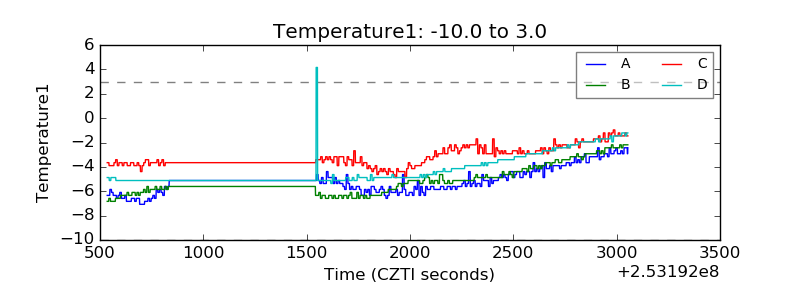 |
| Veto HV Monitor |  |
| Veto LLD | 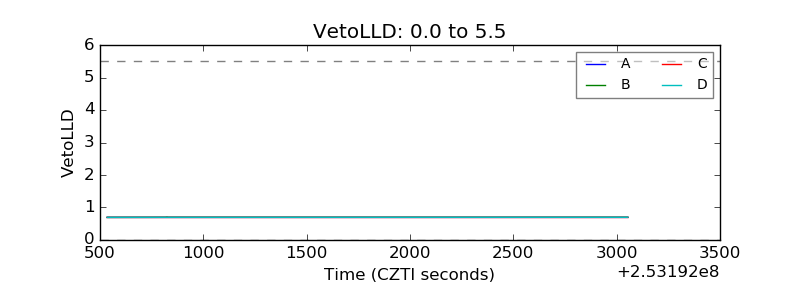 |
| Alpha Counter | 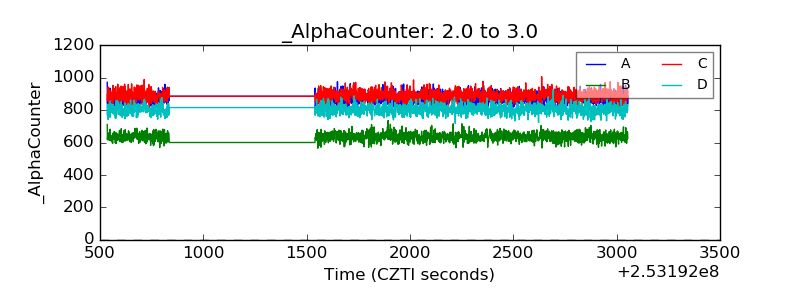 |
| _CPM_Rate | 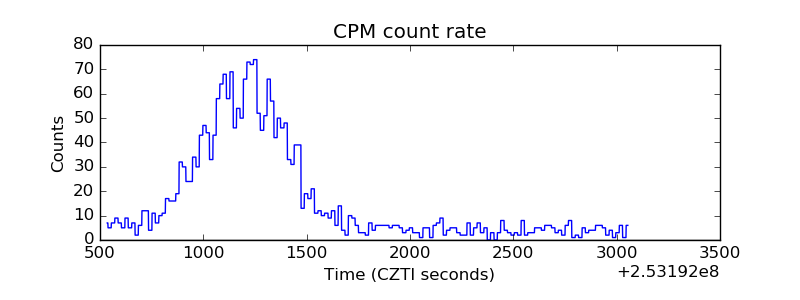 |
| CZT Counter | 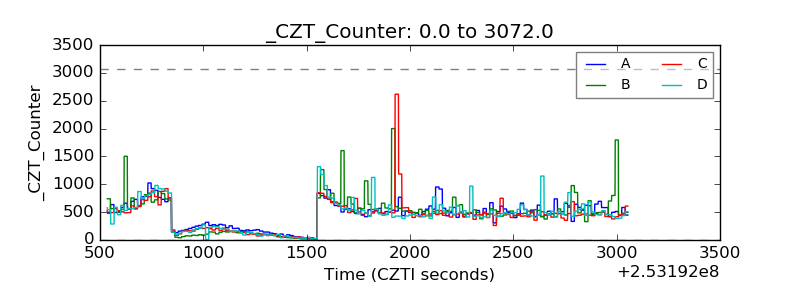 |
| +2.5 Volts monitor | 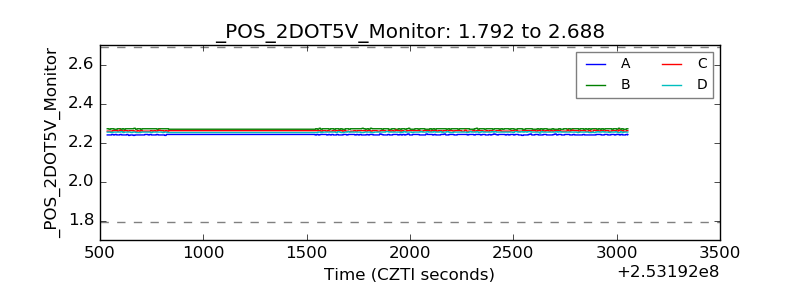 |
| +5 Volts monitor |  |
| _ROLL_ROT | 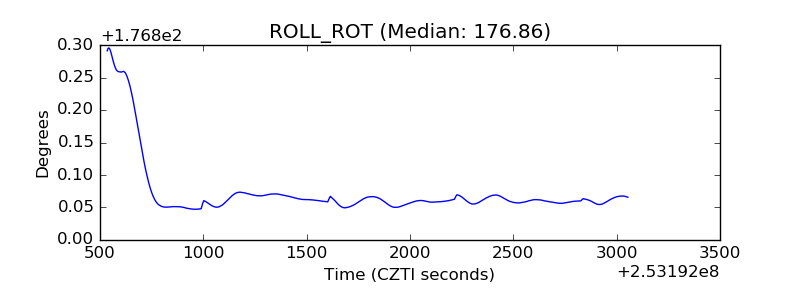 |
| _Roll_DEC | 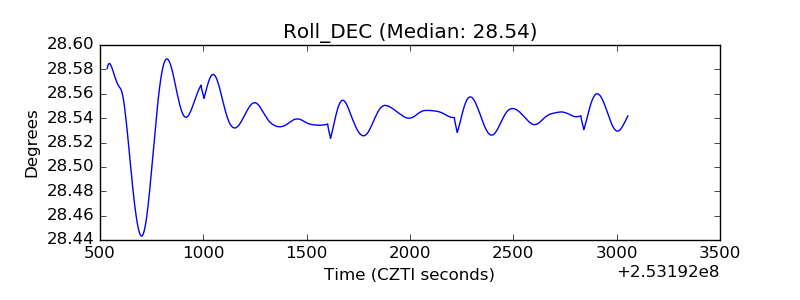 |
| _Roll_RA |  |
| Veto Counter | 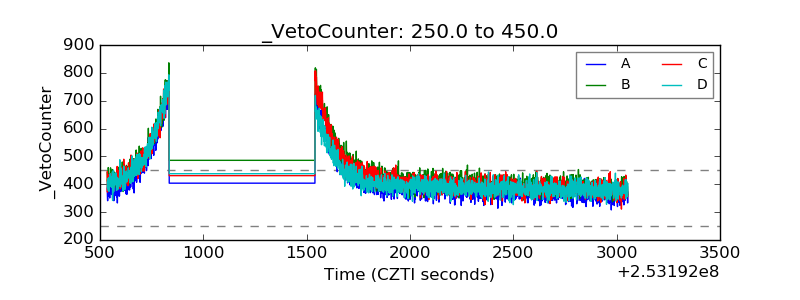 |