| Param | Original file | Final file |
|---|---|---|
| Filename | modeM0/AS1A04_210T02_9000001826_12352cztM0_level2.evt | modeM0/AS1A04_210T02_9000001826_12352cztM0_level2_quad_clean.evt |
| Size (bytes) | 156,847,680 | 37,376,640 |
| Size | 149.6 MB | 35.6 MB |
| Events in quadrant A | 1,266,639 | 243,979 |
| Events in quadrant B | 1,141,094 | 252,099 |
| Events in quadrant C | 917,818 | 250,501 |
| Events in quadrant D | 1,280,344 | 233,591 |
| Mode SS | |||
|---|---|---|---|
| Quadrant | BADHDUFLAG | Total packets | Discarded packets |
| A | 0 | 42 | 0 |
| B | 0 | 42 | 0 |
| C | 0 | 42 | 0 |
| D | 0 | 42 | 0 |
| Mode M0 | |||
|---|---|---|---|
| Quadrant | BADHDUFLAG | Total packets | Discarded packets |
| A | 0 | 5184 | 0 |
| B | 0 | 4693 | 0 |
| C | 0 | 4203 | 0 |
| D | 0 | 5185 | 0 |
| Quadrant | Total seconds | Saturated seconds | Saturation percentage |
|---|---|---|---|
| A | 2086 | 16 | 0.767018% |
| B | 2086 | 15 | 0.719080% |
| C | 2086 | 1 | 0.047939% |
| D | 2086 | 102 | 4.889741% |
Noise dominated data is calculated using 1-second bins in cleaned event files. If a bin has >2000 counts, and if more than 50% of those come from <1% of pixels, then it is considered to be noise-dominated and hence unusable.
| Quadrant | # 1 sec bins | Bins with >0 counts | Bins with >2000 counts | High rate bins dominated by noise | Noise dominated (total time) | Noise dominated (detector-on time) | Marked lightcurve |
|---|---|---|---|---|---|---|---|
| A | 2087 | 2087 | 0 | 0 | 0.00% | 0.00% | 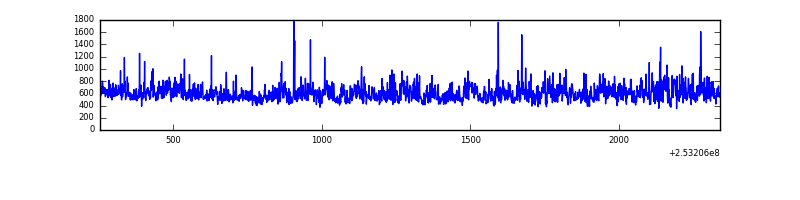 |
| B | 2087 | 2087 | 6 | 6 | 0.29% | 0.29% | 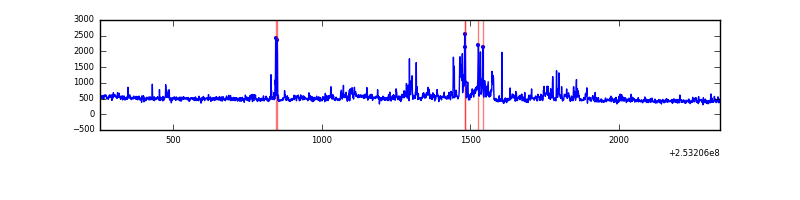 |
| C | 2087 | 2087 | 0 | 0 | 0.00% | 0.00% | 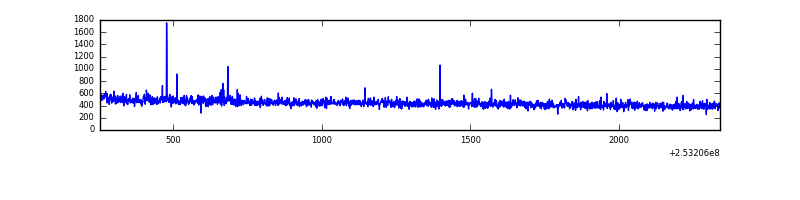 |
| D | 2087 | 2087 | 103 | 103 | 4.94% | 4.94% | 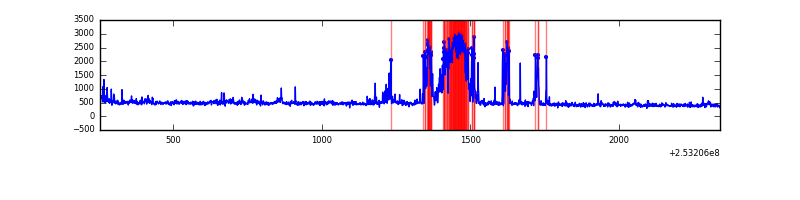 |
Top three noisy pixels from each quadrant. If the there are fewer than three noisy pixels in the level2.evt file, extra rows are filled as -1
| Pixel properties | Quadrant properties | ||||||
|---|---|---|---|---|---|---|---|
| Quadrant | DetID | PixID | Counts | Sigma | Mean | Median | Sigma |
| A | 1 | 162 | 81907 | 1557.02 | 244 | 238 | 52.5 |
| A | 13 | 251 | 79553 | 1512.14 | 244 | 238 | 52.5 |
| A | 1 | 178 | 44476 | 843.4 | 244 | 238 | 52.5 |
| B | 0 | 85 | 76278 | 1554.17 | 242 | 236 | 48.9 |
| B | 4 | 239 | 40079 | 814.32 | 242 | 236 | 48.9 |
| B | 10 | 245 | 37360 | 758.75 | 242 | 236 | 48.9 |
| C | 15 | 208 | 8800 | 154.68 | 233 | 233 | 55.4 |
| C | 13 | 61 | 1659 | 25.75 | 233 | 233 | 55.4 |
| C | 3 | 202 | 607 | 6.75 | 233 | 233 | 55.4 |
| D | 1 | 52 | 293028 | 5095.14 | 232 | 226 | 57.5 |
| D | 7 | 71 | 55230 | 957.14 | 232 | 226 | 57.5 |
| D | 13 | 249 | 19496 | 335.32 | 232 | 226 | 57.5 |
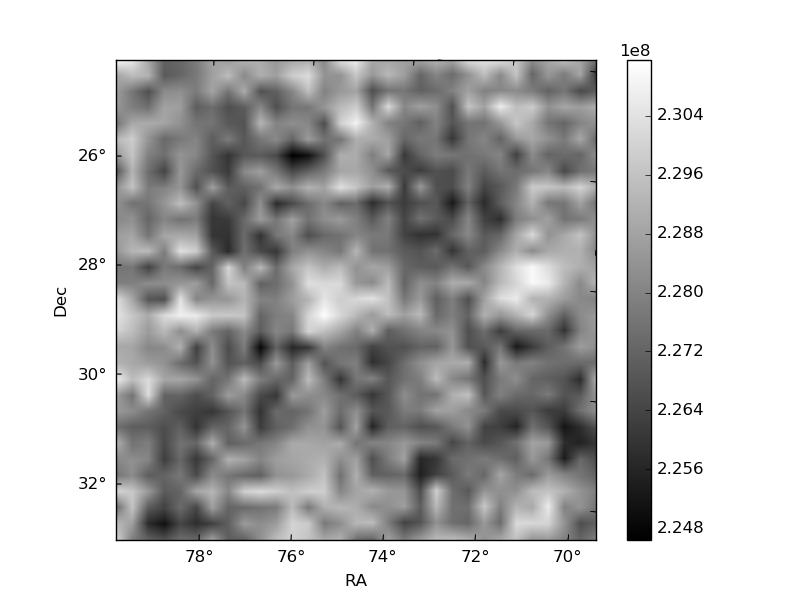
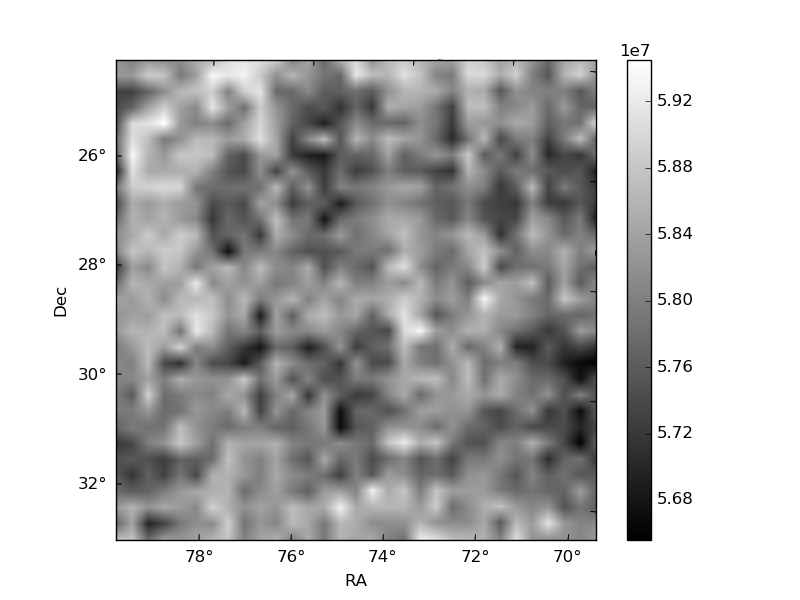
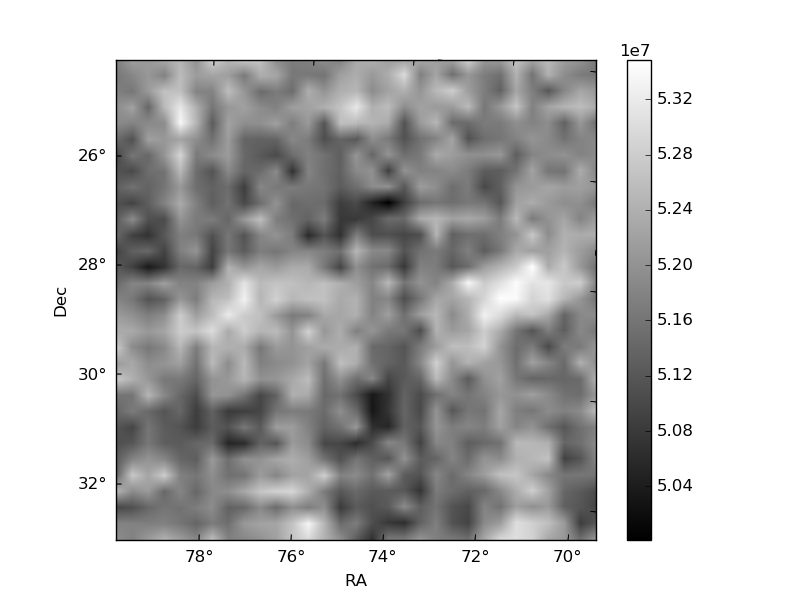
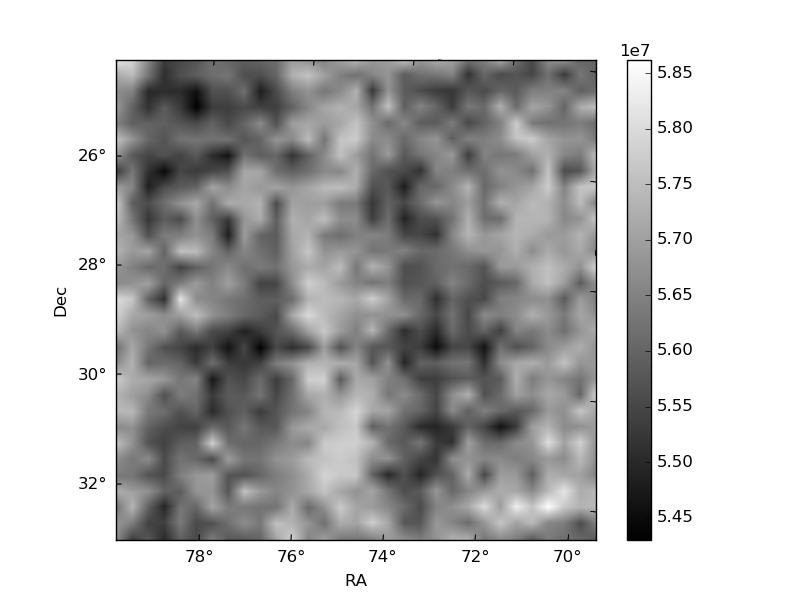
Histogram calculated using DETX and DETY for each event in the final _common_clean file
| Quadrant A | 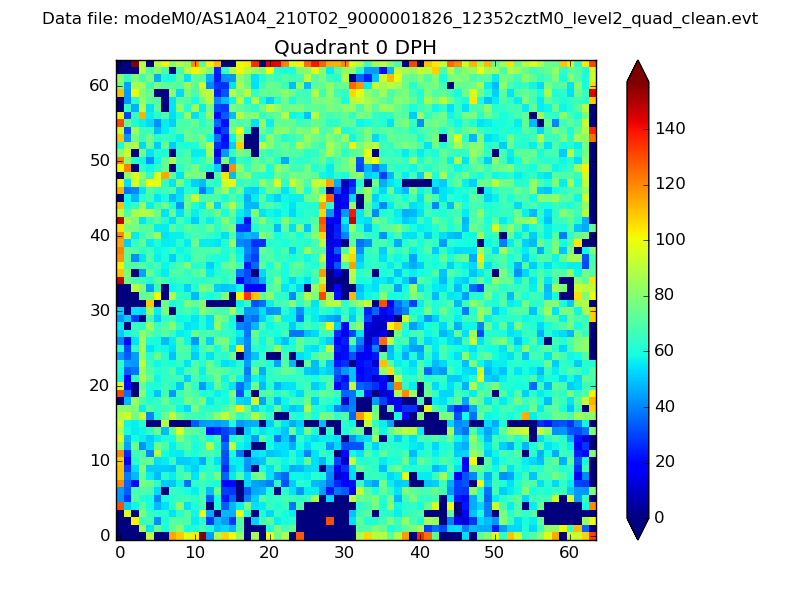 |
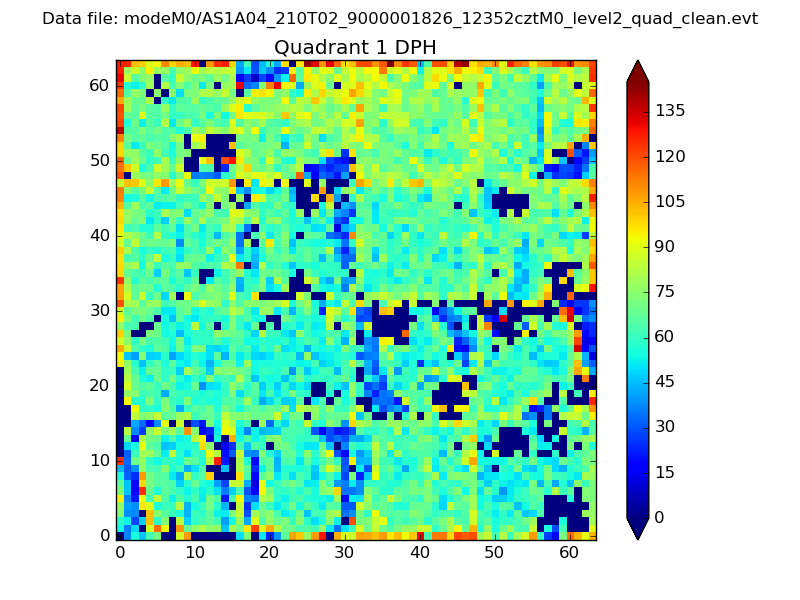 |
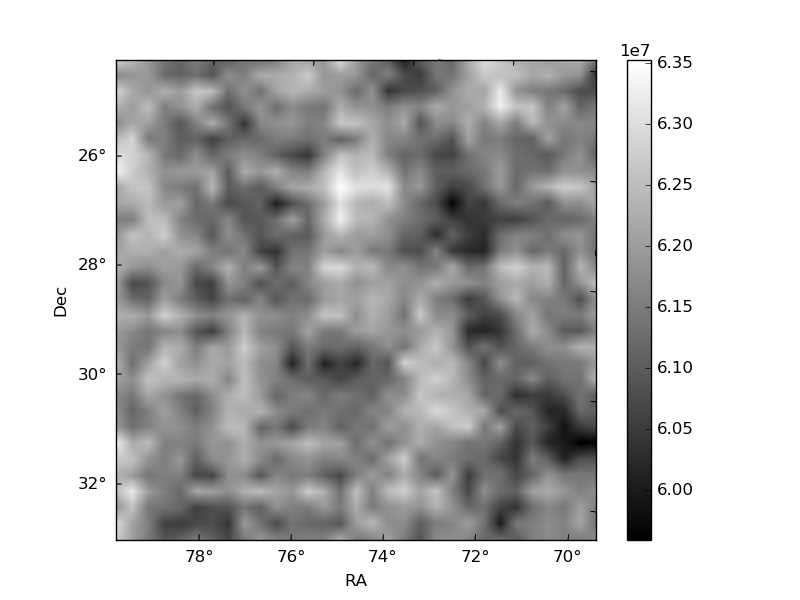
Quadrant B |
|---|---|---|---|
| Quadrant D | 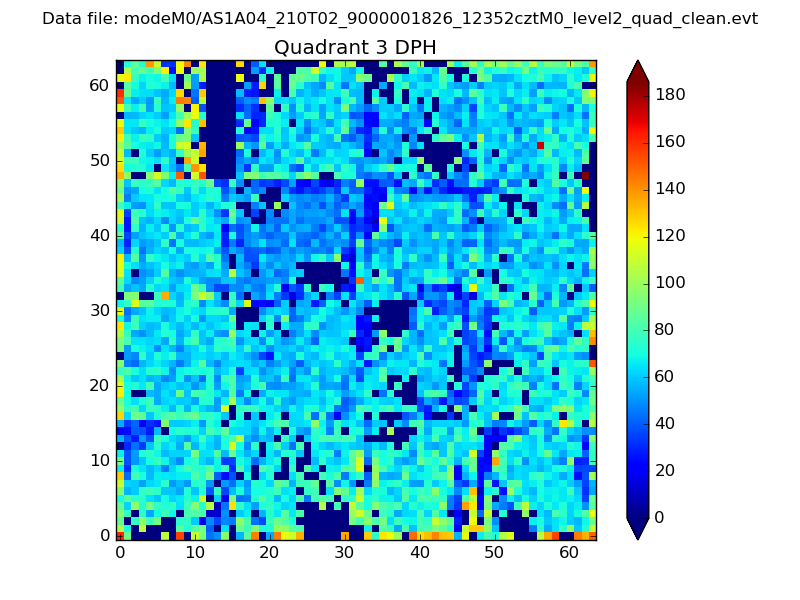 |
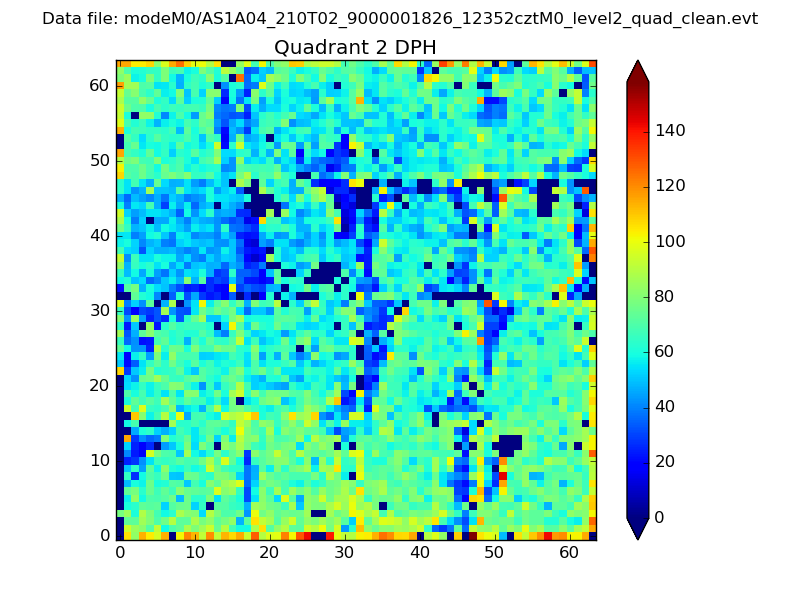 |
Quadrant C |
| Plot type | Count rate plots | Images |
|---|---|---|
| Comparison with Poisson distribution Blue bars denote a histogram of data divided into 1 sec bins. Red curve is a Poisson curve with rate = median count rate of data. |
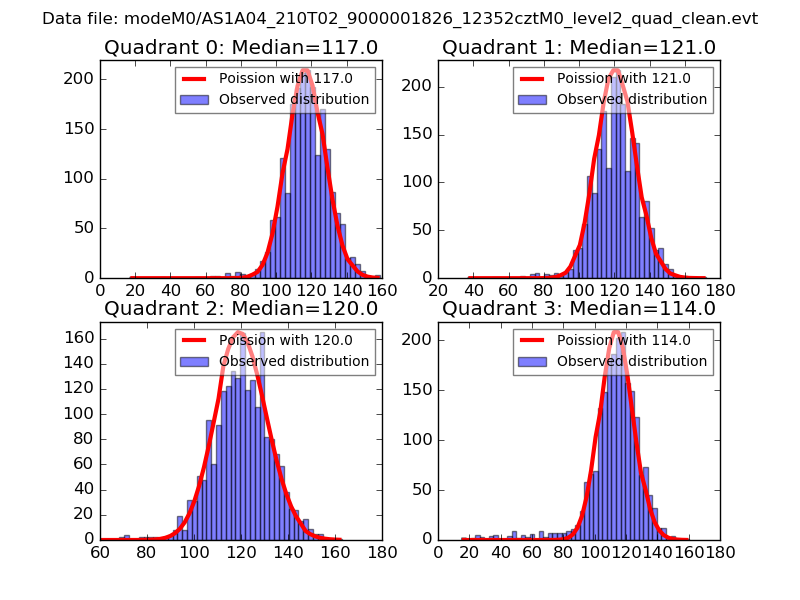 |
 |
| Quadrant-wise count rates Data is divided into 100 sec bins |
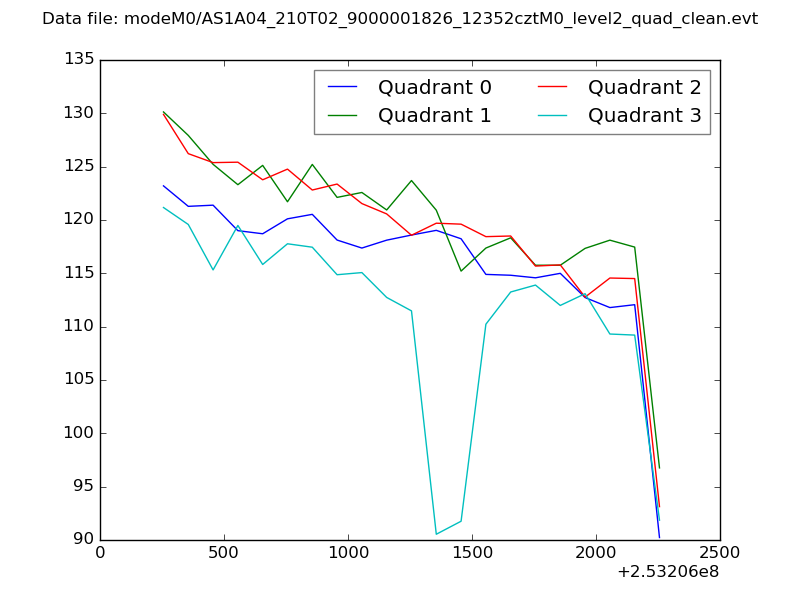 |
|
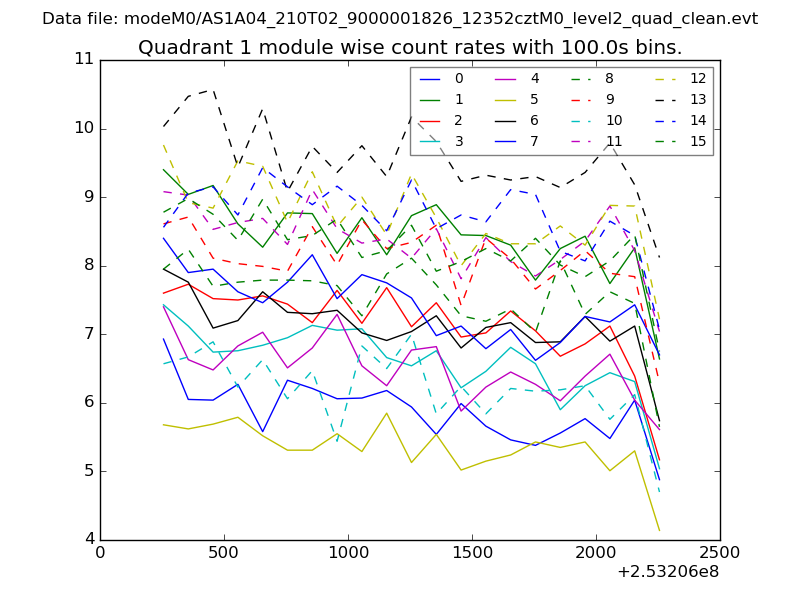
| Module-wise count rates for Quadrant A Data is divided into 100 sec bins |
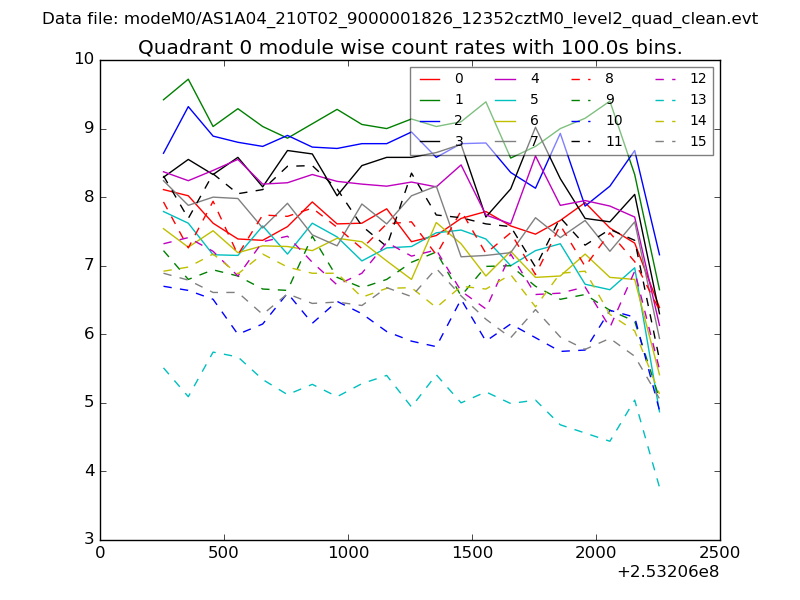 |
 |
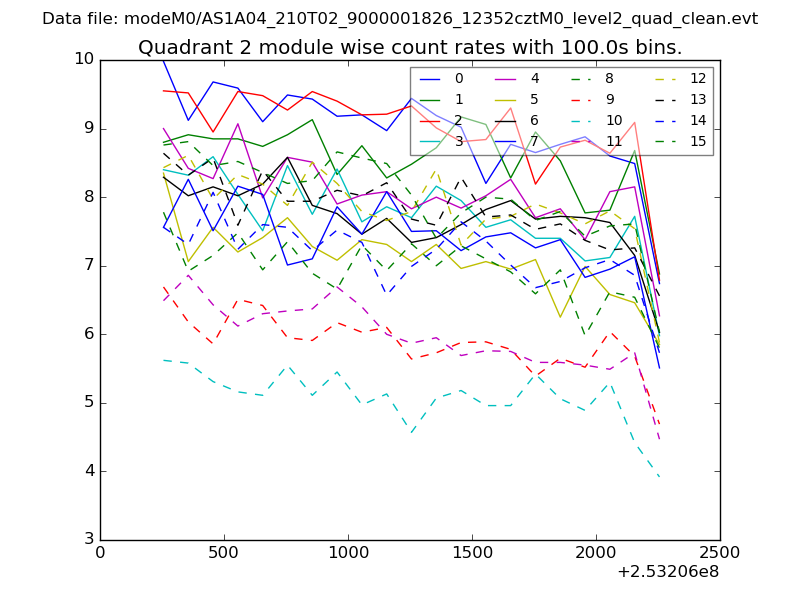
| Module-wise count rates for Quadrant B Data is divided into 100 sec bins |
 |
 |
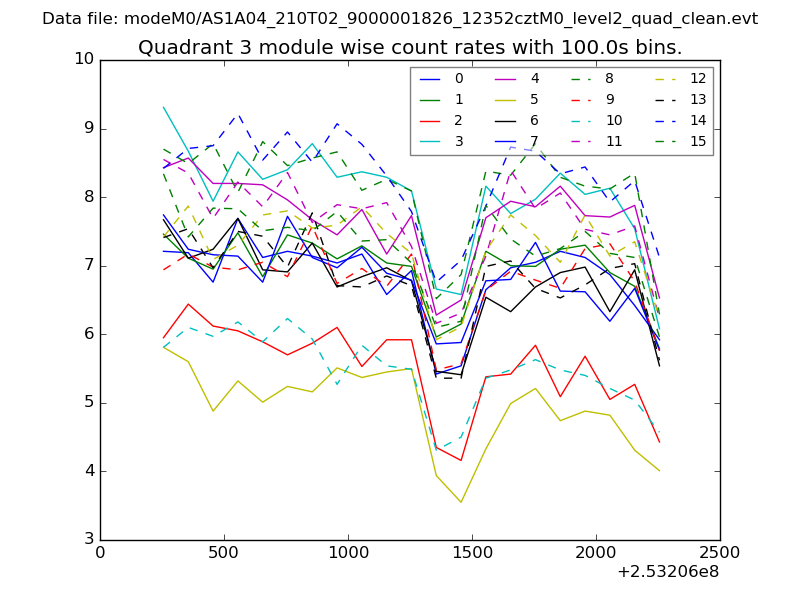
| Module-wise count rates for Quadrant C Data is divided into 100 sec bins |
 |
 |
| Module-wise count rates for Quadrant D Data is divided into 100 sec bins |
 |
 |
| Parameter | Plot |
|---|---|
| CZT HV Monitor | 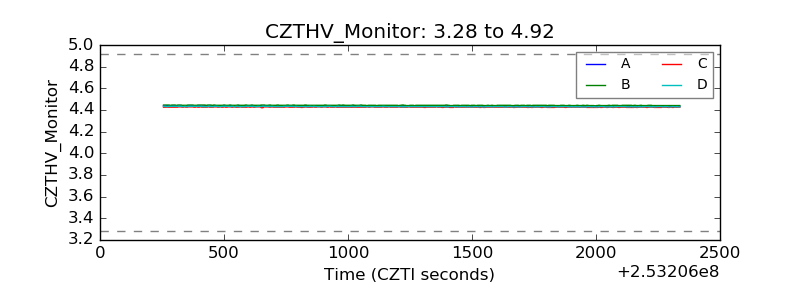 |
| D_VDD | 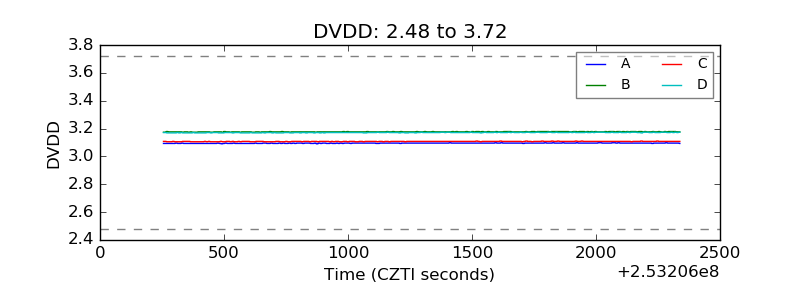 |
| Temperature 1 | 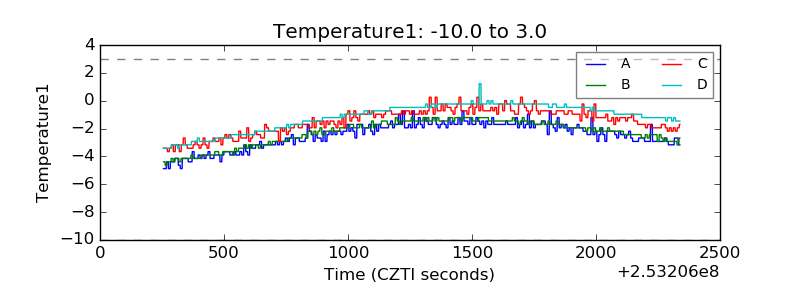 |
| Veto HV Monitor | 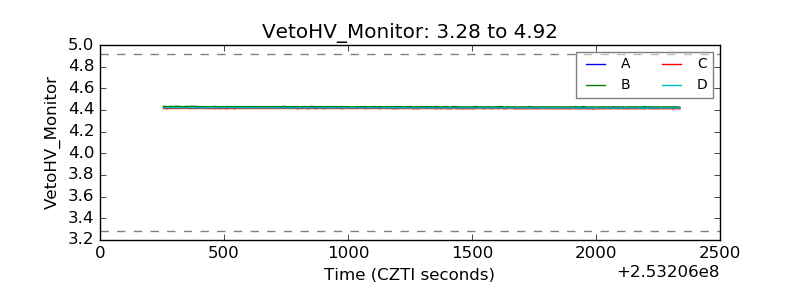 |
| Veto LLD | 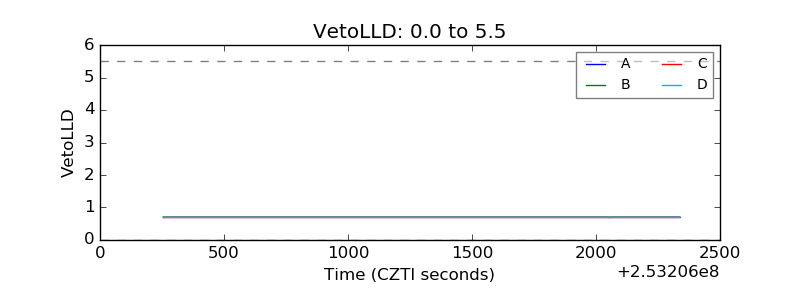 |
| Alpha Counter | 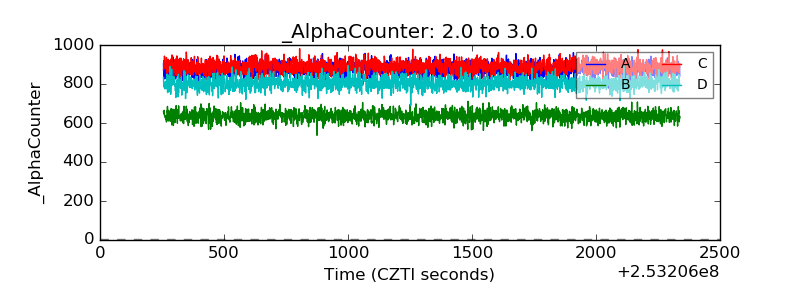 |
| _CPM_Rate | 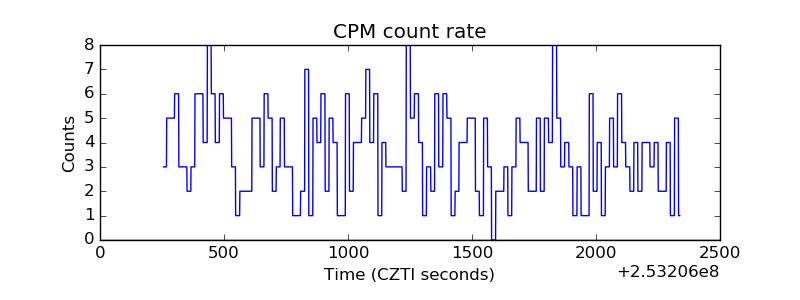 |
| CZT Counter | 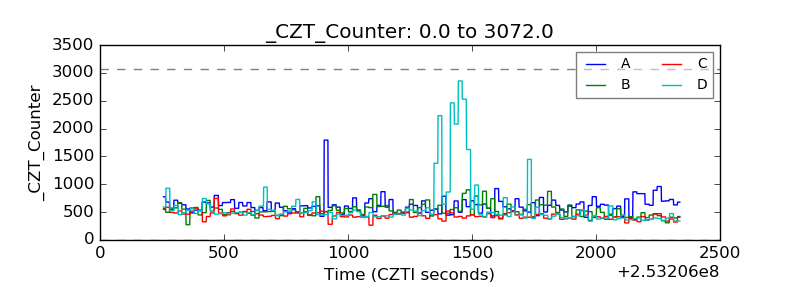 |
| +2.5 Volts monitor |  |
| +5 Volts monitor |  |
| _ROLL_ROT | 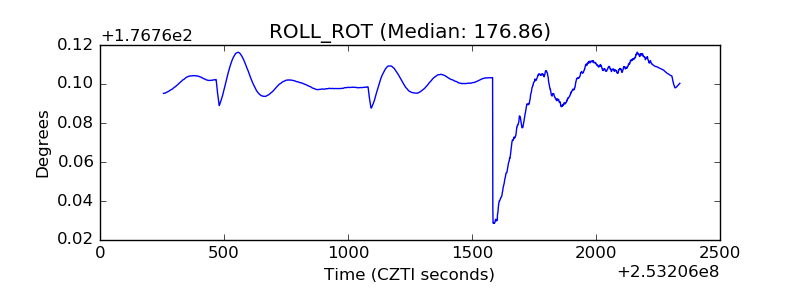 |
| _Roll_DEC | 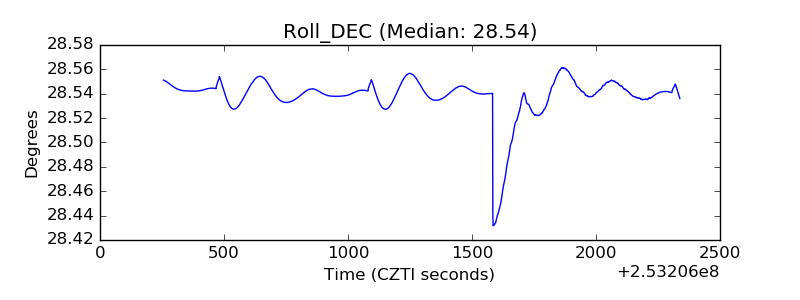 |
| _Roll_RA | 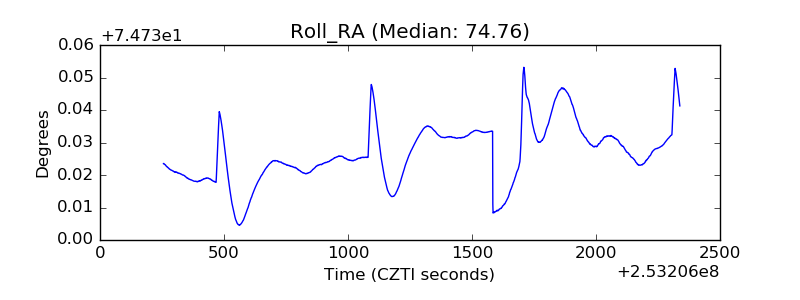 |
| Veto Counter | 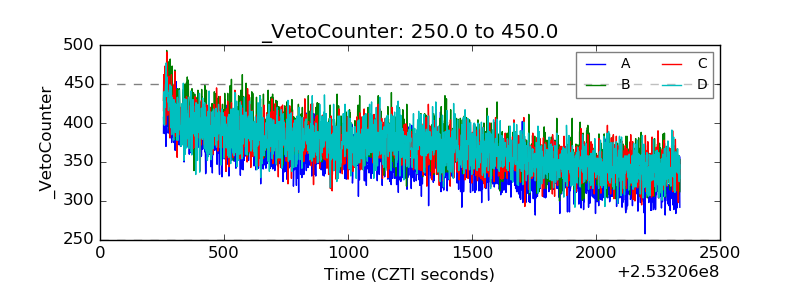 |