| Param | Original file | Final file |
|---|---|---|
| Filename | modeM0/AS1A04_210T03_9000001830_12355cztM0_level2.evt | modeM0/AS1A04_210T03_9000001830_12355cztM0_level2_quad_clean.evt |
| Size (bytes) | 745,862,400 | 108,129,600 |
| Size | 711.3 MB | 103.1 MB |
| Events in quadrant A | 6,487,772 | 651,064 |
| Events in quadrant B | 5,427,659 | 665,823 |
| Events in quadrant C | 4,433,751 | 663,770 |
| Events in quadrant D | 5,589,635 | 627,816 |
| Mode M9 | |||
|---|---|---|---|
| Quadrant | BADHDUFLAG | Total packets | Discarded packets |
| A | 0 | 16 | 0 |
| B | 0 | 16 | 0 |
| C | 0 | 16 | 0 |
| D | 0 | 16 | 0 |
| Mode M0 | |||
|---|---|---|---|
| Quadrant | BADHDUFLAG | Total packets | Discarded packets |
| A | 0 | 26011 | 3 |
| B | 0 | 22424 | 2 |
| C | 0 | 19851 | 2 |
| D | 0 | 23371 | 2 |
| Mode SS | |||
|---|---|---|---|
| Quadrant | BADHDUFLAG | Total packets | Discarded packets |
| A | 0 | 196 | 0 |
| B | 0 | 196 | 0 |
| C | 0 | 196 | 0 |
| D | 0 | 196 | 0 |
| Quadrant | Total seconds | Saturated seconds | Saturation percentage |
|---|---|---|---|
| A | 9602 | 185 | 1.926682% |
| B | 9602 | 222 | 2.312018% |
| C | 9602 | 55 | 0.572797% |
| D | 9602 | 335 | 3.488856% |
Noise dominated data is calculated using 1-second bins in cleaned event files. If a bin has >2000 counts, and if more than 50% of those come from <1% of pixels, then it is considered to be noise-dominated and hence unusable.
| Quadrant | # 1 sec bins | Bins with >0 counts | Bins with >2000 counts | High rate bins dominated by noise | Noise dominated (total time) | Noise dominated (detector-on time) | Marked lightcurve |
|---|---|---|---|---|---|---|---|
| A | 11203 | 9605 | 7 | 7 | 0.06% | 0.07% |  |
| B | 11203 | 9605 | 87 | 87 | 0.78% | 0.91% |  |
| C | 11203 | 9605 | 26 | 26 | 0.23% | 0.27% |  |
| D | 11203 | 9605 | 366 | 366 | 3.27% | 3.81% | 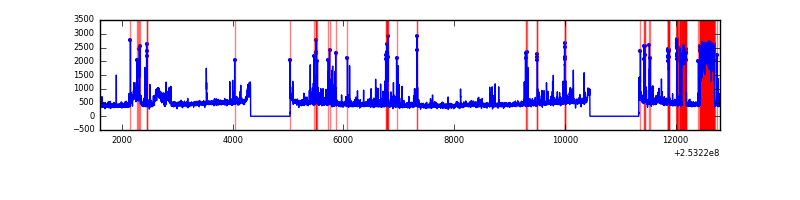 |
Top three noisy pixels from each quadrant. If the there are fewer than three noisy pixels in the level2.evt file, extra rows are filled as -1
| Pixel properties | Quadrant properties | ||||||
|---|---|---|---|---|---|---|---|
| Quadrant | DetID | PixID | Counts | Sigma | Mean | Median | Sigma |
| A | 13 | 251 | 712486 | 3053.28 | 1123 | 1098 | 233.0 |
| A | 8 | 15 | 656461 | 2812.82 | 1123 | 1098 | 233.0 |
| A | 1 | 162 | 331683 | 1418.87 | 1123 | 1098 | 233.0 |
| B | 4 | 239 | 473590 | 2169.01 | 1130 | 1098 | 217.8 |
| B | 0 | 85 | 351247 | 1607.39 | 1130 | 1098 | 217.8 |
| B | 0 | 230 | 46305 | 207.53 | 1130 | 1098 | 217.8 |
| C | 15 | 208 | 130945 | 506.84 | 1101 | 1107 | 256.2 |
| C | 14 | 234 | 8775 | 29.93 | 1101 | 1107 | 256.2 |
| C | 13 | 61 | 8030 | 27.03 | 1101 | 1107 | 256.2 |
| D | 1 | 52 | 1065942 | 4044.49 | 1091 | 1061 | 263.3 |
| D | 13 | 104 | 195394 | 738.09 | 1091 | 1061 | 263.3 |
| D | 10 | 157 | 74831 | 280.18 | 1091 | 1061 | 263.3 |
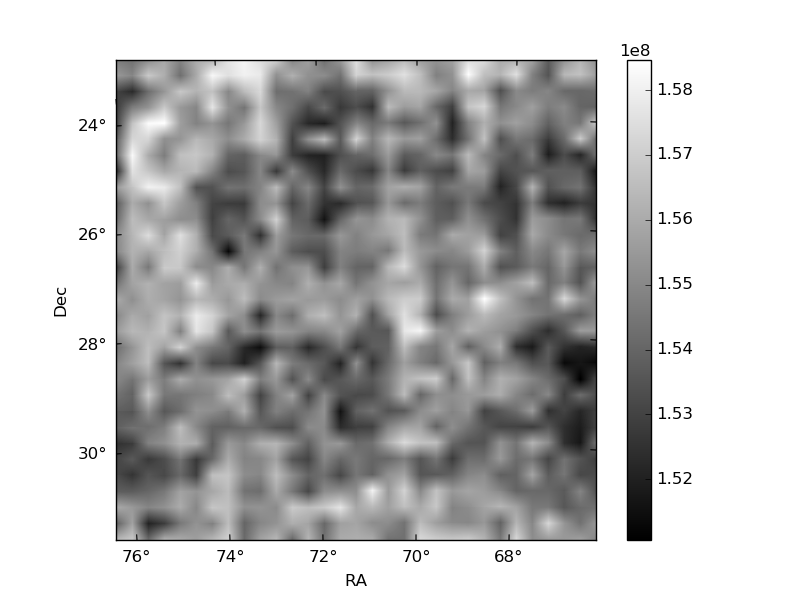
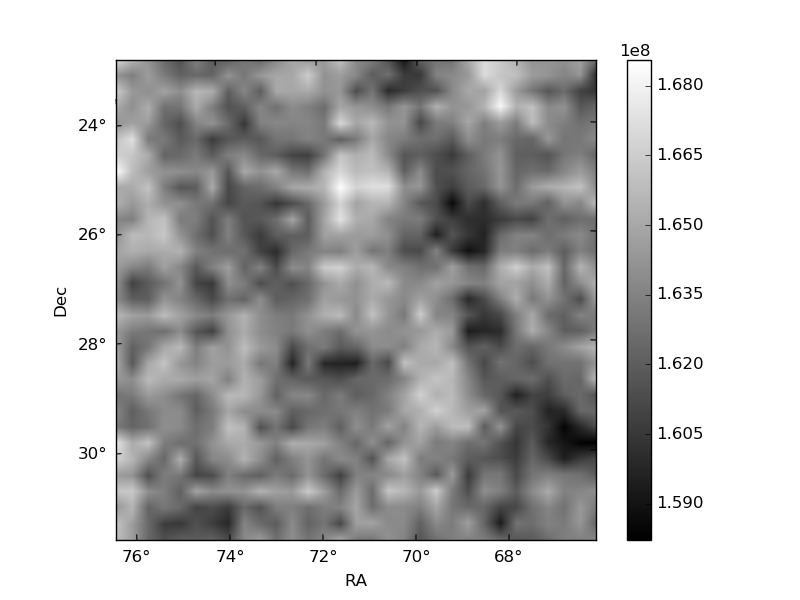
Histogram calculated using DETX and DETY for each event in the final _common_clean file
| Quadrant A | 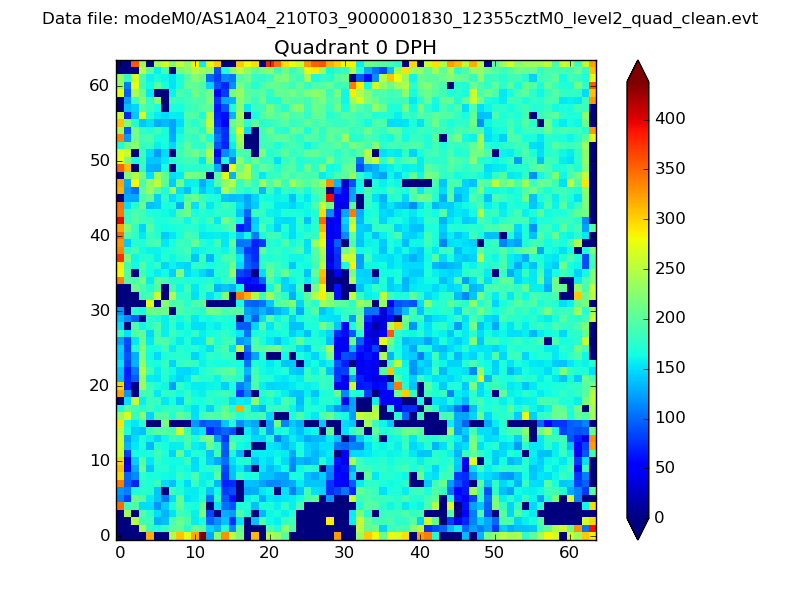 |
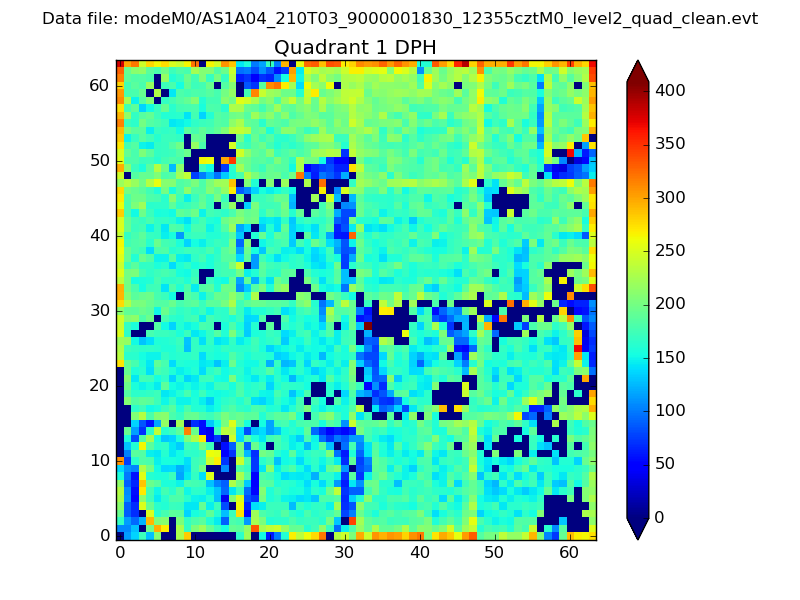 |
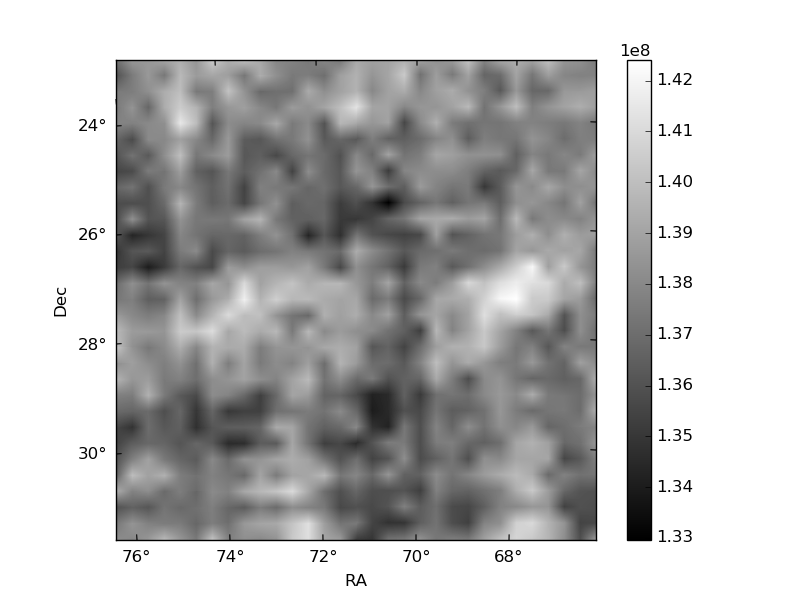
Quadrant B |
|---|---|---|---|
| Quadrant D | 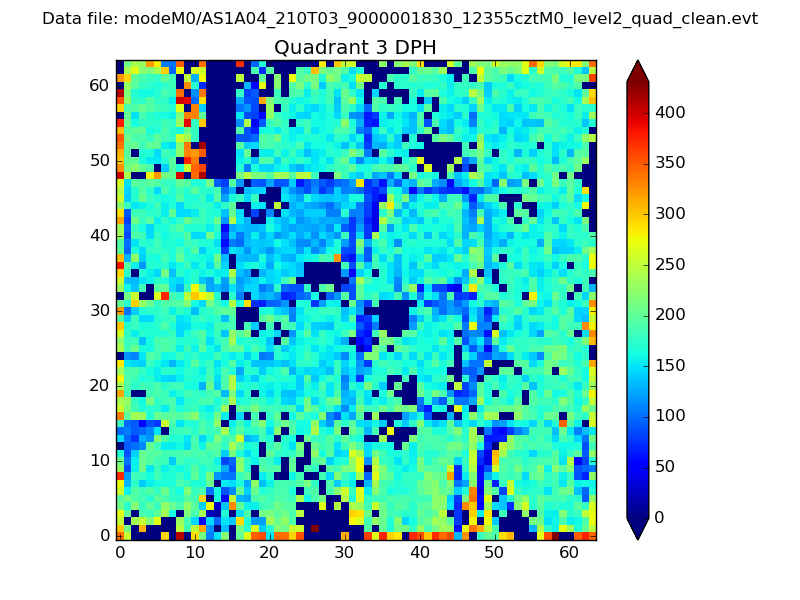 |
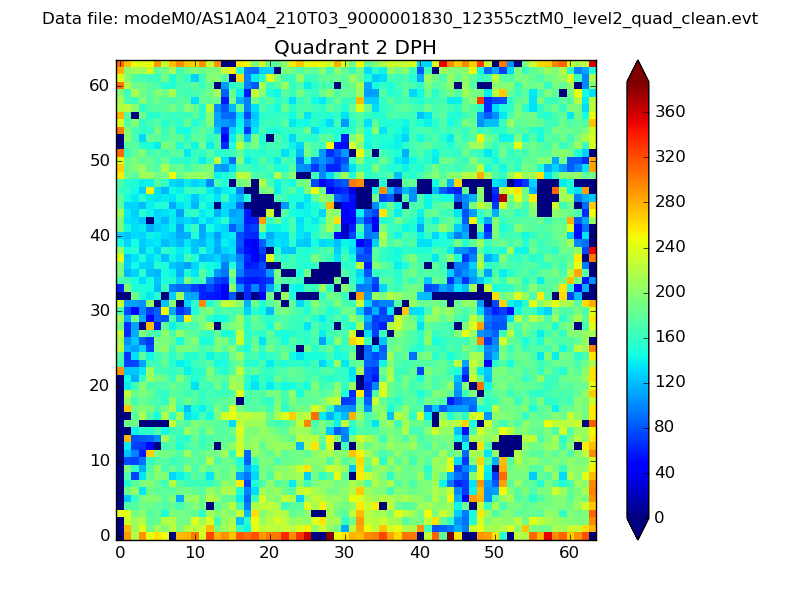 |
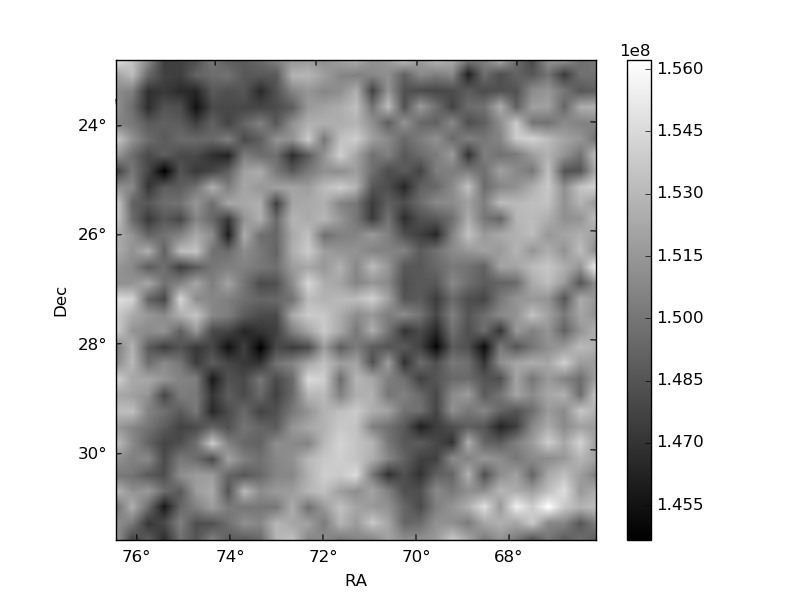
Quadrant C |
| Plot type | Count rate plots | Images |
|---|---|---|
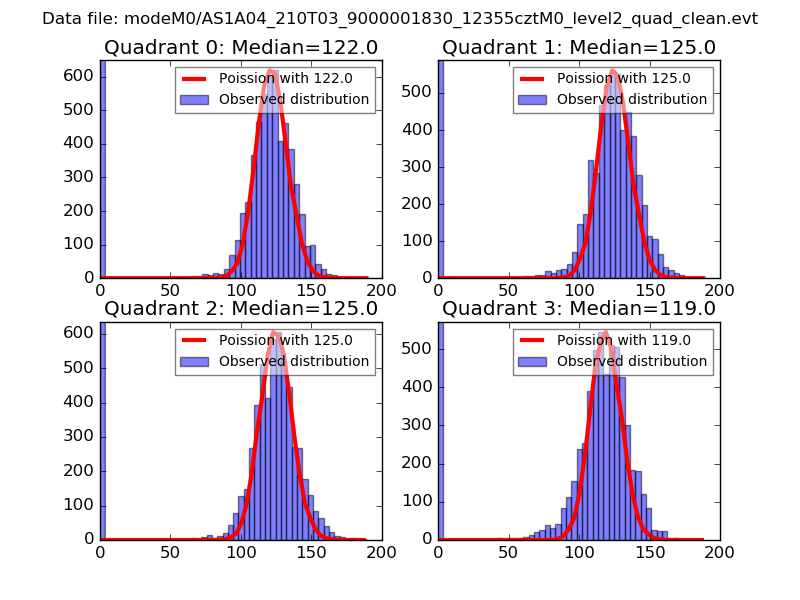
| Comparison with Poisson distribution Blue bars denote a histogram of data divided into 1 sec bins. Red curve is a Poisson curve with rate = median count rate of data. |
 |
 |
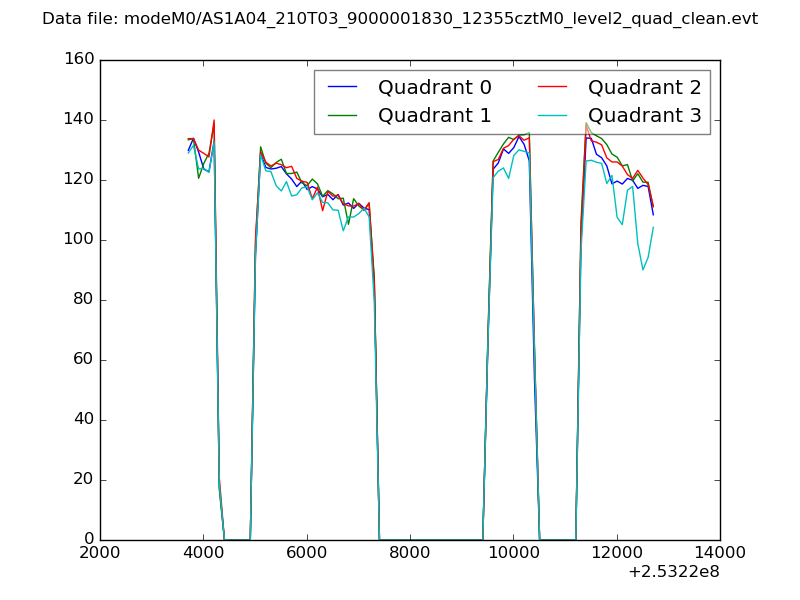
| Quadrant-wise count rates Data is divided into 100 sec bins |
 |
|
| Module-wise count rates for Quadrant A Data is divided into 100 sec bins |
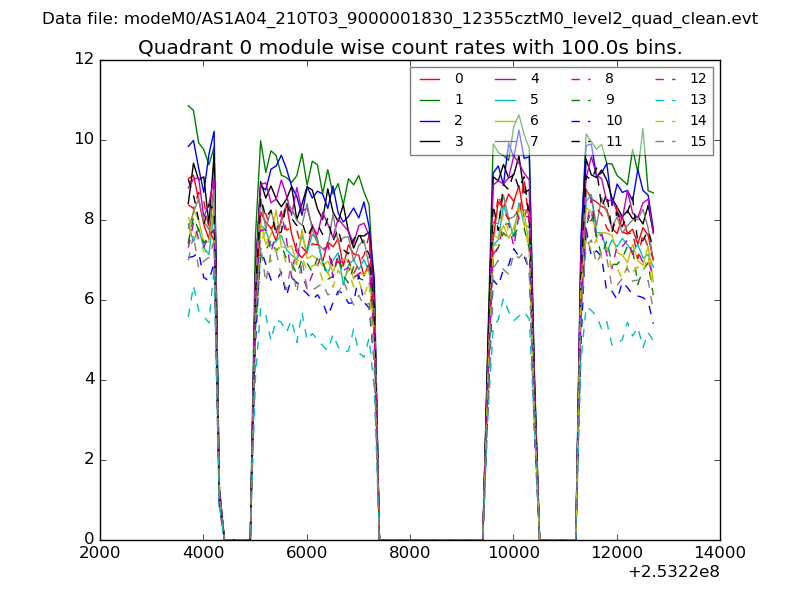 |
 |
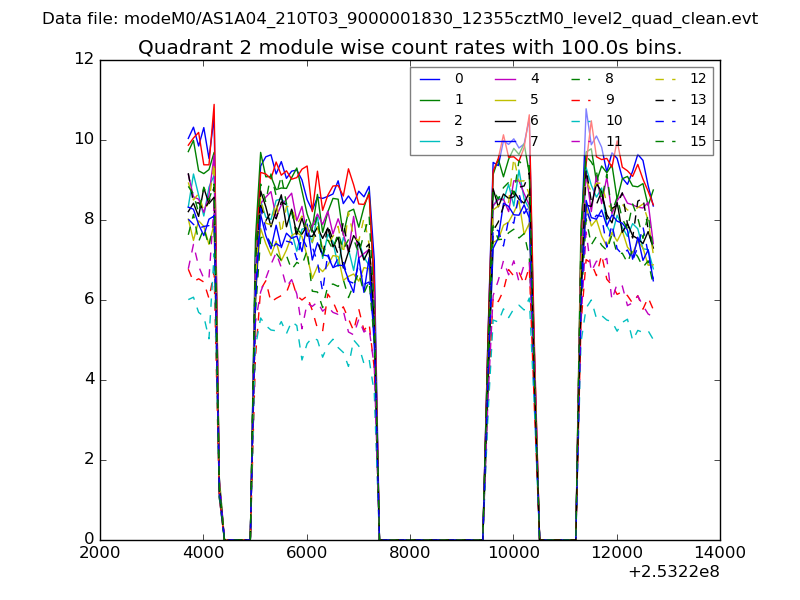
| Module-wise count rates for Quadrant B Data is divided into 100 sec bins |
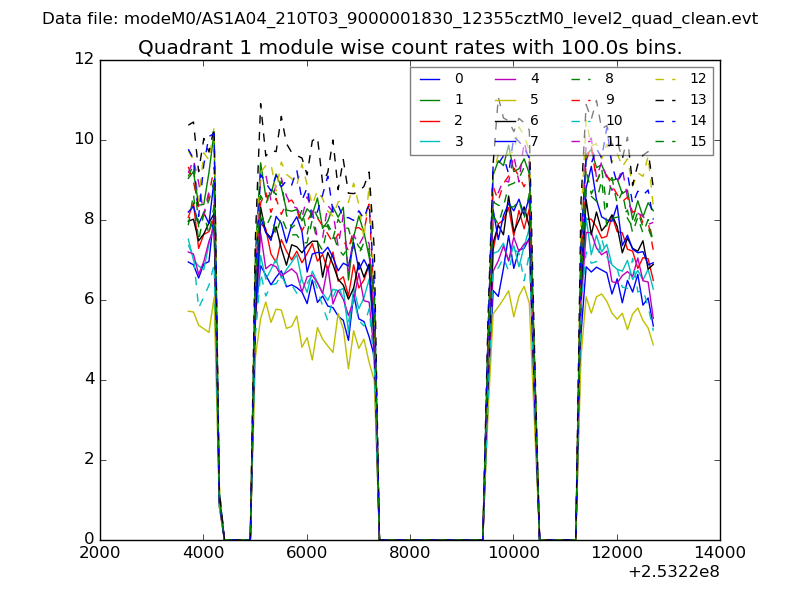 |
 |
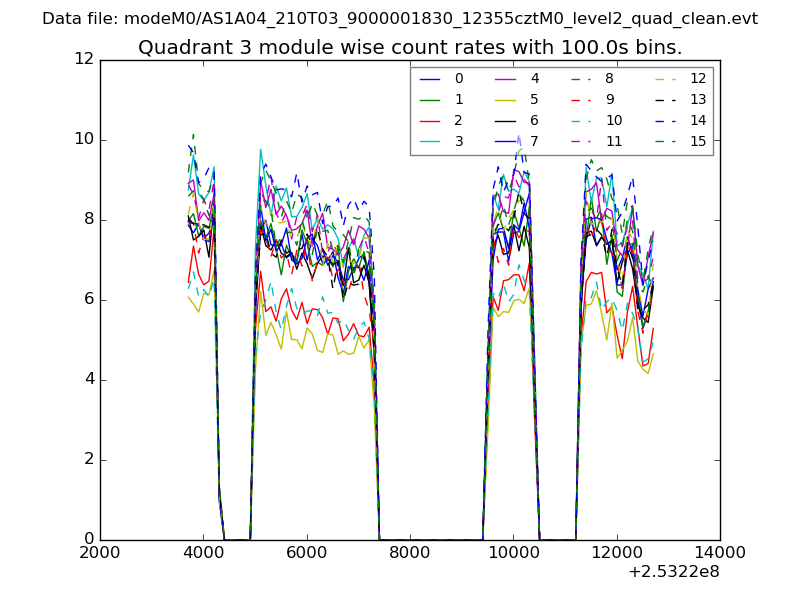
| Module-wise count rates for Quadrant C Data is divided into 100 sec bins |
 |
 |
| Module-wise count rates for Quadrant D Data is divided into 100 sec bins |
 |
 |
| Parameter | Plot |
|---|---|
| CZT HV Monitor | 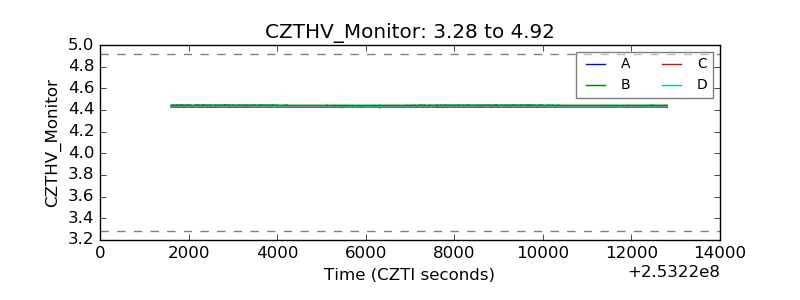 |
| D_VDD | 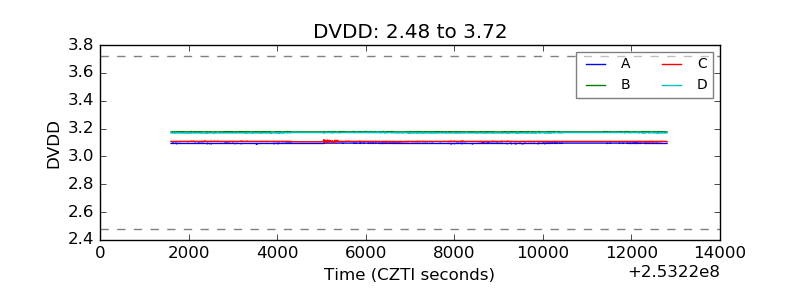 |
| Temperature 1 | 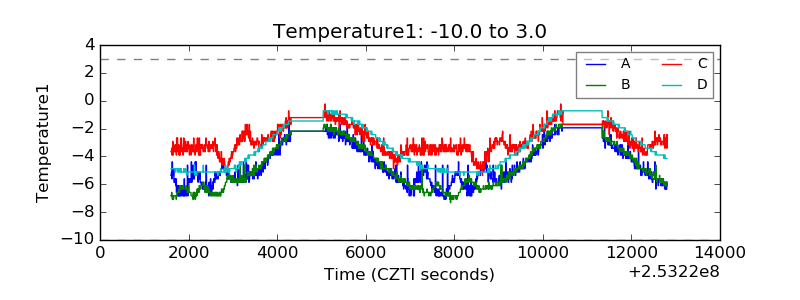 |
| Veto HV Monitor | 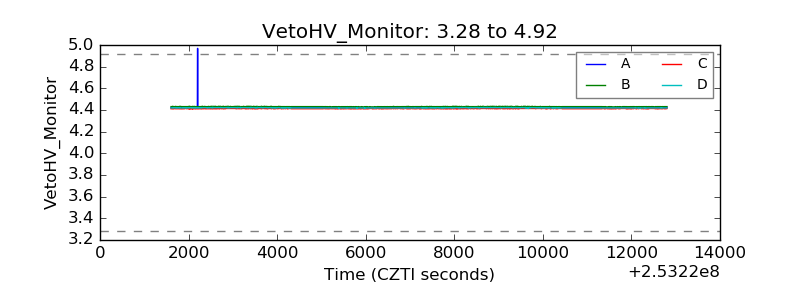 |
| Veto LLD | 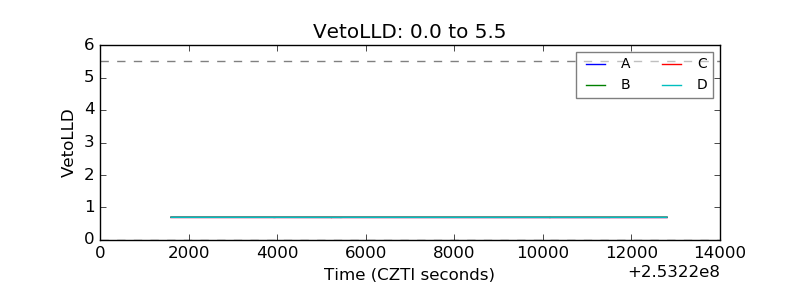 |
| Alpha Counter | 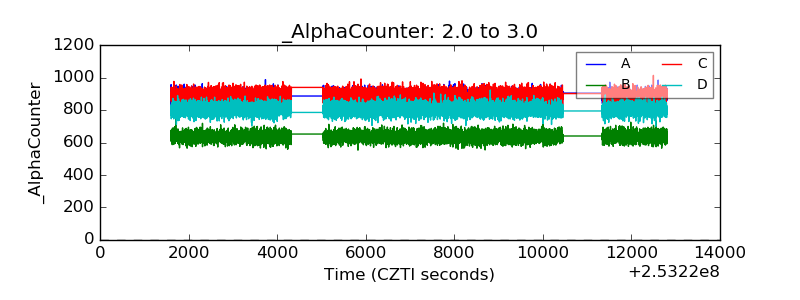 |
| _CPM_Rate | 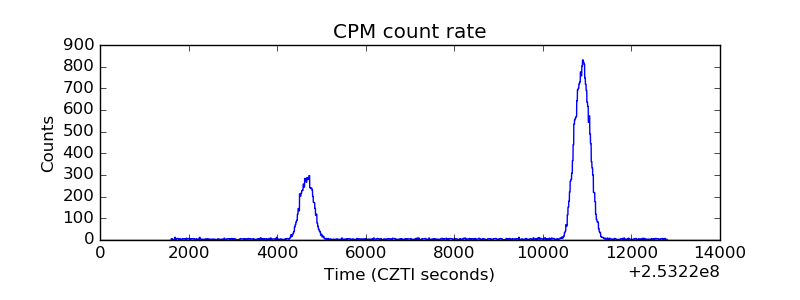 |
| CZT Counter | 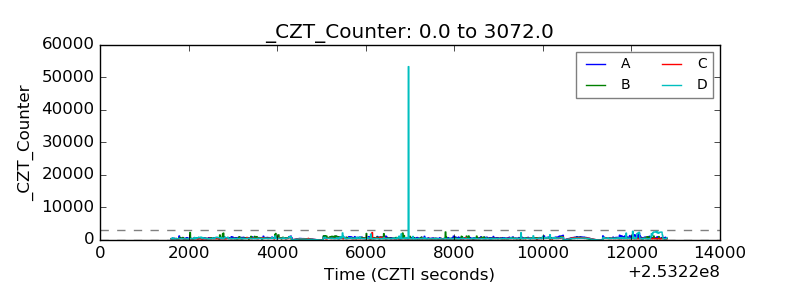 |
| +2.5 Volts monitor |  |
| +5 Volts monitor |  |
| _ROLL_ROT | 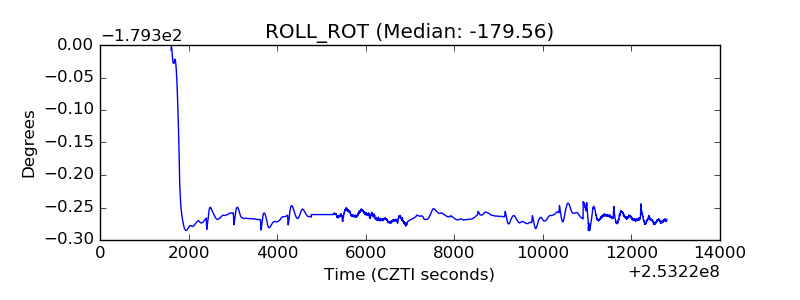 |
| _Roll_DEC | 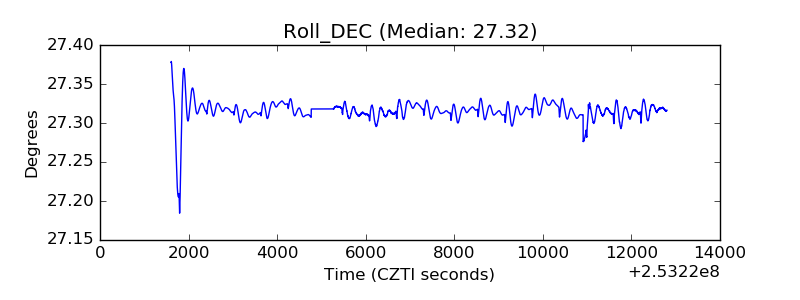 |
| _Roll_RA | 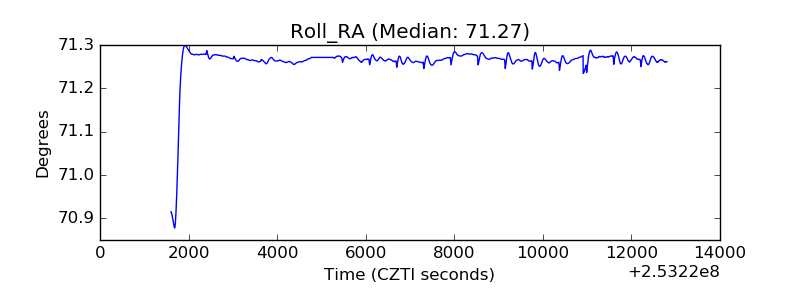 |
| Veto Counter | 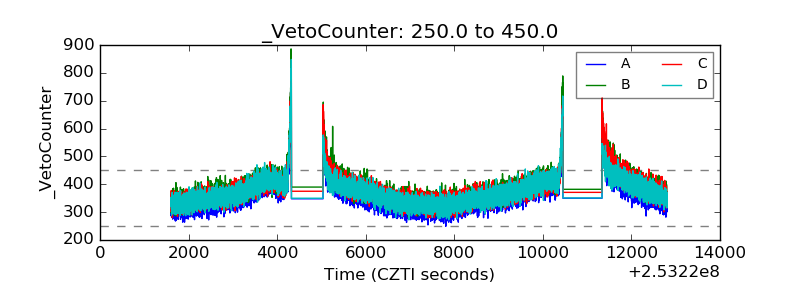 |