| Param | Original file | Final file |
|---|---|---|
| Filename | modeM0/AS1A04_210T03_9000001830_12356cztM0_level2.evt | modeM0/AS1A04_210T03_9000001830_12356cztM0_level2_quad_clean.evt |
| Size (bytes) | 545,109,120 | 89,426,880 |
| Size | 519.9 MB | 85.3 MB |
| Events in quadrant A | 4,765,249 | 562,426 |
| Events in quadrant B | 3,318,285 | 583,986 |
| Events in quadrant C | 3,092,675 | 572,693 |
| Events in quadrant D | 4,882,778 | 526,091 |
| Mode M9 | |||
|---|---|---|---|
| Quadrant | BADHDUFLAG | Total packets | Discarded packets |
| A | 0 | 18 | 0 |
| B | 0 | 18 | 0 |
| C | 0 | 18 | 0 |
| D | 0 | 19 | 0 |
| Mode M0 | |||
|---|---|---|---|
| Quadrant | BADHDUFLAG | Total packets | Discarded packets |
| A | 0 | 18861 | 3 |
| B | 0 | 14154 | 2 |
| C | 0 | 13825 | 2 |
| D | 0 | 19193 | 2 |
| Mode SS | |||
|---|---|---|---|
| Quadrant | BADHDUFLAG | Total packets | Discarded packets |
| A | 0 | 134 | 0 |
| B | 0 | 134 | 0 |
| C | 0 | 134 | 0 |
| D | 0 | 134 | 0 |
| Quadrant | Total seconds | Saturated seconds | Saturation percentage |
|---|---|---|---|
| A | 6638 | 99 | 1.491413% |
| B | 6638 | 32 | 0.482073% |
| C | 6638 | 17 | 0.256101% |
| D | 6638 | 419 | 6.312142% |
Noise dominated data is calculated using 1-second bins in cleaned event files. If a bin has >2000 counts, and if more than 50% of those come from <1% of pixels, then it is considered to be noise-dominated and hence unusable.
| Quadrant | # 1 sec bins | Bins with >0 counts | Bins with >2000 counts | High rate bins dominated by noise | Noise dominated (total time) | Noise dominated (detector-on time) | Marked lightcurve |
|---|---|---|---|---|---|---|---|
| A | 7674 | 6640 | 6 | 6 | 0.08% | 0.09% | 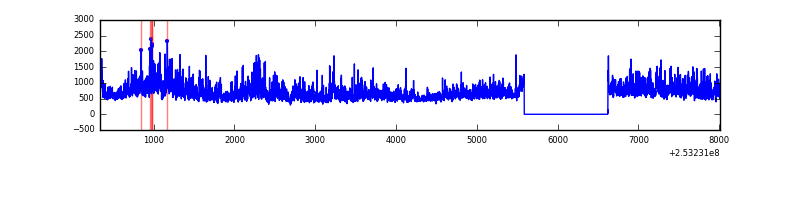 |
| B | 7674 | 6640 | 13 | 13 | 0.17% | 0.20% | 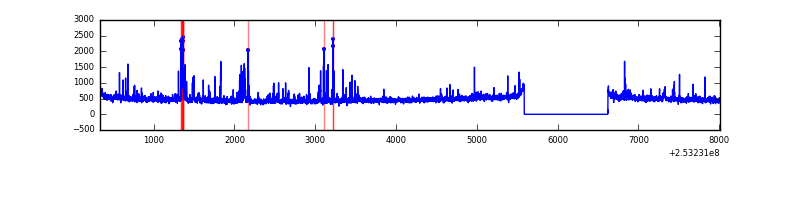 |
| C | 7674 | 6640 | 5 | 5 | 0.07% | 0.08% | 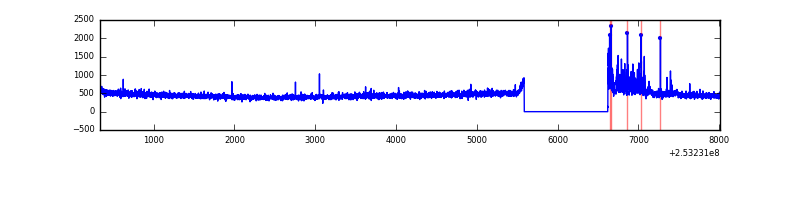 |
| D | 7674 | 6640 | 517 | 517 | 6.74% | 7.79% | 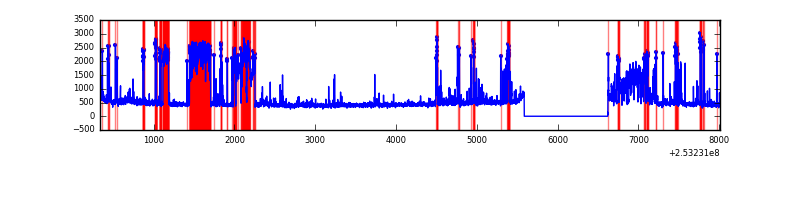 |
Top three noisy pixels from each quadrant. If the there are fewer than three noisy pixels in the level2.evt file, extra rows are filled as -1
| Pixel properties | Quadrant properties | ||||||
|---|---|---|---|---|---|---|---|
| Quadrant | DetID | PixID | Counts | Sigma | Mean | Median | Sigma |
| A | 8 | 15 | 692241 | 4407.49 | 772 | 754 | 156.9 |
| A | 13 | 251 | 436983 | 2780.49 | 772 | 754 | 156.9 |
| A | 1 | 162 | 269985 | 1716.06 | 772 | 754 | 156.9 |
| B | 4 | 239 | 107611 | 715.31 | 781 | 763 | 149.4 |
| B | 0 | 230 | 67642 | 447.73 | 781 | 763 | 149.4 |
| B | 0 | 197 | 26045 | 169.26 | 781 | 763 | 149.4 |
| C | 15 | 208 | 118818 | 664.46 | 761 | 766 | 177.7 |
| C | 13 | 61 | 5638 | 27.42 | 761 | 766 | 177.7 |
| C | 14 | 238 | 5084 | 24.3 | 761 | 766 | 177.7 |
| D | 1 | 52 | 1667381 | 9234.15 | 743 | 721 | 180.5 |
| D | 13 | 104 | 101038 | 555.81 | 743 | 721 | 180.5 |
| D | 10 | 199 | 97752 | 537.6 | 743 | 721 | 180.5 |
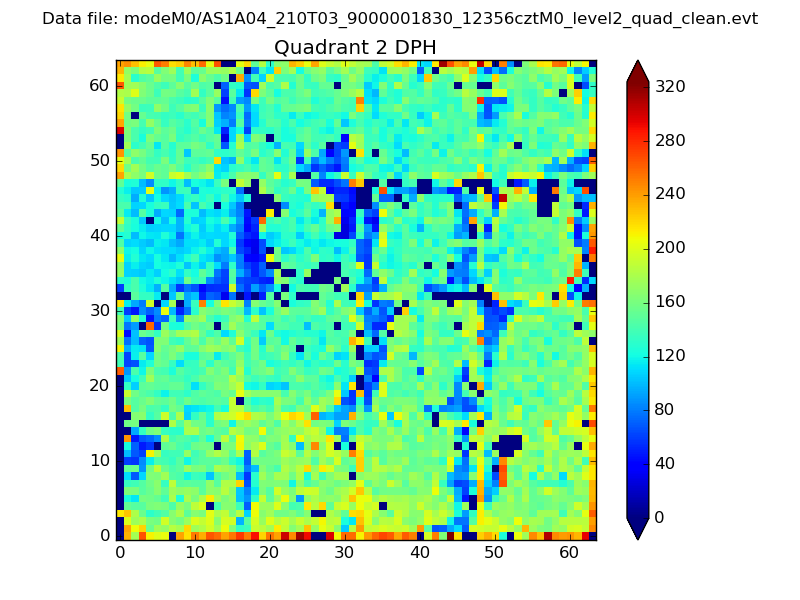
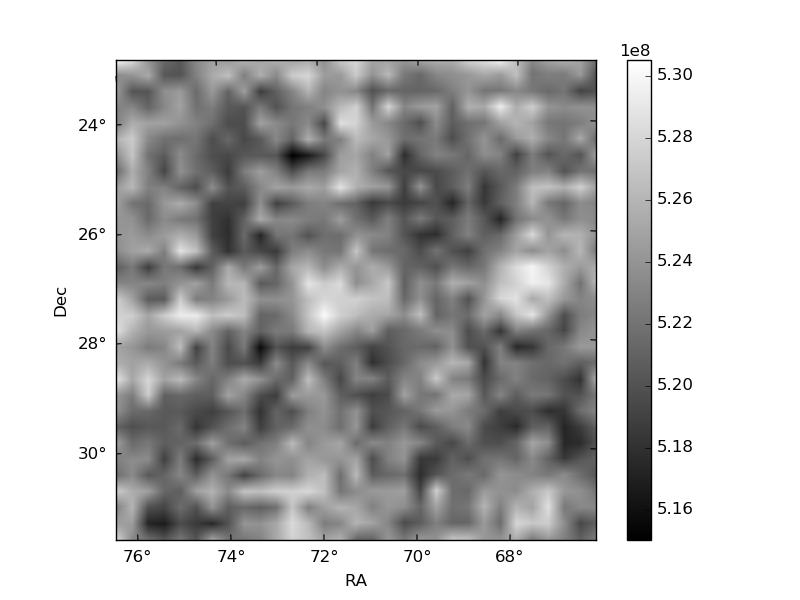
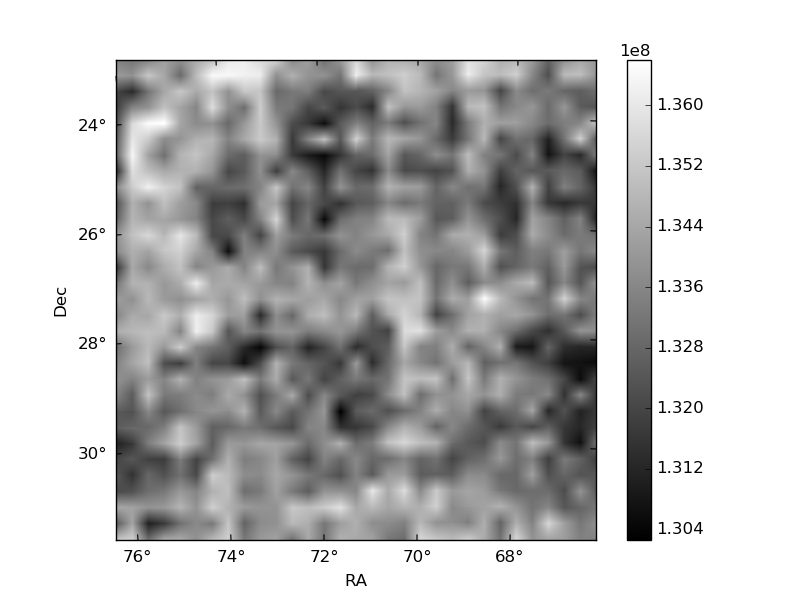
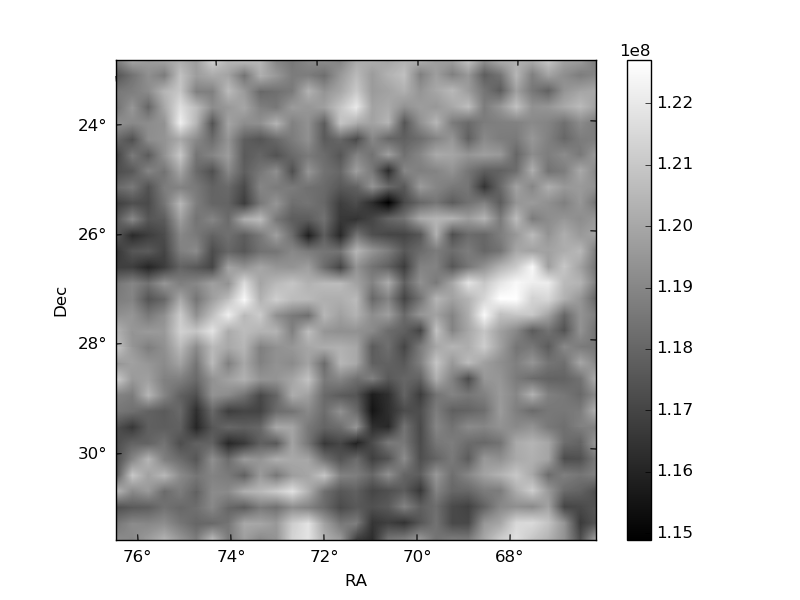
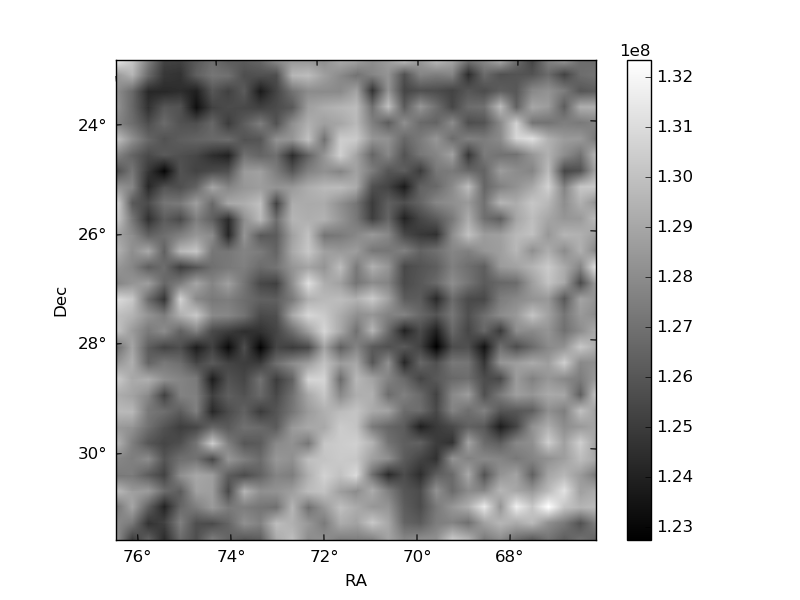
Histogram calculated using DETX and DETY for each event in the final _common_clean file
| Quadrant A | 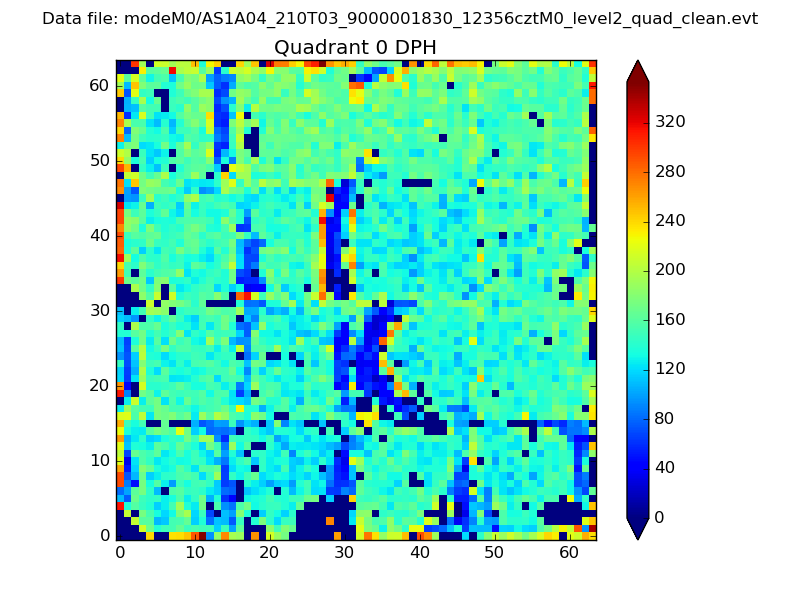 |
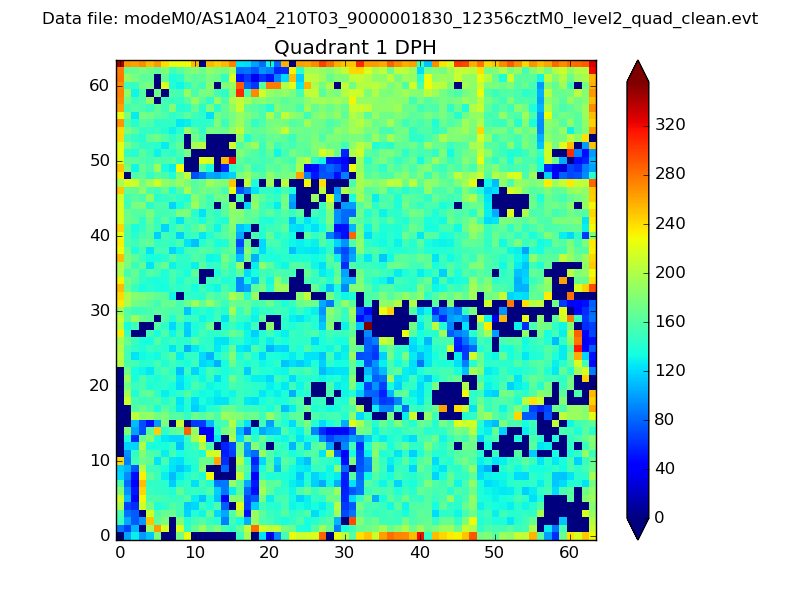 |
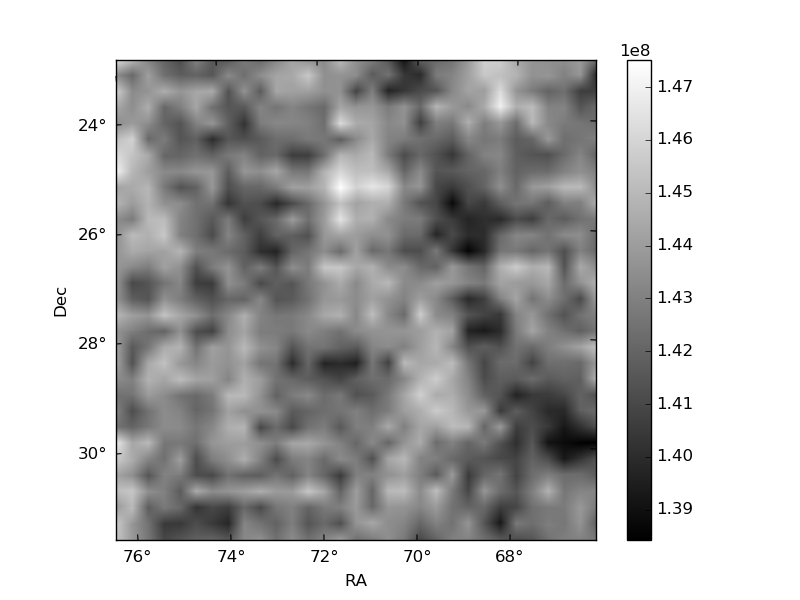
Quadrant B |
|---|---|---|---|
| Quadrant D | 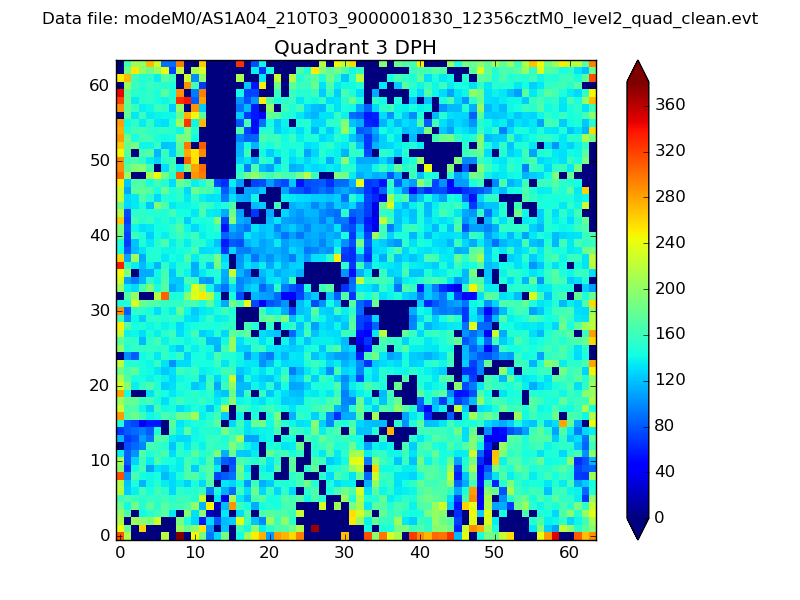 |
 |
Quadrant C |
| Plot type | Count rate plots | Images |
|---|---|---|
| Comparison with Poisson distribution Blue bars denote a histogram of data divided into 1 sec bins. Red curve is a Poisson curve with rate = median count rate of data. |
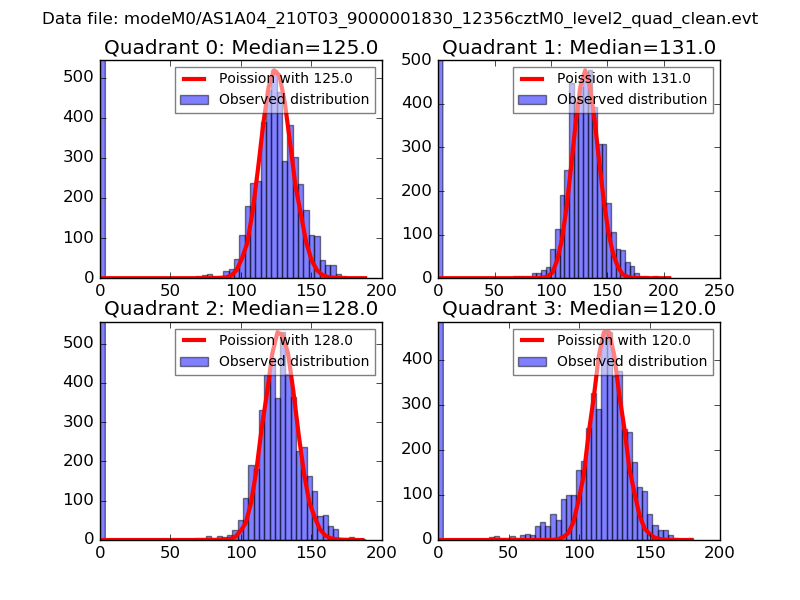 |
 |
| Quadrant-wise count rates Data is divided into 100 sec bins |
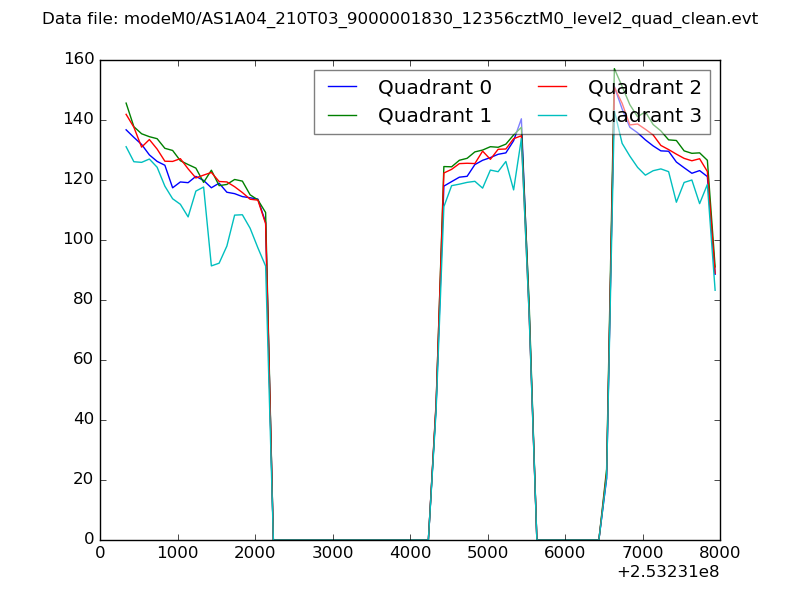 |
|
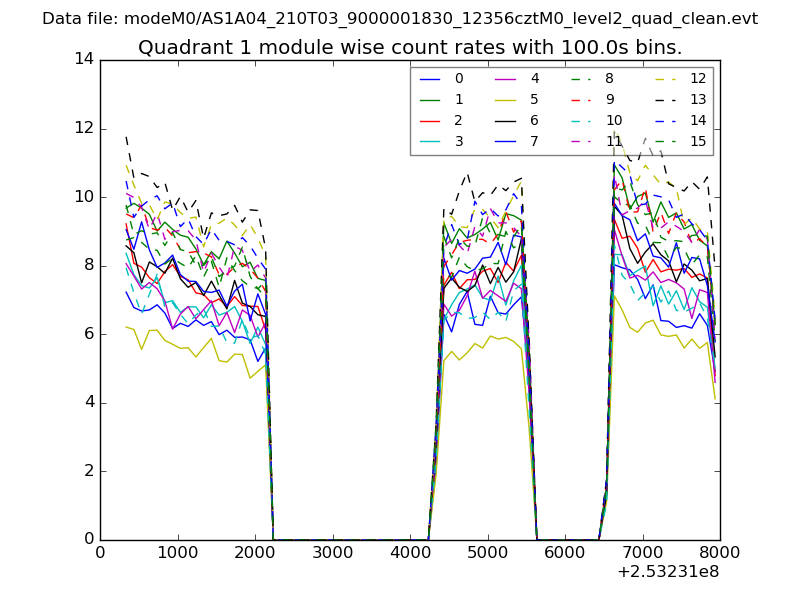
| Module-wise count rates for Quadrant A Data is divided into 100 sec bins |
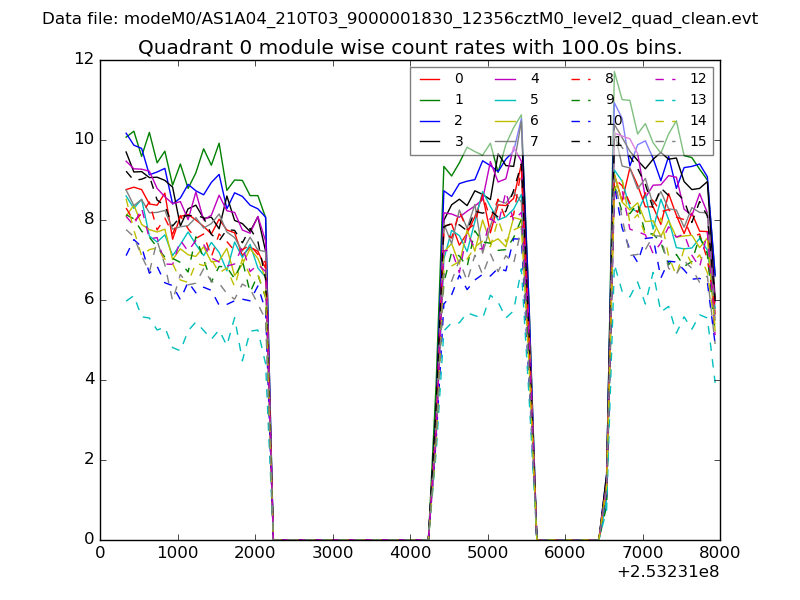 |
 |
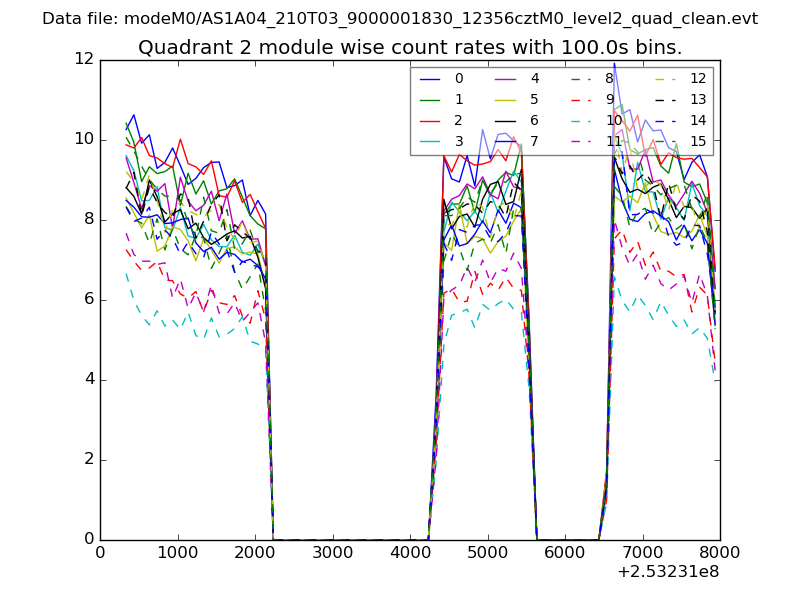
| Module-wise count rates for Quadrant B Data is divided into 100 sec bins |
 |
 |
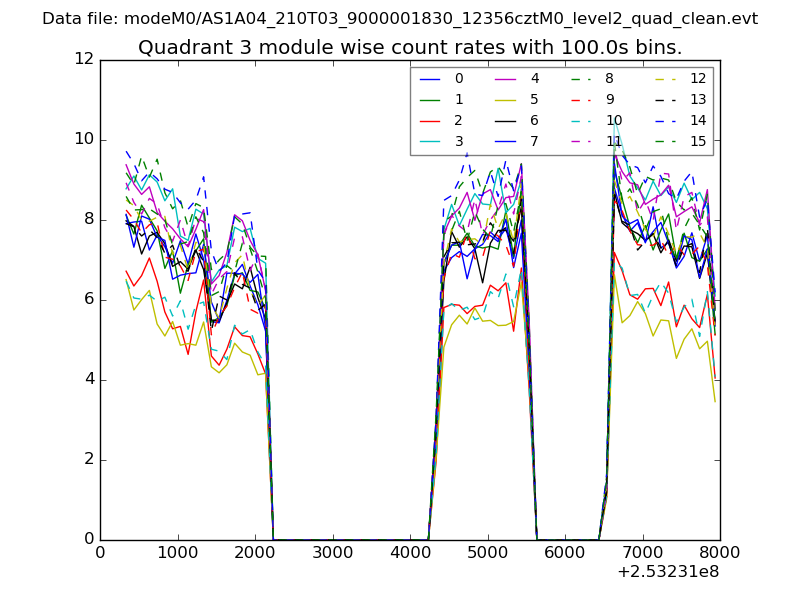
| Module-wise count rates for Quadrant C Data is divided into 100 sec bins |
 |
 |
| Module-wise count rates for Quadrant D Data is divided into 100 sec bins |
 |
 |
| Parameter | Plot |
|---|---|
| CZT HV Monitor | 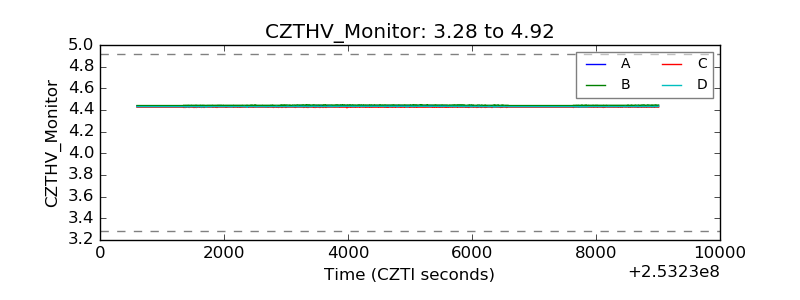 |
| D_VDD | 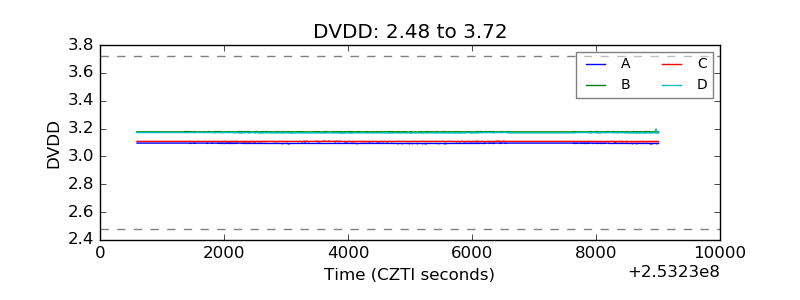 |
| Temperature 1 | 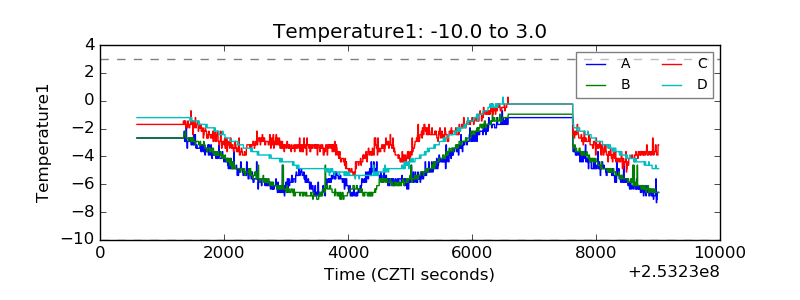 |
| Veto HV Monitor | 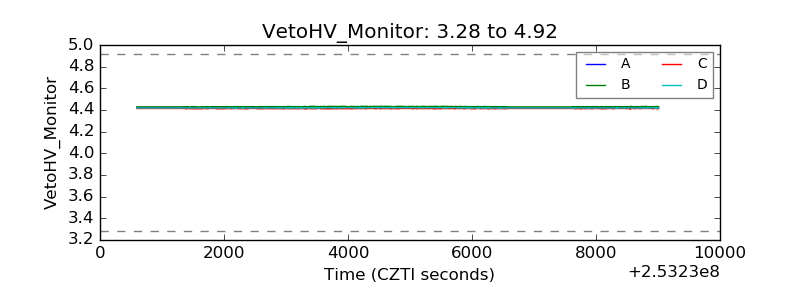 |
| Veto LLD | 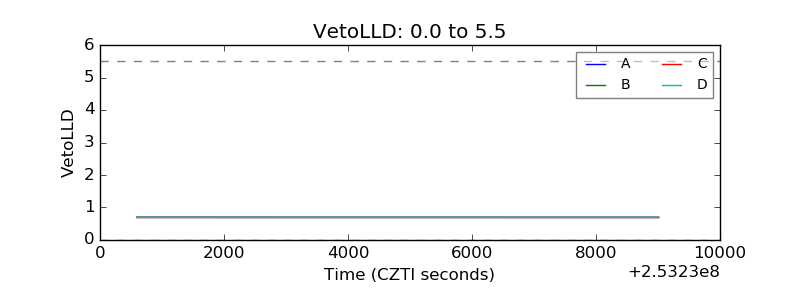 |
| Alpha Counter | 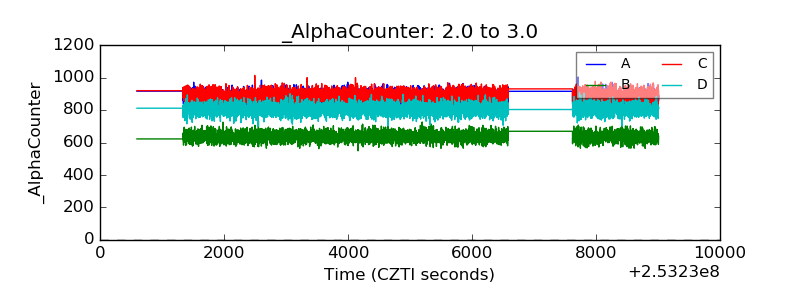 |
| _CPM_Rate | 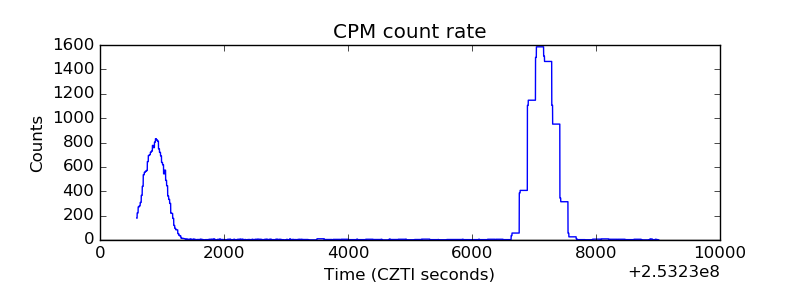 |
| CZT Counter | 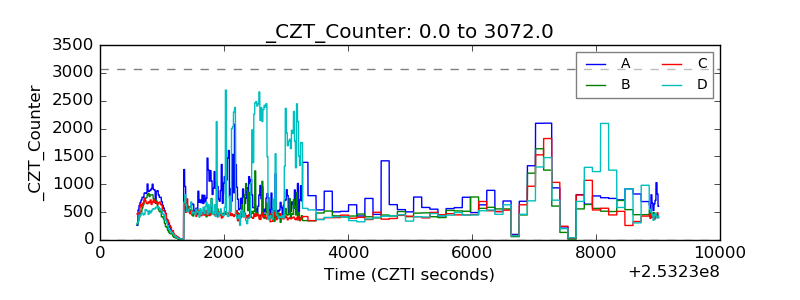 |
| +2.5 Volts monitor |  |
| +5 Volts monitor |  |
| _ROLL_ROT | 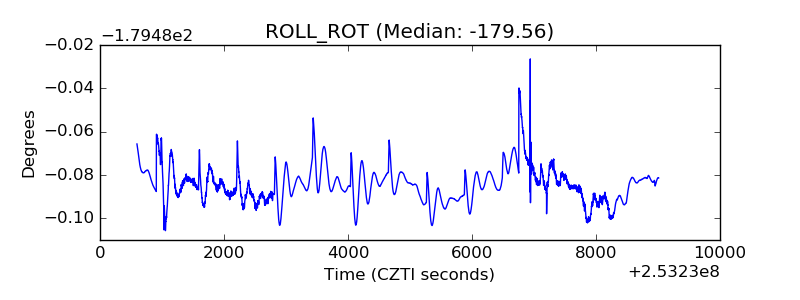 |
| _Roll_DEC | 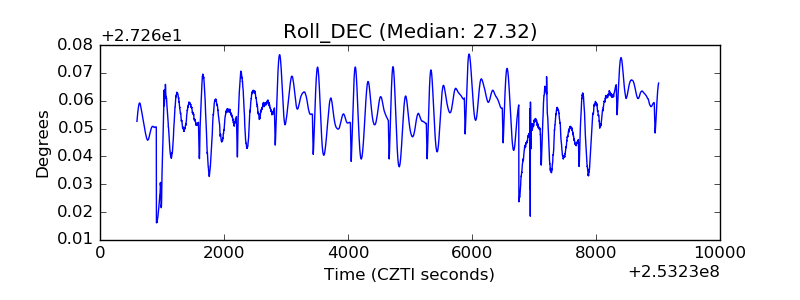 |
| _Roll_RA | 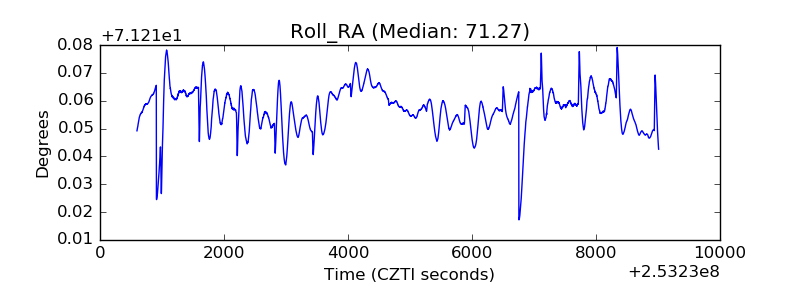 |
| Veto Counter | 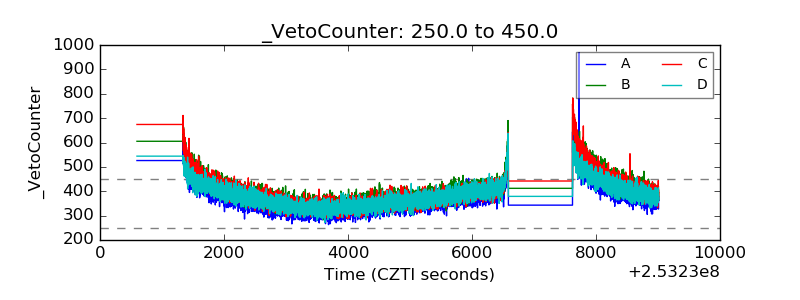 |