| Param | Original file | Final file |
|---|---|---|
| Filename | modeM0/AS1A04_210T04_9000001828_12354cztM0_level2.evt | modeM0/AS1A04_210T04_9000001828_12354cztM0_level2_quad_clean.evt |
| Size (bytes) | 54,184,320 | 13,409,280 |
| Size | 51.7 MB | 12.8 MB |
| Events in quadrant A | 481,178 | 87,035 |
| Events in quadrant B | 391,498 | 88,758 |
| Events in quadrant C | 340,315 | 88,183 |
| Events in quadrant D | 376,948 | 84,832 |
| Mode M0 | |||
|---|---|---|---|
| Quadrant | BADHDUFLAG | Total packets | Discarded packets |
| A | 0 | 1948 | 1 |
| B | 0 | 1569 | 0 |
| C | 0 | 1455 | 0 |
| D | 0 | 1551 | 0 |
| Mode SS | |||
|---|---|---|---|
| Quadrant | BADHDUFLAG | Total packets | Discarded packets |
| A | 0 | 14 | 0 |
| B | 0 | 14 | 0 |
| C | 0 | 14 | 0 |
| D | 0 | 14 | 0 |
| Quadrant | Total seconds | Saturated seconds | Saturation percentage |
|---|---|---|---|
| A | 702 | 5 | 0.712251% |
| B | 702 | 8 | 1.139601% |
| C | 702 | 0 | 0.000000% |
| D | 702 | 1 | 0.142450% |
Noise dominated data is calculated using 1-second bins in cleaned event files. If a bin has >2000 counts, and if more than 50% of those come from <1% of pixels, then it is considered to be noise-dominated and hence unusable.
| Quadrant | # 1 sec bins | Bins with >0 counts | Bins with >2000 counts | High rate bins dominated by noise | Noise dominated (total time) | Noise dominated (detector-on time) | Marked lightcurve |
|---|---|---|---|---|---|---|---|
| A | 703 | 703 | 0 | 0 | 0.00% | 0.00% | 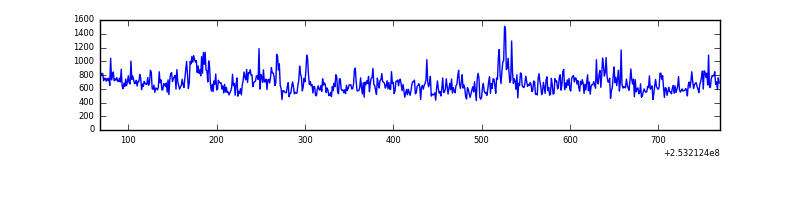 |
| B | 703 | 703 | 3 | 3 | 0.43% | 0.43% | 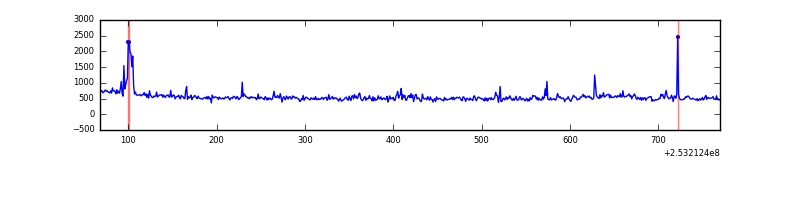 |
| C | 703 | 703 | 0 | 0 | 0.00% | 0.00% | 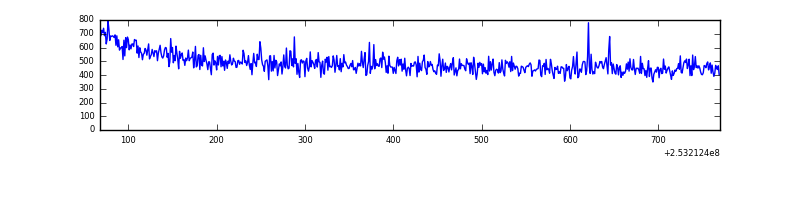 |
| D | 703 | 703 | 1 | 1 | 0.14% | 0.14% | 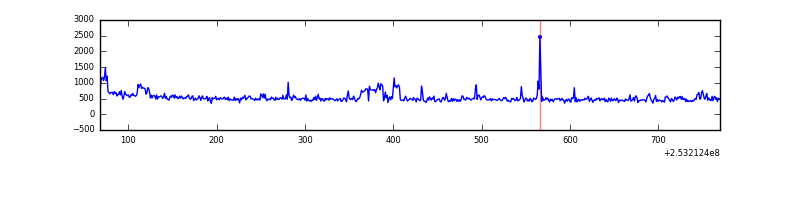 |
Top three noisy pixels from each quadrant. If the there are fewer than three noisy pixels in the level2.evt file, extra rows are filled as -1
| Pixel properties | Quadrant properties | ||||||
|---|---|---|---|---|---|---|---|
| Quadrant | DetID | PixID | Counts | Sigma | Mean | Median | Sigma |
| A | 8 | 15 | 53126 | 2577.17 | 91 | 89 | 20.6 |
| A | 1 | 162 | 24704 | 1196.09 | 91 | 89 | 20.6 |
| A | 13 | 251 | 16141 | 780.0 | 91 | 89 | 20.6 |
| B | 4 | 239 | 14655 | 743.95 | 89 | 87 | 19.6 |
| B | 0 | 219 | 10064 | 509.5 | 89 | 87 | 19.6 |
| B | 10 | 245 | 5362 | 269.38 | 89 | 87 | 19.6 |
| C | 15 | 208 | 2452 | 107.79 | 86 | 86 | 22.0 |
| C | 13 | 61 | 576 | 22.32 | 86 | 86 | 22.0 |
| C | 3 | 202 | 244 | 7.2 | 86 | 86 | 22.0 |
| D | 1 | 52 | 29314 | 1234.43 | 88 | 85 | 23.7 |
| D | 13 | 172 | 4479 | 185.57 | 88 | 85 | 23.7 |
| D | 10 | 253 | 3433 | 141.4 | 88 | 85 | 23.7 |
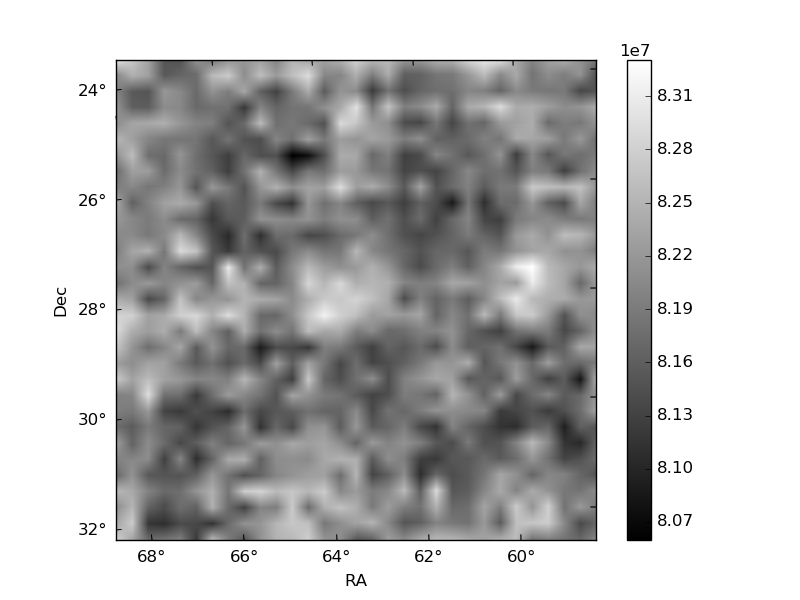
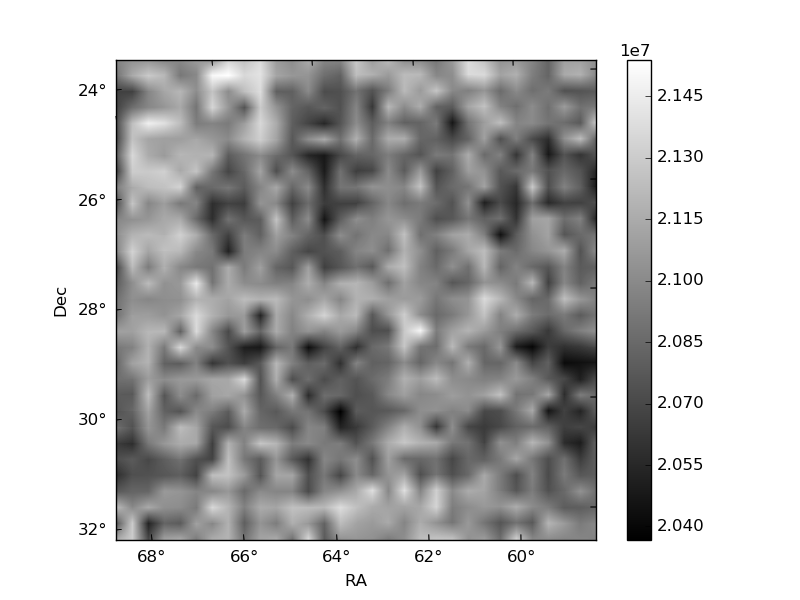
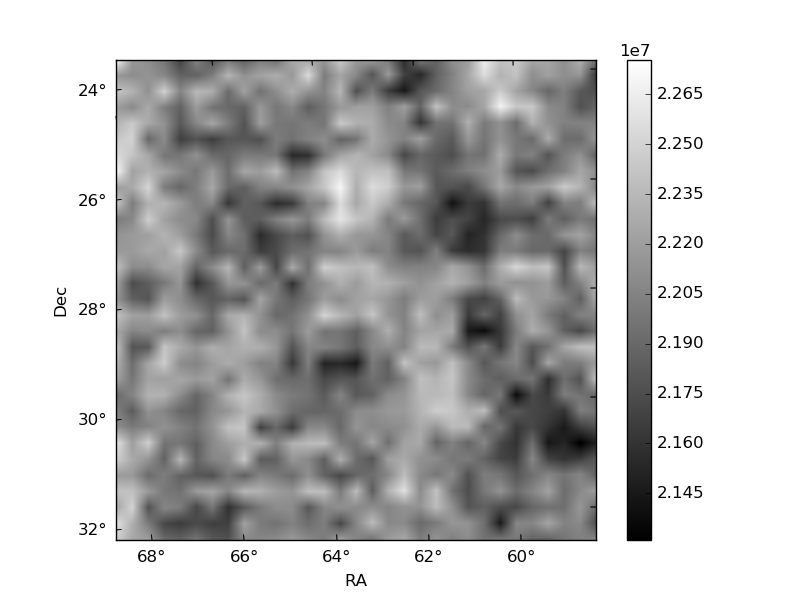
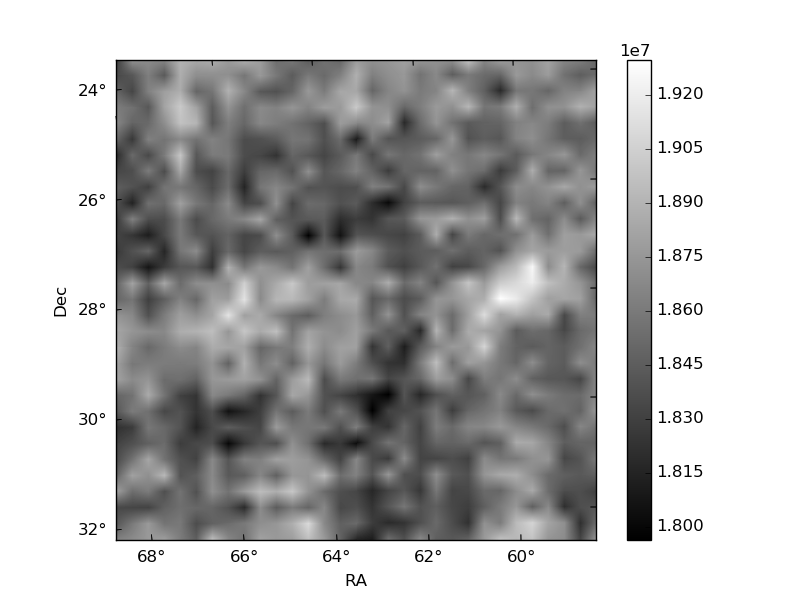
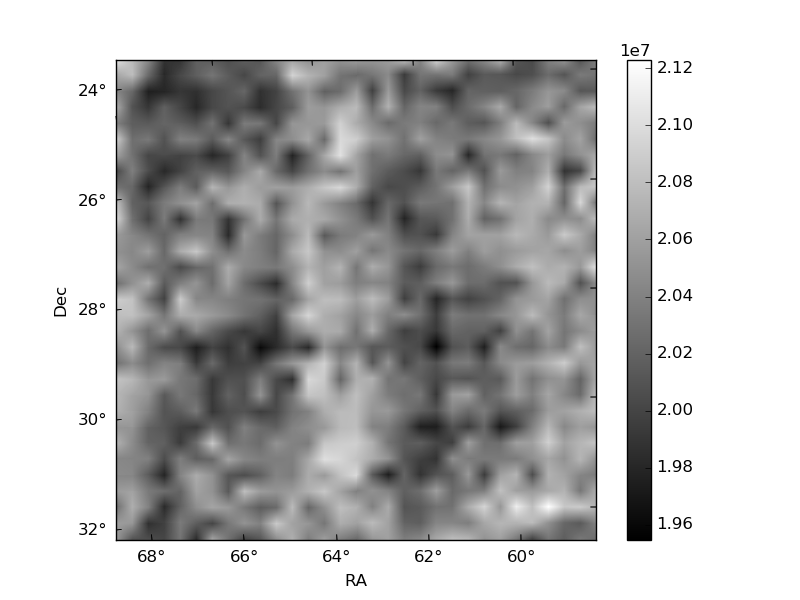
Histogram calculated using DETX and DETY for each event in the final _common_clean file
| Quadrant A | 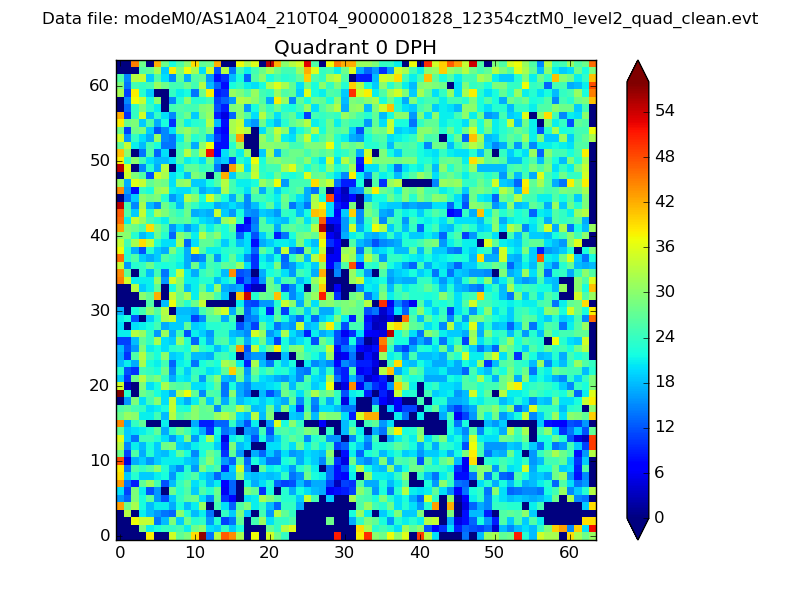 |
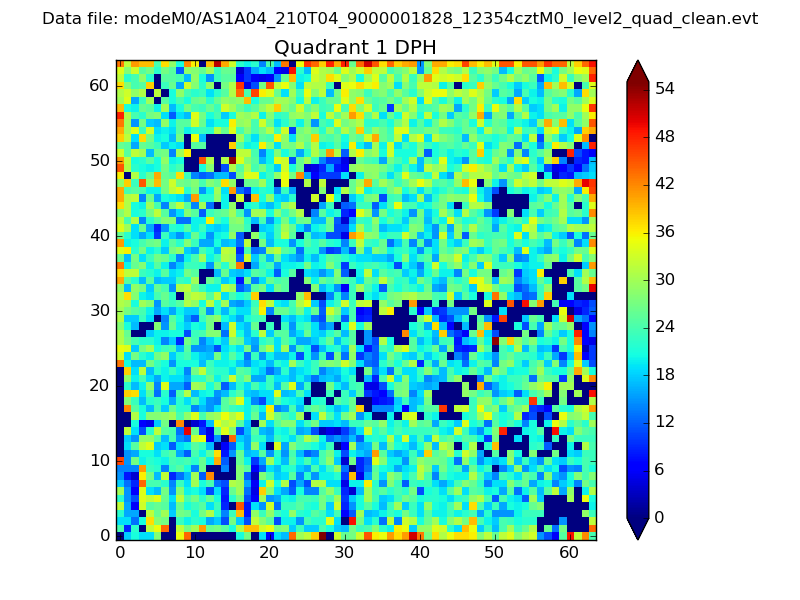 |
Quadrant B |
|---|---|---|---|
| Quadrant D | 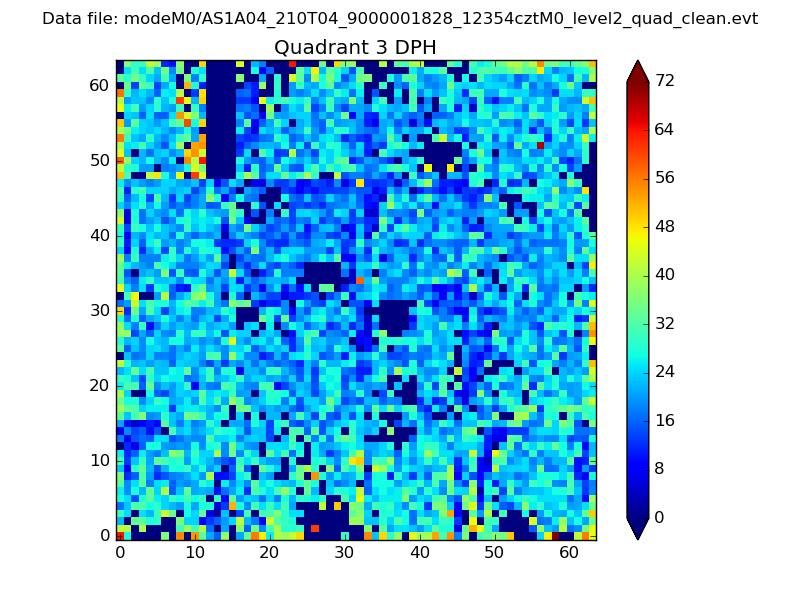 |
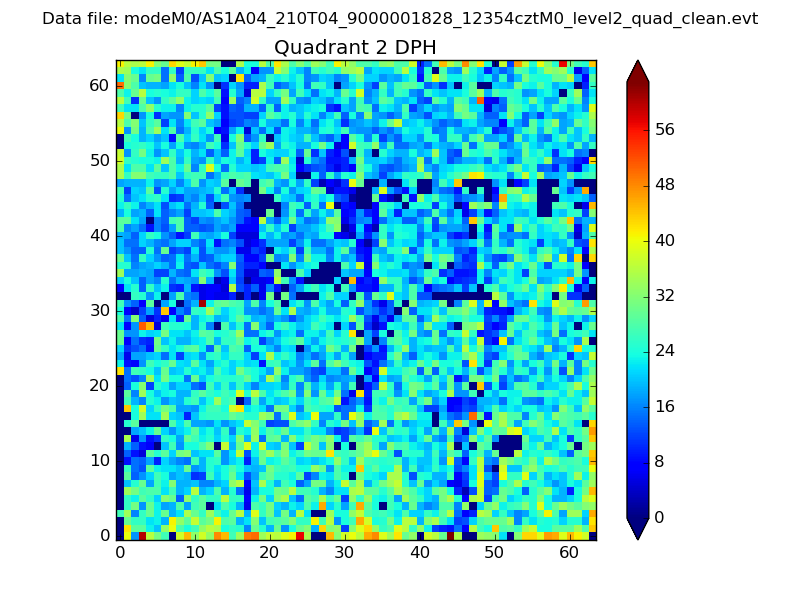 |
Quadrant C |
| Plot type | Count rate plots | Images |
|---|---|---|
| Comparison with Poisson distribution Blue bars denote a histogram of data divided into 1 sec bins. Red curve is a Poisson curve with rate = median count rate of data. |
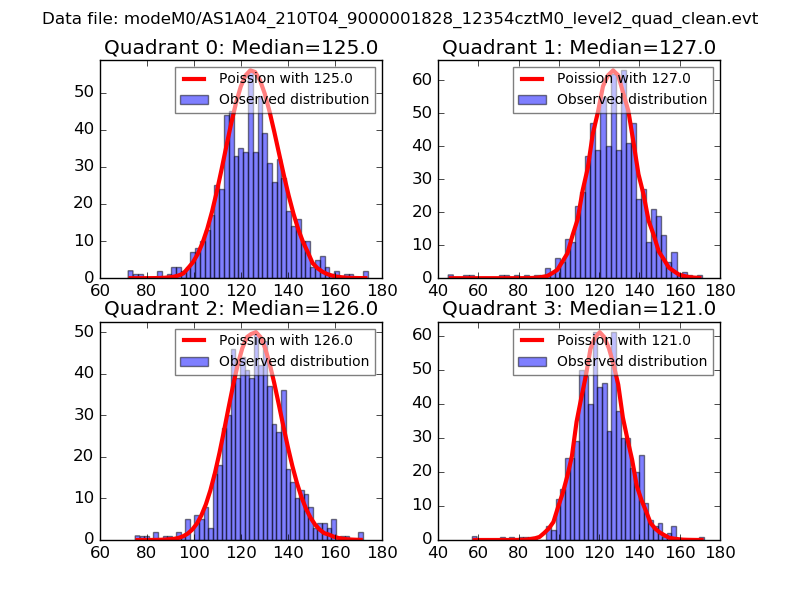 |
 |
| Quadrant-wise count rates Data is divided into 100 sec bins |
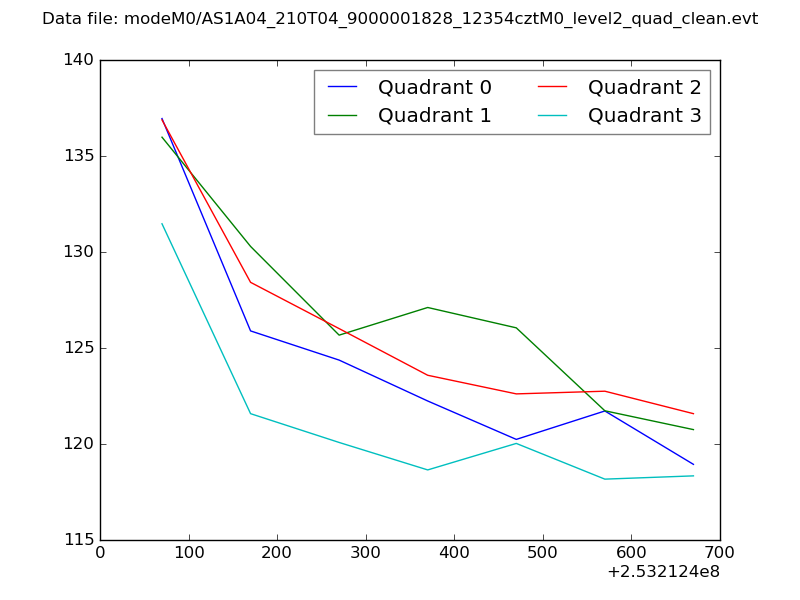 |
|
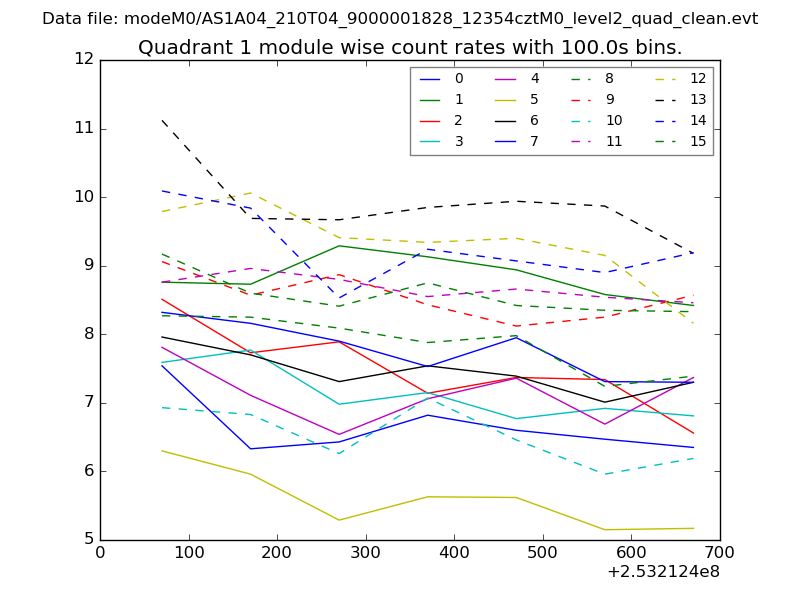
| Module-wise count rates for Quadrant A Data is divided into 100 sec bins |
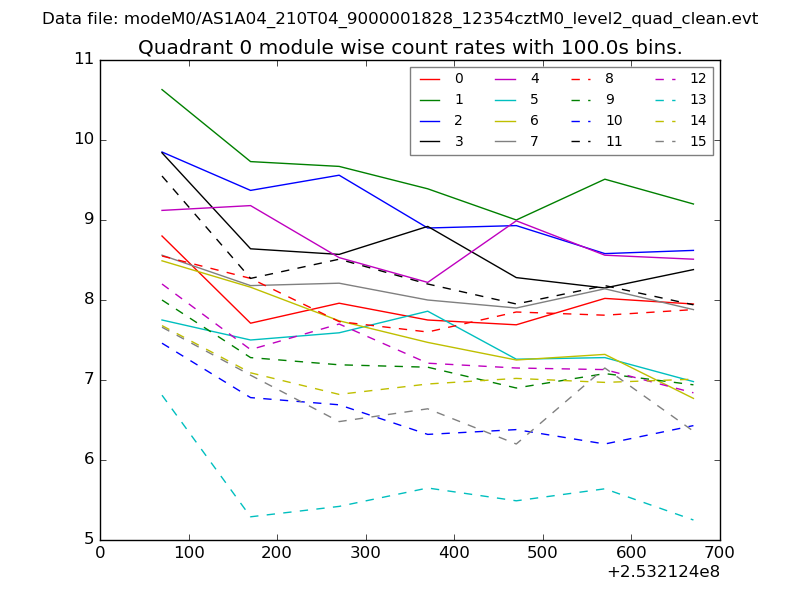 |
 |
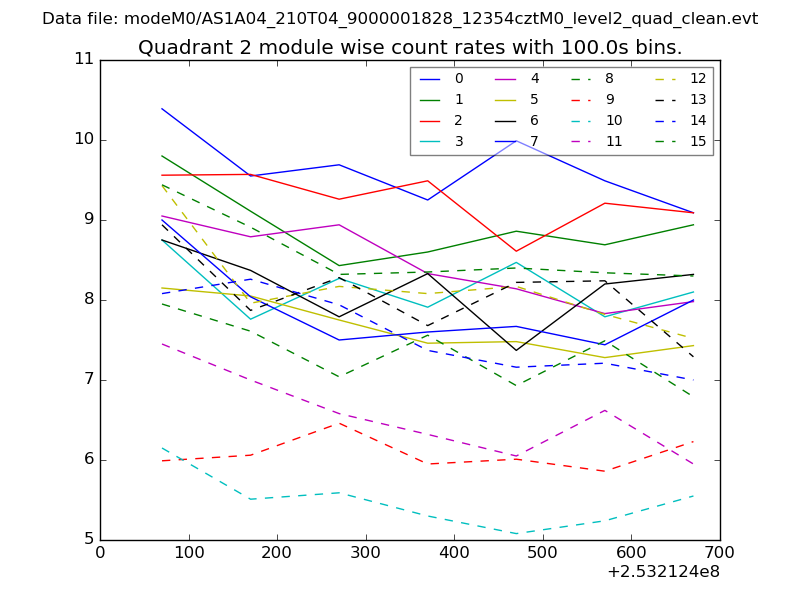
| Module-wise count rates for Quadrant B Data is divided into 100 sec bins |
 |
 |
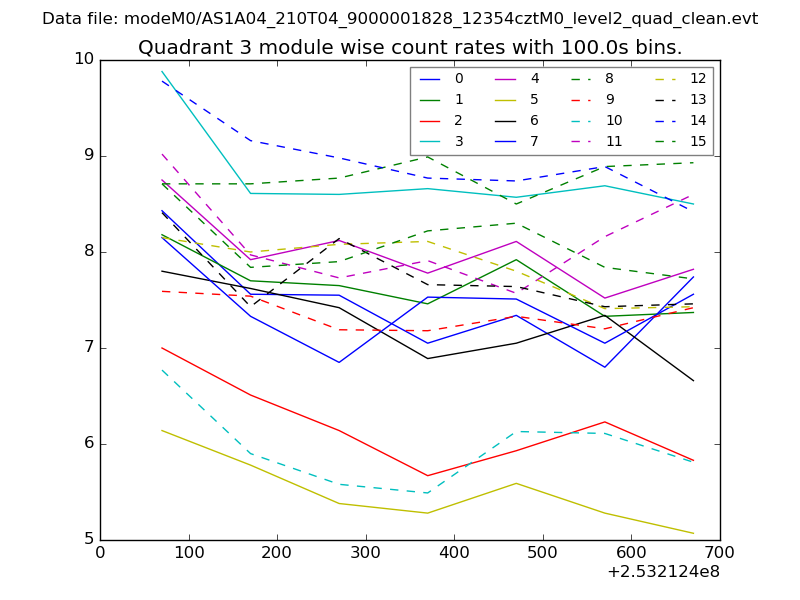
| Module-wise count rates for Quadrant C Data is divided into 100 sec bins |
 |
 |
| Module-wise count rates for Quadrant D Data is divided into 100 sec bins |
 |
 |
| Parameter | Plot |
|---|---|
| CZT HV Monitor | 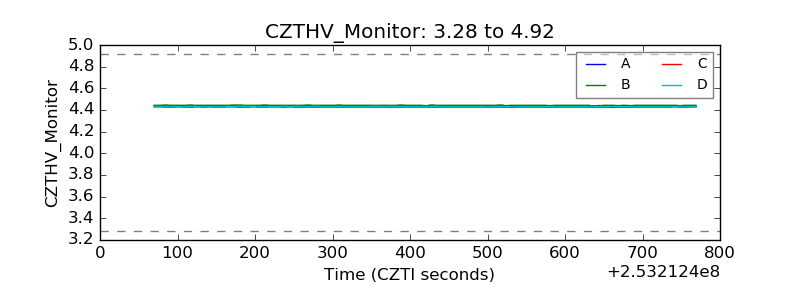 |
| D_VDD | 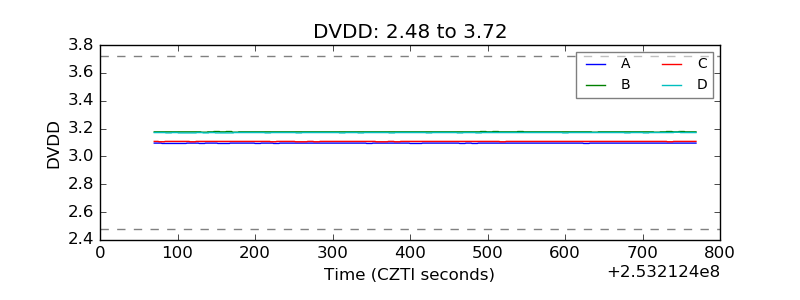 |
| Temperature 1 | 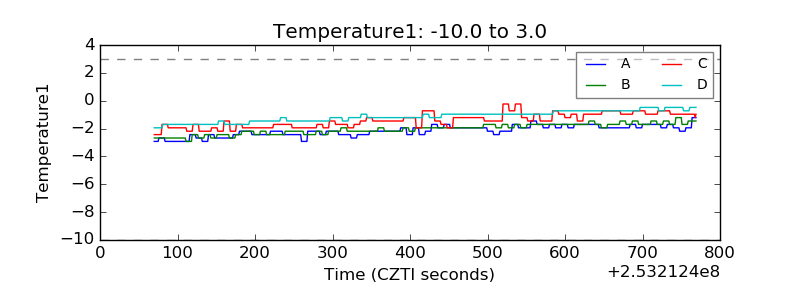 |
| Veto HV Monitor | 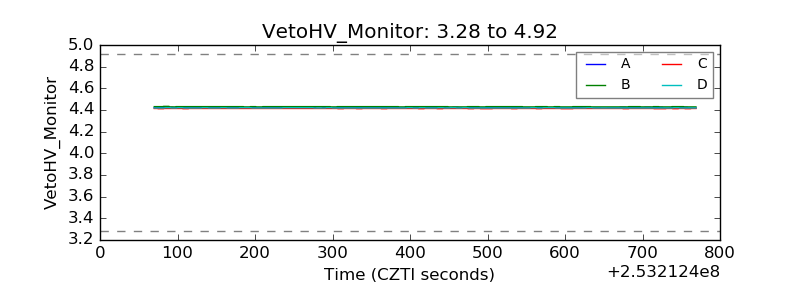 |
| Veto LLD | 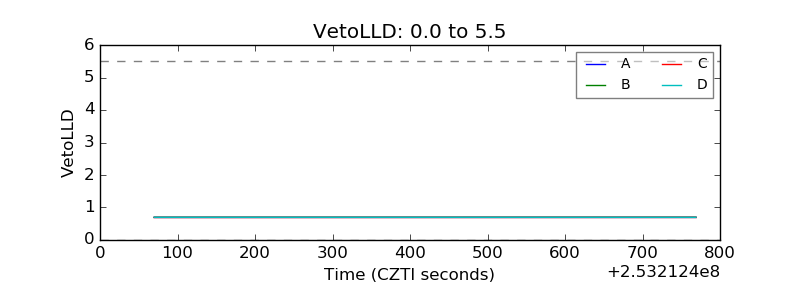 |
| Alpha Counter | 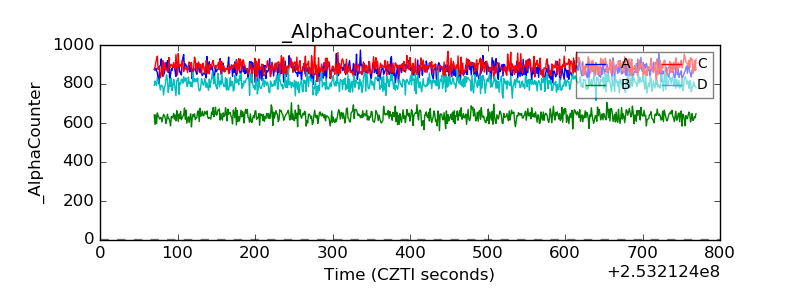 |
| _CPM_Rate | 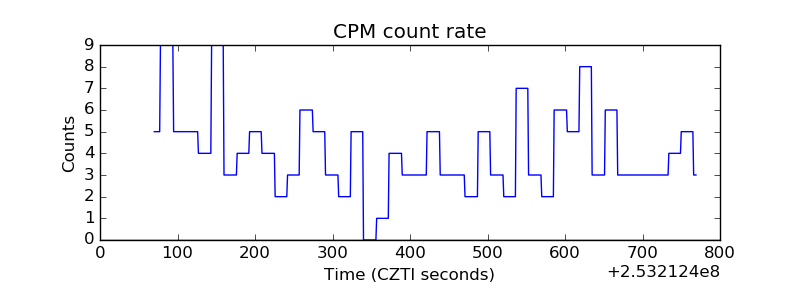 |
| CZT Counter | 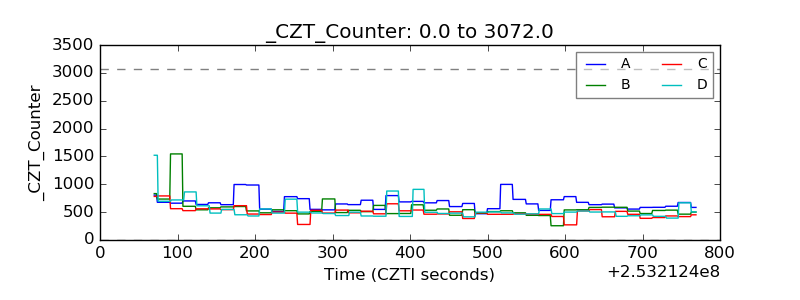 |
| +2.5 Volts monitor | 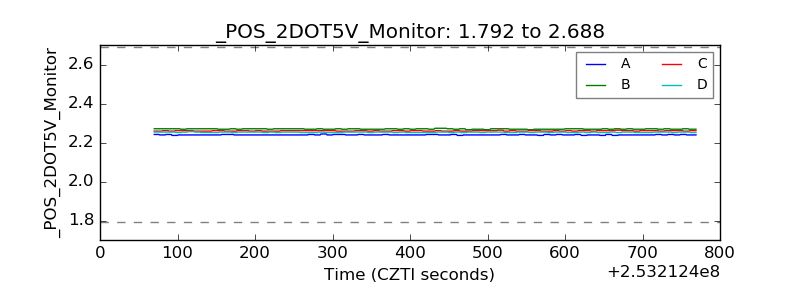 |
| +5 Volts monitor |  |
| _ROLL_ROT | 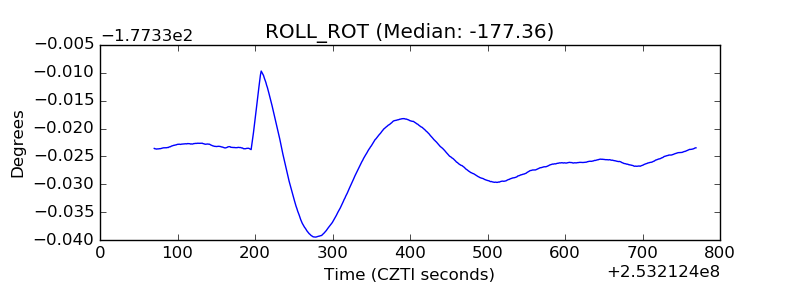 |
| _Roll_DEC | 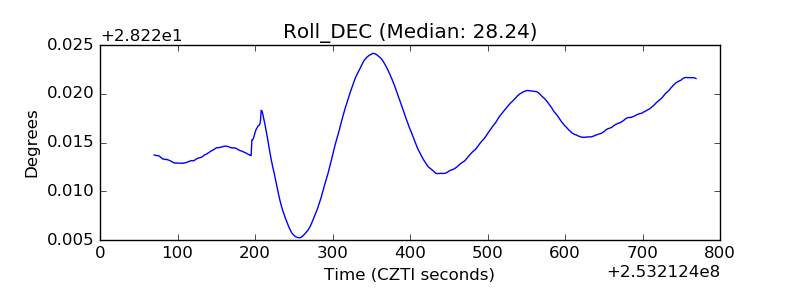 |
| _Roll_RA | 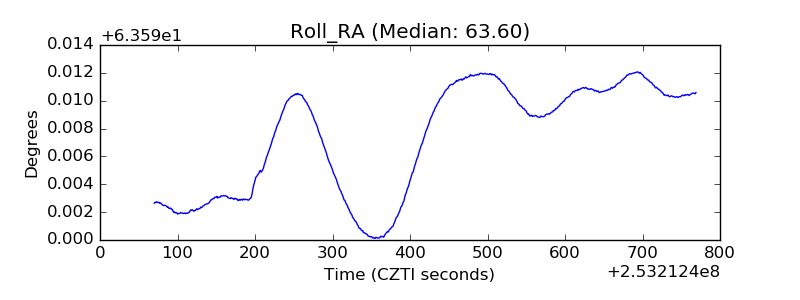 |
| Veto Counter | 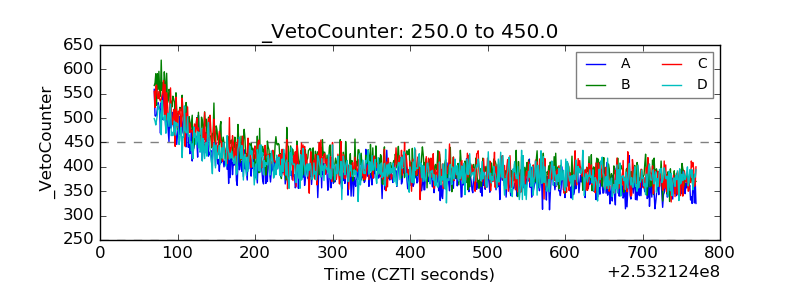 |