| Param | Original file | Final file |
|---|---|---|
| Filename | modeM0/AS1A04_130T04_9000001832_12359cztM0_level2.evt | modeM0/AS1A04_130T04_9000001832_12359cztM0_level2_quad_clean.evt |
| Size (bytes) | 327,461,760 | 51,189,120 |
| Size | 312.3 MB | 48.8 MB |
| Events in quadrant A | 2,858,267 | 314,164 |
| Events in quadrant B | 2,384,764 | 320,844 |
| Events in quadrant C | 2,018,843 | 314,557 |
| Events in quadrant D | 2,361,250 | 296,233 |
| Mode SS | |||
|---|---|---|---|
| Quadrant | BADHDUFLAG | Total packets | Discarded packets |
| A | 0 | 88 | 0 |
| B | 0 | 88 | 0 |
| C | 0 | 88 | 0 |
| D | 0 | 88 | 0 |
| Mode M0 | |||
|---|---|---|---|
| Quadrant | BADHDUFLAG | Total packets | Discarded packets |
| A | 0 | 11483 | 2 |
| B | 0 | 9752 | 1 |
| C | 0 | 8845 | 1 |
| D | 0 | 9884 | 1 |
| Mode M9 | |||
|---|---|---|---|
| Quadrant | BADHDUFLAG | Total packets | Discarded packets |
| A | 0 | 12 | 0 |
| B | 0 | 12 | 0 |
| C | 0 | 12 | 0 |
| D | 0 | 12 | 0 |
| Quadrant | Total seconds | Saturated seconds | Saturation percentage |
|---|---|---|---|
| A | 4318 | 61 | 1.412691% |
| B | 4318 | 72 | 1.667439% |
| C | 4318 | 15 | 0.347383% |
| D | 4318 | 61 | 1.412691% |
Noise dominated data is calculated using 1-second bins in cleaned event files. If a bin has >2000 counts, and if more than 50% of those come from <1% of pixels, then it is considered to be noise-dominated and hence unusable.
| Quadrant | # 1 sec bins | Bins with >0 counts | Bins with >2000 counts | High rate bins dominated by noise | Noise dominated (total time) | Noise dominated (detector-on time) | Marked lightcurve |
|---|---|---|---|---|---|---|---|
| A | 5549 | 4320 | 2 | 2 | 0.04% | 0.05% |  |
| B | 5549 | 4320 | 22 | 22 | 0.40% | 0.51% |  |
| C | 5549 | 4320 | 0 | 0 | 0.00% | 0.00% |  |
| D | 5549 | 4320 | 30 | 30 | 0.54% | 0.69% | 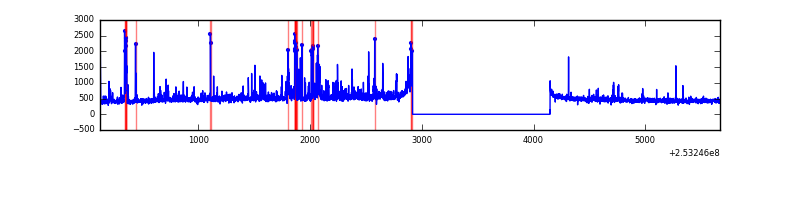 |
Top three noisy pixels from each quadrant. If the there are fewer than three noisy pixels in the level2.evt file, extra rows are filled as -1
| Pixel properties | Quadrant properties | ||||||
|---|---|---|---|---|---|---|---|
| Quadrant | DetID | PixID | Counts | Sigma | Mean | Median | Sigma |
| A | 13 | 251 | 275145 | 2497.42 | 533 | 522 | 110.0 |
| A | 1 | 162 | 165481 | 1500.13 | 533 | 522 | 110.0 |
| A | 1 | 178 | 92308 | 834.7 | 533 | 522 | 110.0 |
| B | 4 | 239 | 186296 | 1824.37 | 534 | 521 | 101.8 |
| B | 10 | 245 | 43905 | 426.05 | 534 | 521 | 101.8 |
| B | 0 | 197 | 28510 | 274.86 | 534 | 521 | 101.8 |
| C | 15 | 208 | 4603 | 34.26 | 515 | 518 | 119.3 |
| C | 14 | 225 | 4144 | 30.41 | 515 | 518 | 119.3 |
| C | 13 | 61 | 3633 | 26.12 | 515 | 518 | 119.3 |
| D | 1 | 52 | 318968 | 2602.6 | 510 | 496 | 122.4 |
| D | 13 | 249 | 60368 | 489.28 | 510 | 496 | 122.4 |
| D | 2 | 234 | 18184 | 144.55 | 510 | 496 | 122.4 |
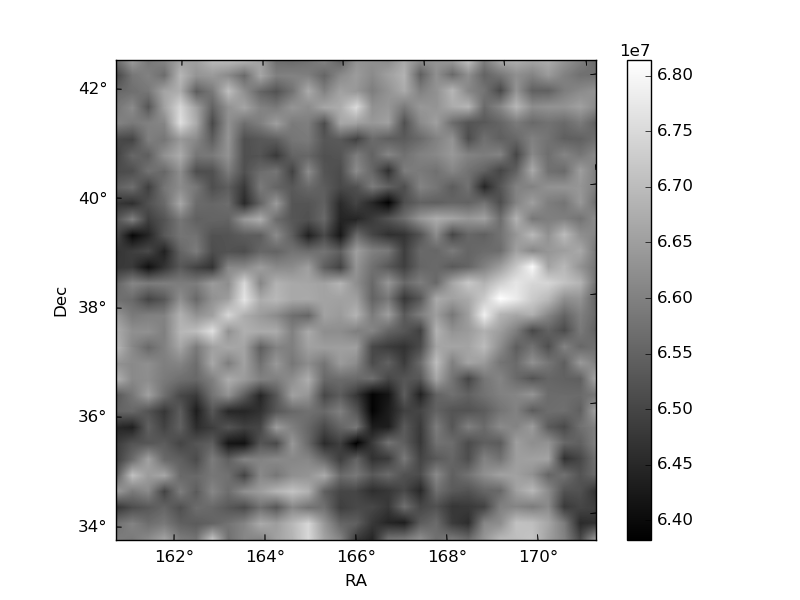
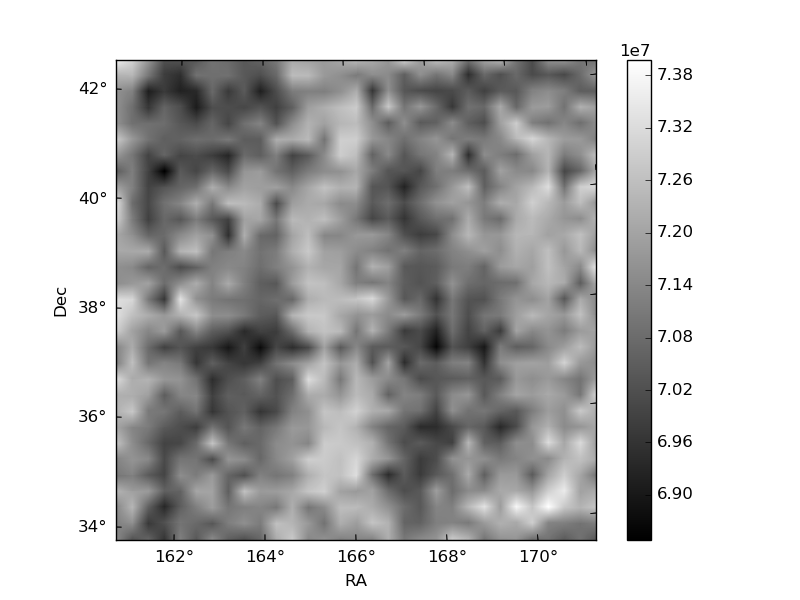
Histogram calculated using DETX and DETY for each event in the final _common_clean file
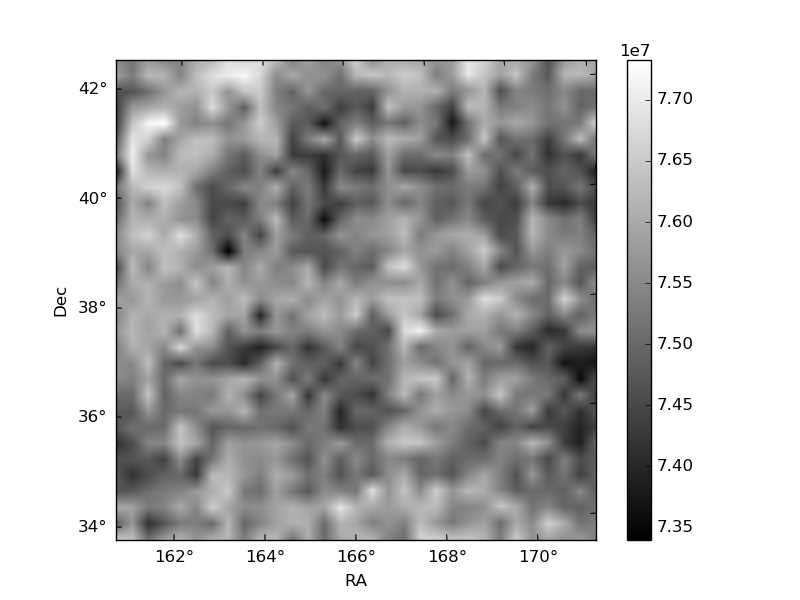
| Quadrant A | 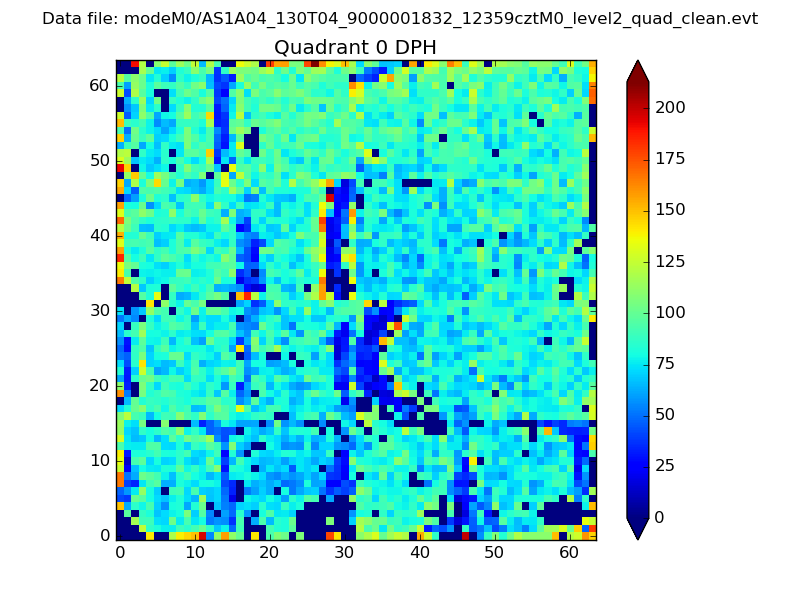 |
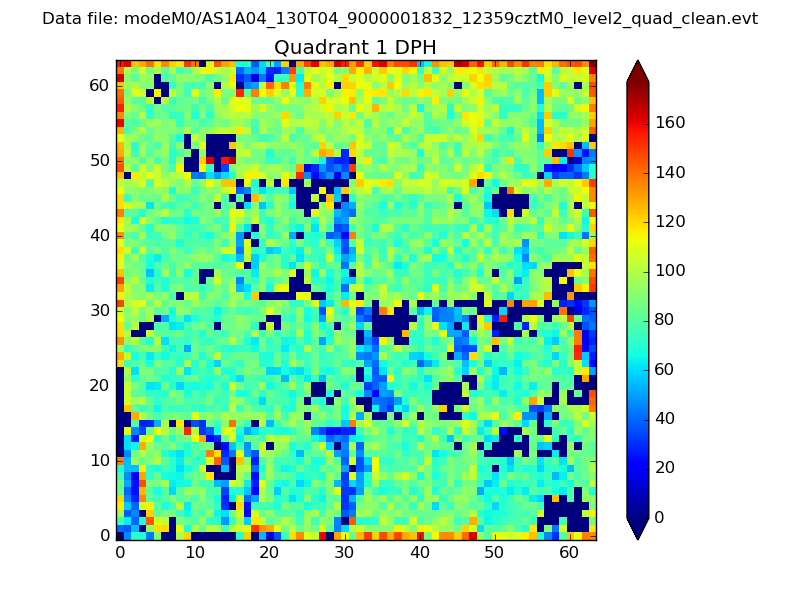 |
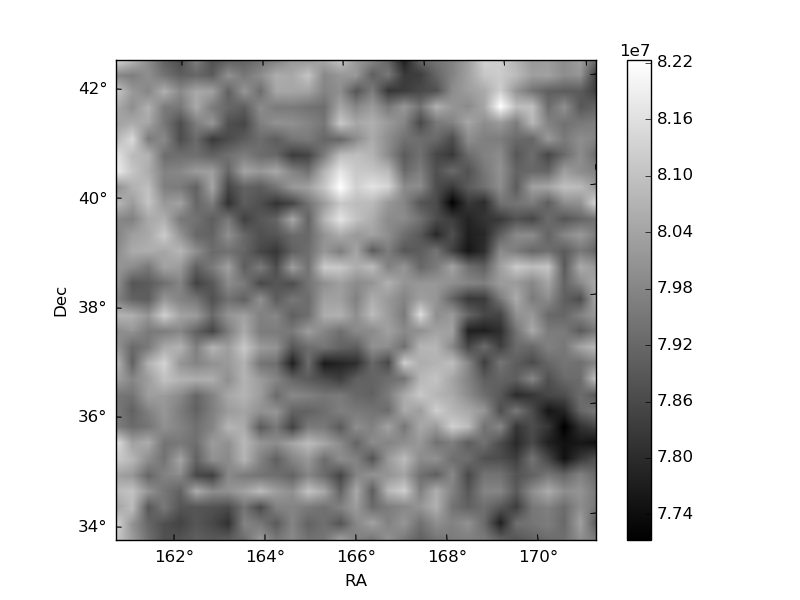
Quadrant B |
|---|---|---|---|
| Quadrant D | 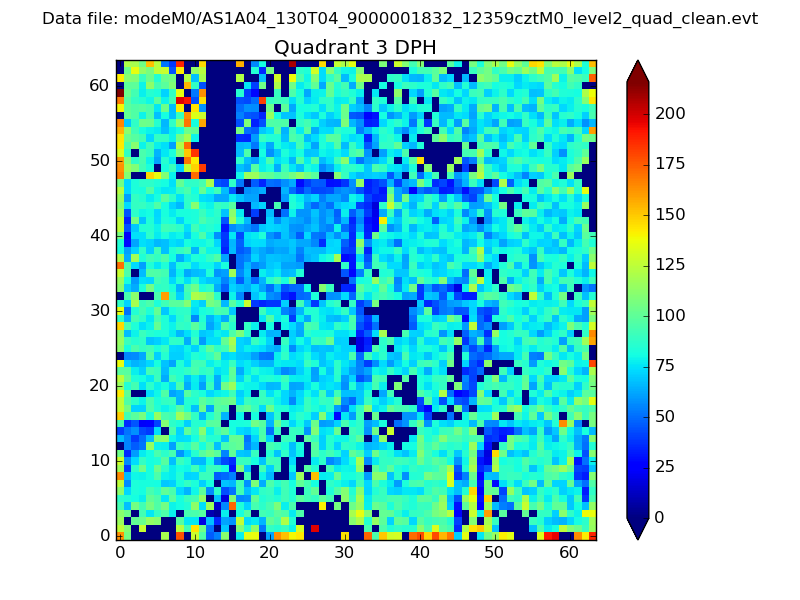 |
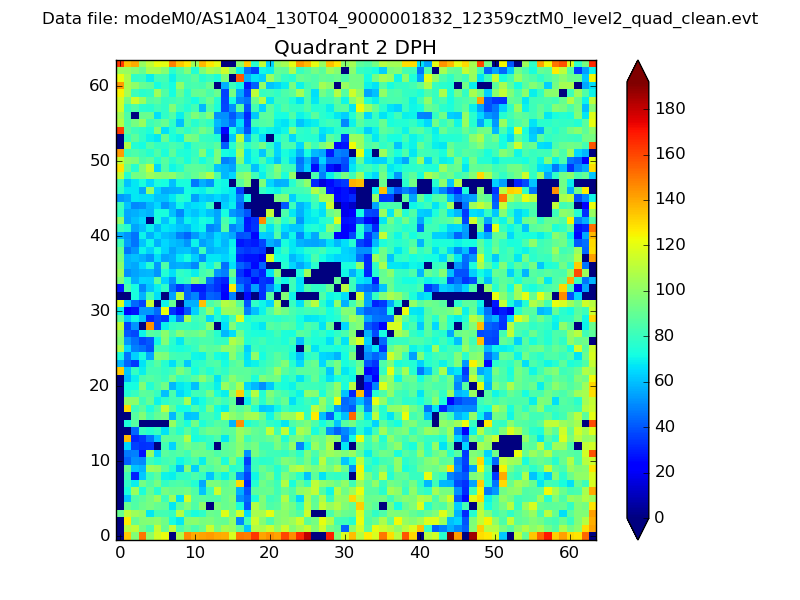 |
Quadrant C |
| Plot type | Count rate plots | Images |
|---|---|---|
| Comparison with Poisson distribution Blue bars denote a histogram of data divided into 1 sec bins. Red curve is a Poisson curve with rate = median count rate of data. |
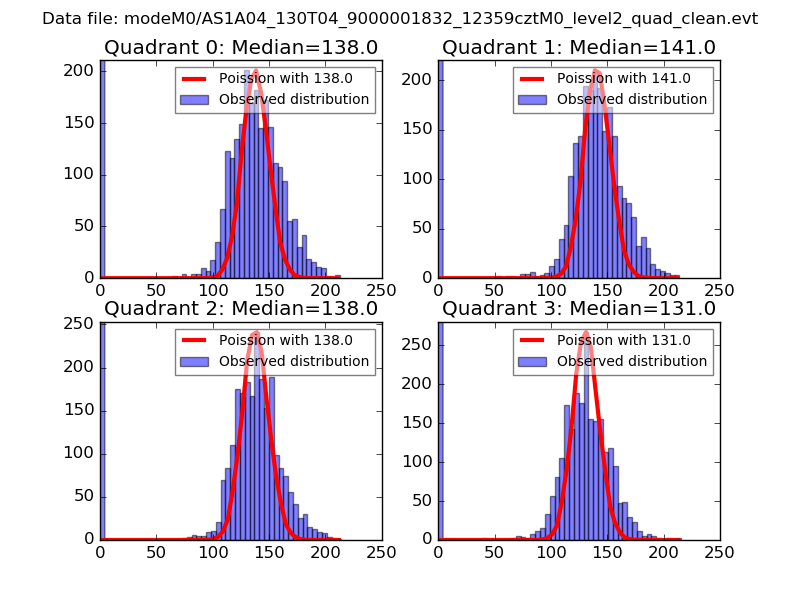 |
 |
| Quadrant-wise count rates Data is divided into 100 sec bins |
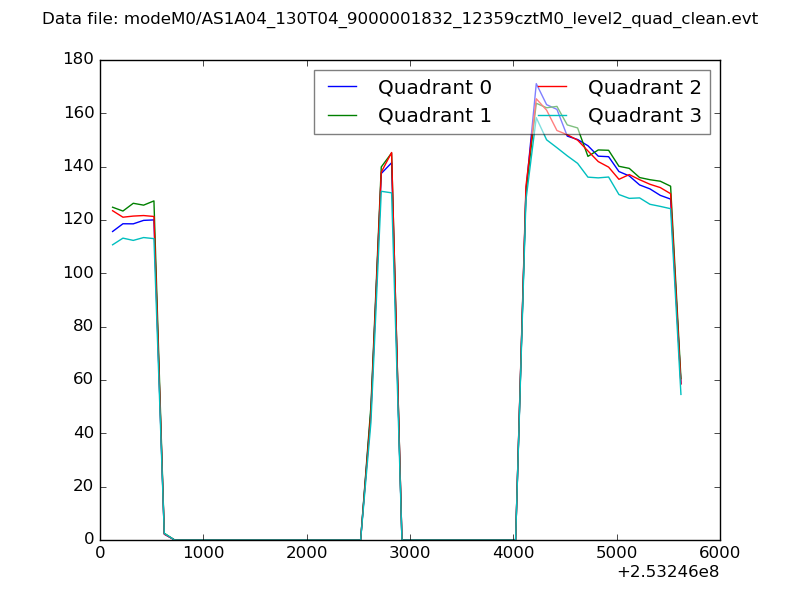 |
|
| Module-wise count rates for Quadrant A Data is divided into 100 sec bins |
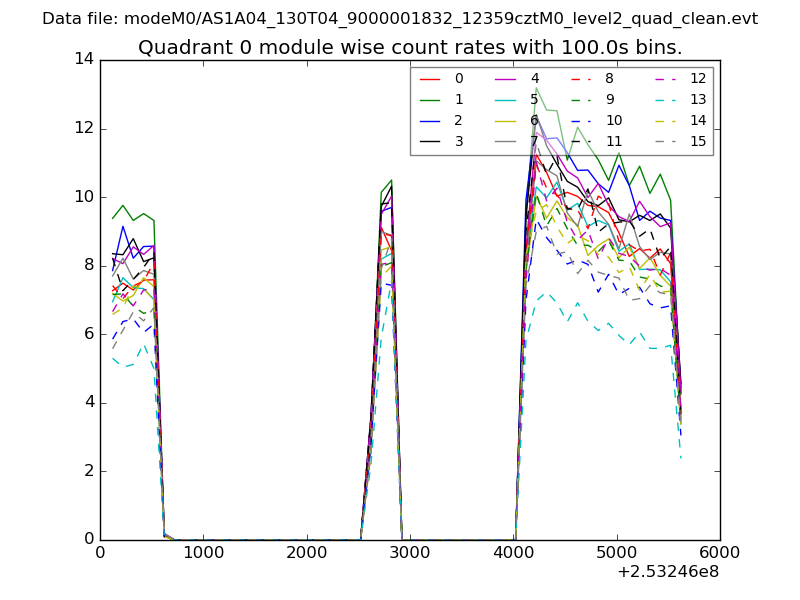 |
 |
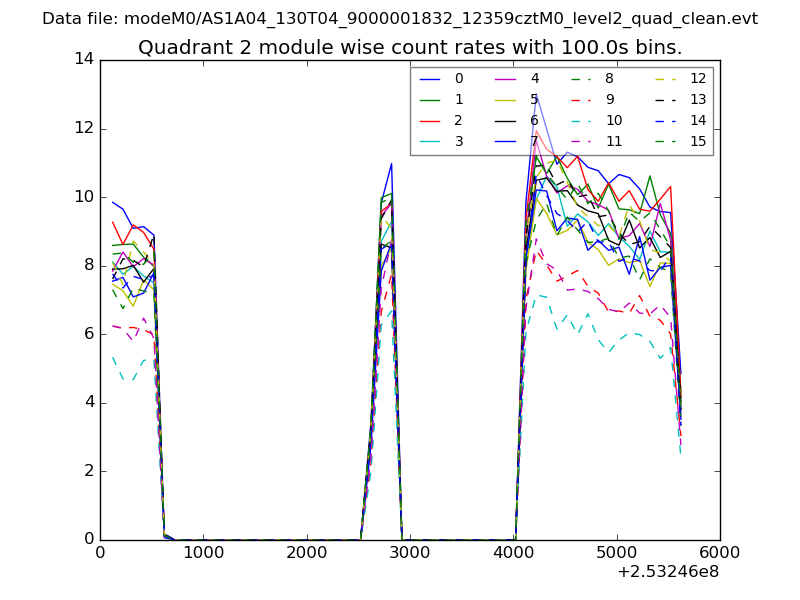
| Module-wise count rates for Quadrant B Data is divided into 100 sec bins |
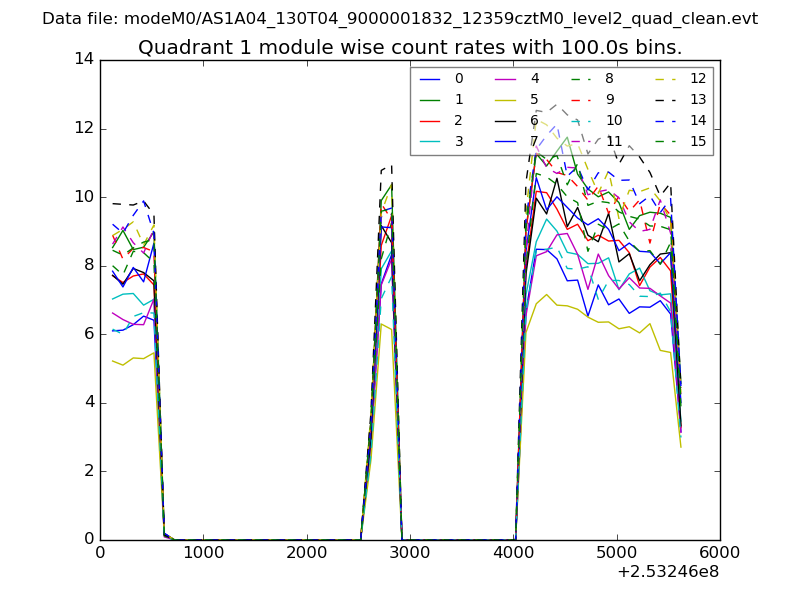 |
 |
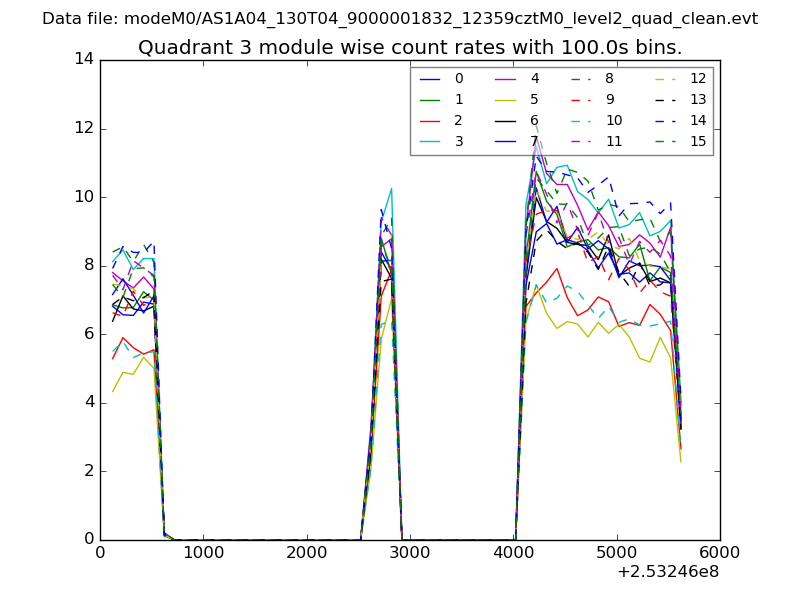
| Module-wise count rates for Quadrant C Data is divided into 100 sec bins |
 |
 |
| Module-wise count rates for Quadrant D Data is divided into 100 sec bins |
 |
 |
| Parameter | Plot |
|---|---|
| CZT HV Monitor | 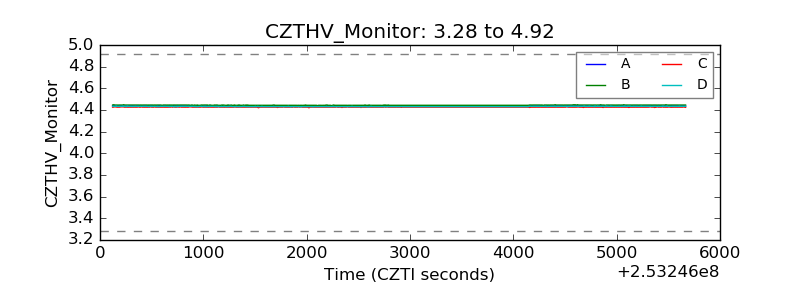 |
| D_VDD | 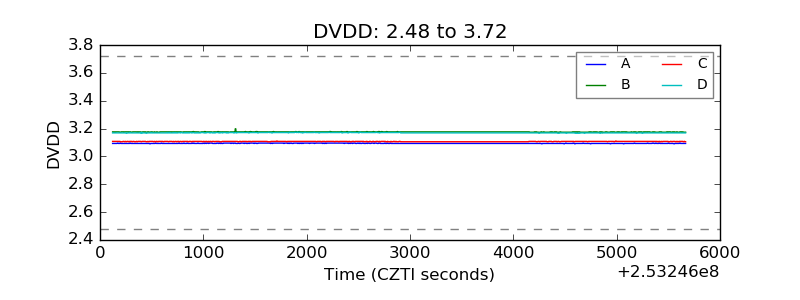 |
| Temperature 1 | 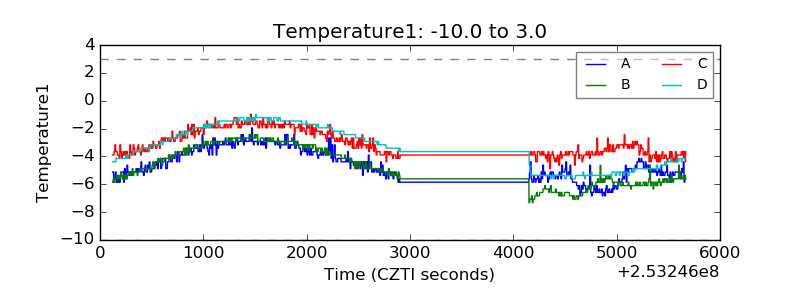 |
| Veto HV Monitor | 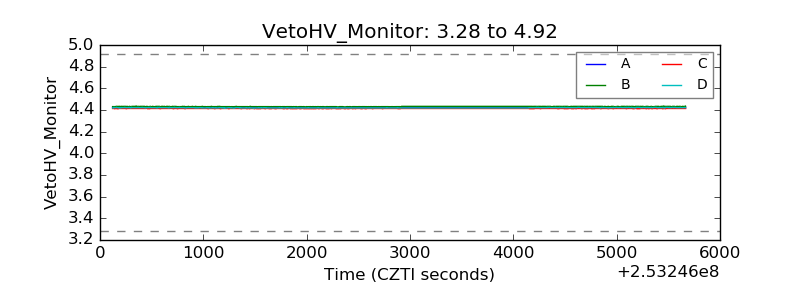 |
| Veto LLD | 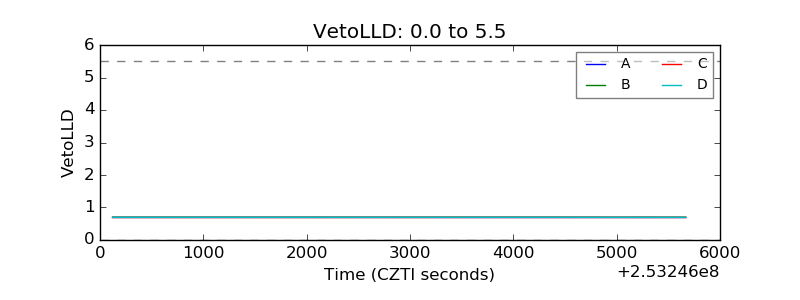 |
| Alpha Counter | 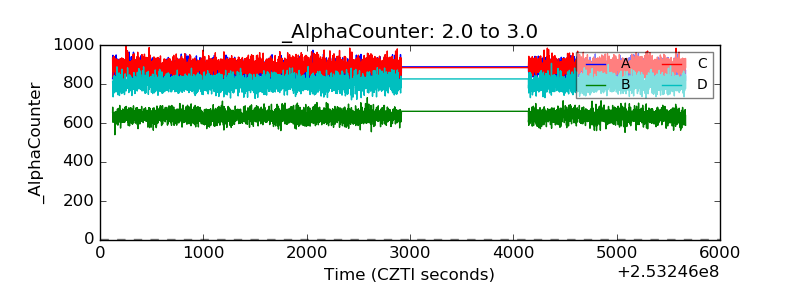 |
| _CPM_Rate | 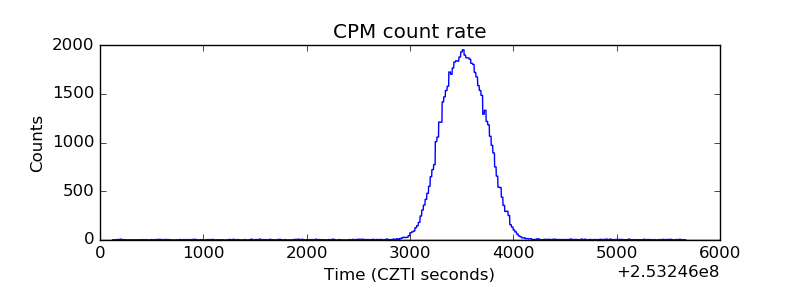 |
| CZT Counter | 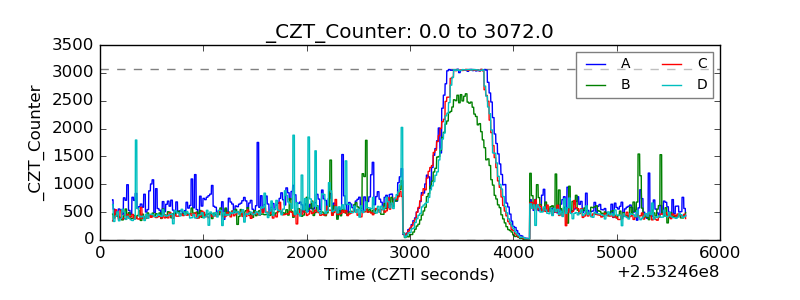 |
| +2.5 Volts monitor | 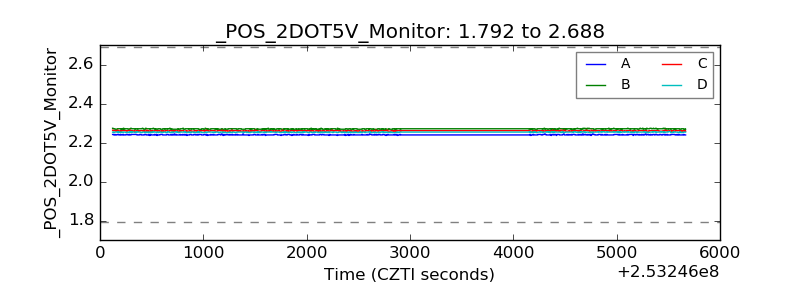 |
| +5 Volts monitor |  |
| _ROLL_ROT | 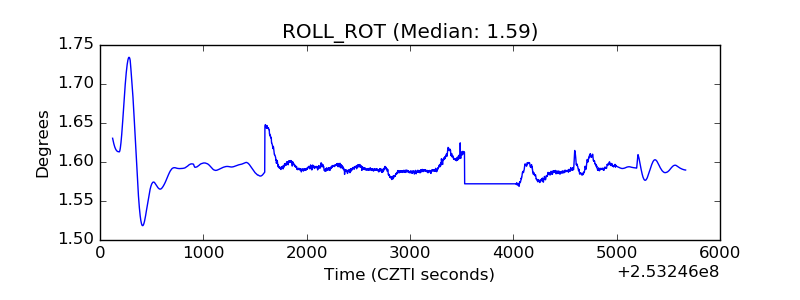 |
| _Roll_DEC | 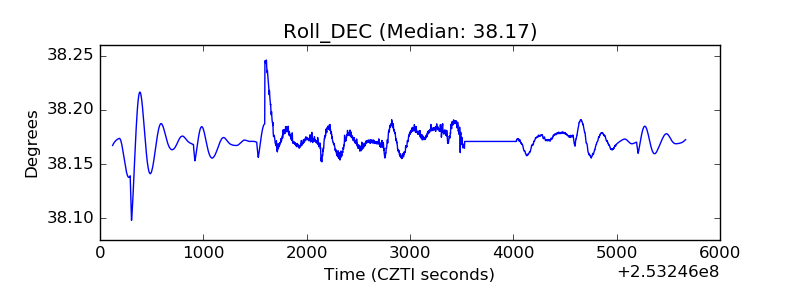 |
| _Roll_RA | 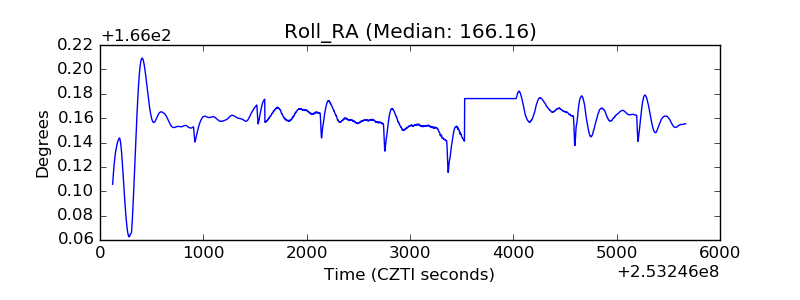 |
| Veto Counter | 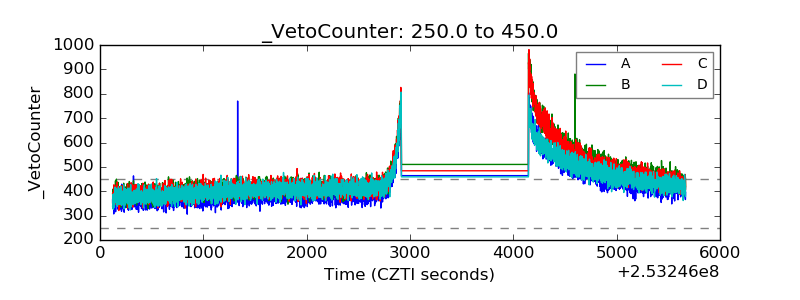 |