| Param | Original file | Final file |
|---|---|---|
| Filename | modeM0/AS1A04_130T04_9000001832_12362cztM0_level2.evt | modeM0/AS1A04_130T04_9000001832_12362cztM0_level2_quad_clean.evt |
| Size (bytes) | 797,146,560 | 128,450,880 |
| Size | 760.2 MB | 122.5 MB |
| Events in quadrant A | 7,225,308 | 798,015 |
| Events in quadrant B | 5,851,322 | 818,133 |
| Events in quadrant C | 4,893,904 | 802,335 |
| Events in quadrant D | 5,481,693 | 765,407 |
| Mode SS | |||
|---|---|---|---|
| Quadrant | BADHDUFLAG | Total packets | Discarded packets |
| A | 0 | 208 | 0 |
| B | 0 | 208 | 0 |
| C | 0 | 208 | 0 |
| D | 0 | 208 | 0 |
| Mode M0 | |||
|---|---|---|---|
| Quadrant | BADHDUFLAG | Total packets | Discarded packets |
| A | 0 | 28419 | 3 |
| B | 0 | 23612 | 2 |
| C | 0 | 21251 | 2 |
| D | 0 | 22857 | 2 |
| Mode M9 | |||
|---|---|---|---|
| Quadrant | BADHDUFLAG | Total packets | Discarded packets |
| A | 0 | 24 | 0 |
| B | 0 | 24 | 0 |
| C | 0 | 24 | 0 |
| D | 0 | 24 | 0 |
| Quadrant | Total seconds | Saturated seconds | Saturation percentage |
|---|---|---|---|
| A | 10191 | 357 | 3.503091% |
| B | 10191 | 338 | 3.316652% |
| C | 10191 | 117 | 1.148072% |
| D | 10191 | 189 | 1.854578% |
Noise dominated data is calculated using 1-second bins in cleaned event files. If a bin has >2000 counts, and if more than 50% of those come from <1% of pixels, then it is considered to be noise-dominated and hence unusable.
| Quadrant | # 1 sec bins | Bins with >0 counts | Bins with >2000 counts | High rate bins dominated by noise | Noise dominated (total time) | Noise dominated (detector-on time) | Marked lightcurve |
|---|---|---|---|---|---|---|---|
| A | 12602 | 10194 | 78 | 78 | 0.62% | 0.77% | 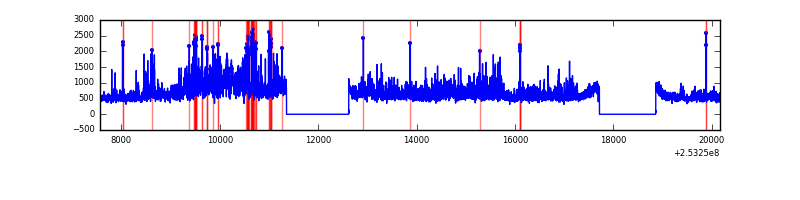 |
| B | 12602 | 10194 | 86 | 86 | 0.68% | 0.84% | 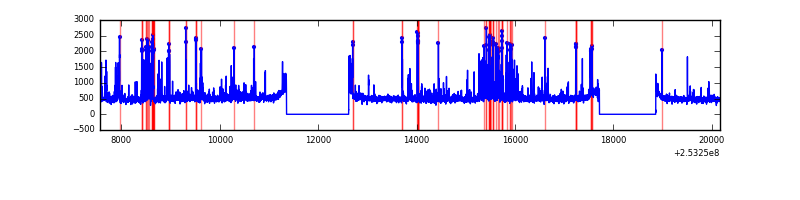 |
| C | 12602 | 10194 | 28 | 28 | 0.22% | 0.27% | 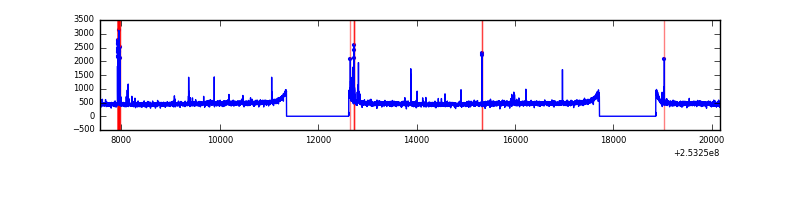 |
| D | 12602 | 10194 | 71 | 71 | 0.56% | 0.70% | 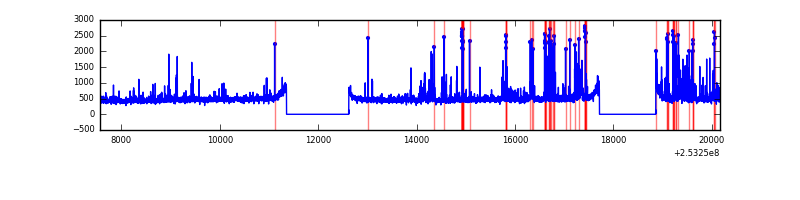 |
Top three noisy pixels from each quadrant. If the there are fewer than three noisy pixels in the level2.evt file, extra rows are filled as -1
| Pixel properties | Quadrant properties | ||||||
|---|---|---|---|---|---|---|---|
| Quadrant | DetID | PixID | Counts | Sigma | Mean | Median | Sigma |
| A | 8 | 15 | 968347 | 3768.95 | 1264 | 1239 | 256.6 |
| A | 13 | 251 | 571382 | 2221.92 | 1264 | 1239 | 256.6 |
| A | 1 | 162 | 337980 | 1312.32 | 1264 | 1239 | 256.6 |
| B | 4 | 239 | 653180 | 2772.47 | 1254 | 1225 | 235.2 |
| B | 10 | 245 | 106244 | 446.6 | 1254 | 1225 | 235.2 |
| B | 0 | 219 | 43911 | 181.52 | 1254 | 1225 | 235.2 |
| C | 14 | 234 | 76860 | 271.89 | 1217 | 1222 | 278.2 |
| C | 15 | 208 | 69655 | 245.99 | 1217 | 1222 | 278.2 |
| C | 13 | 61 | 8939 | 27.74 | 1217 | 1222 | 278.2 |
| D | 1 | 52 | 501592 | 1734.79 | 1222 | 1187 | 288.5 |
| D | 13 | 104 | 89473 | 306.07 | 1222 | 1187 | 288.5 |
| D | 9 | 85 | 66340 | 225.87 | 1222 | 1187 | 288.5 |
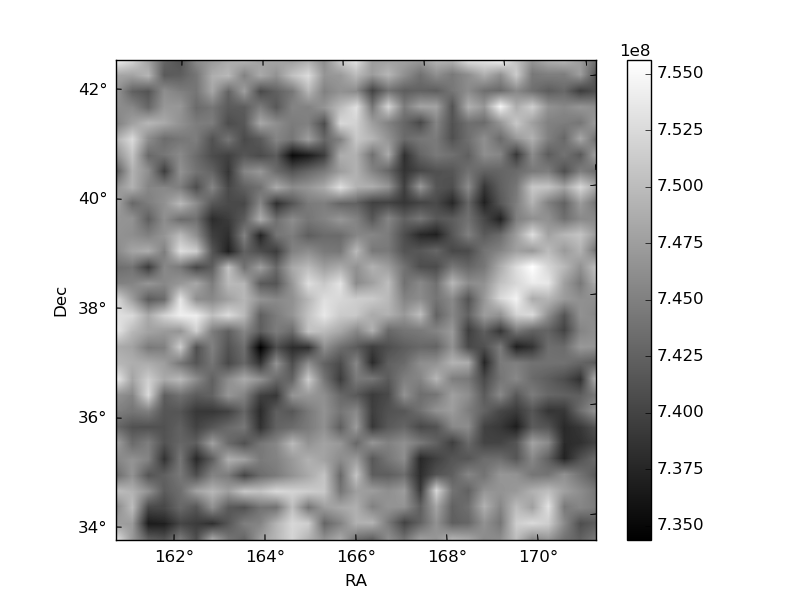
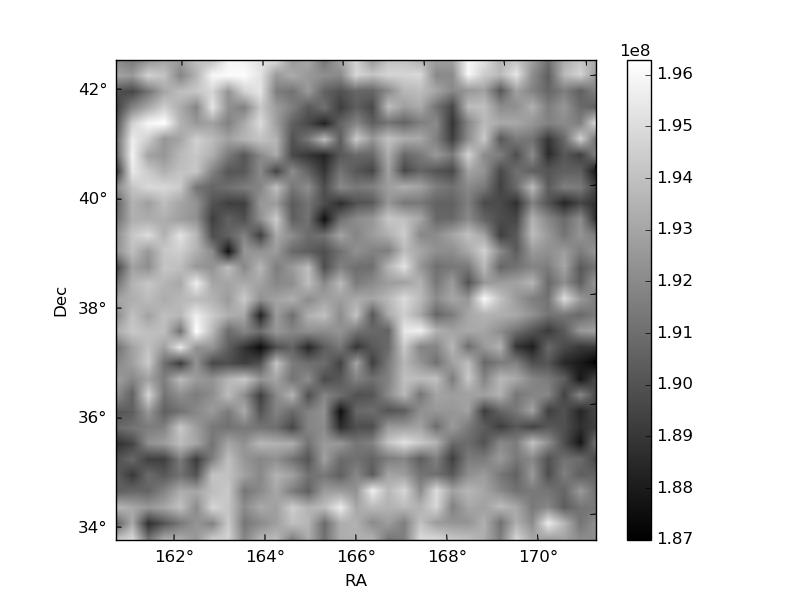
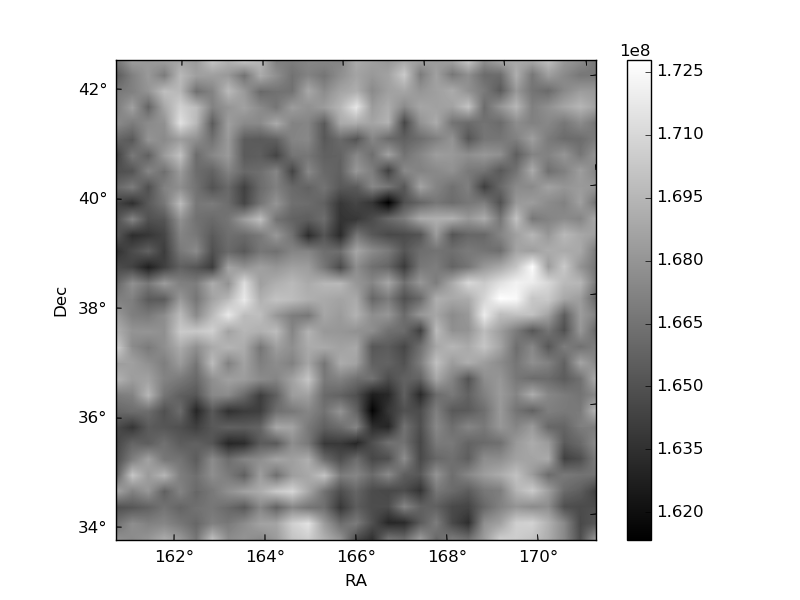
Histogram calculated using DETX and DETY for each event in the final _common_clean file
| Quadrant A | 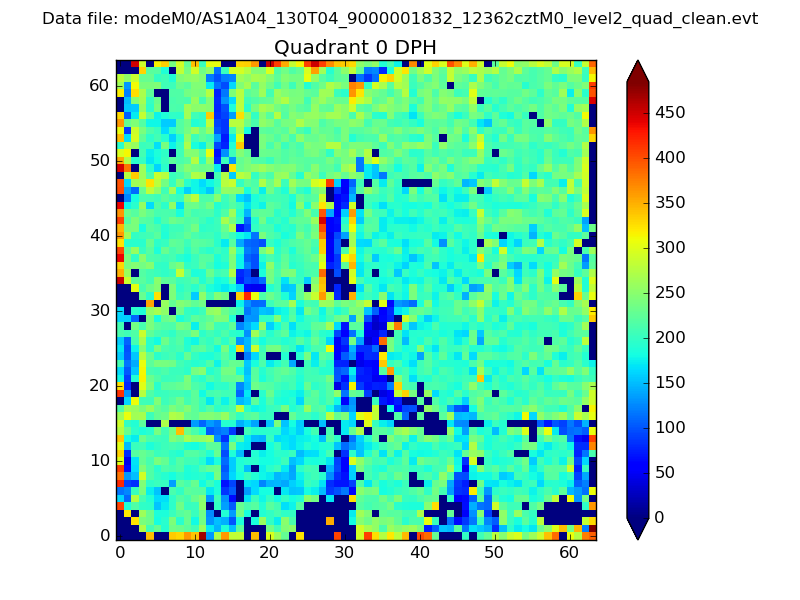 |
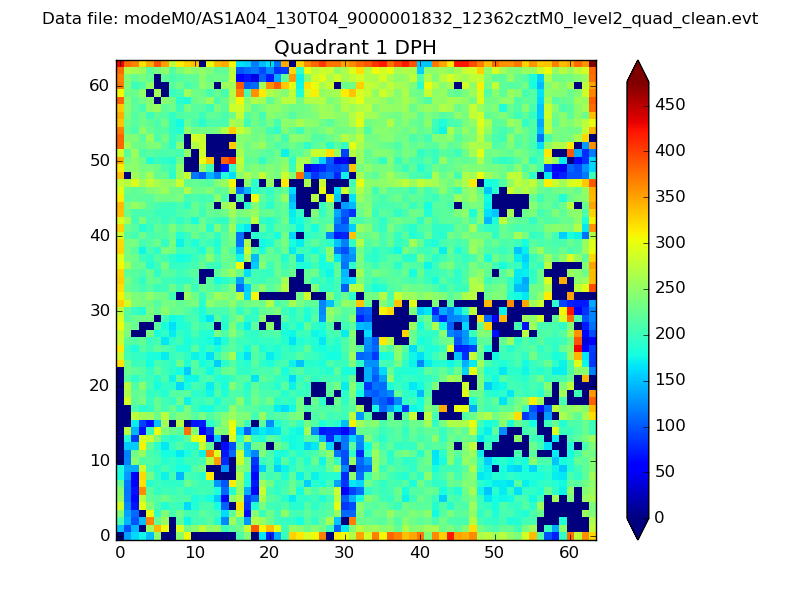 |
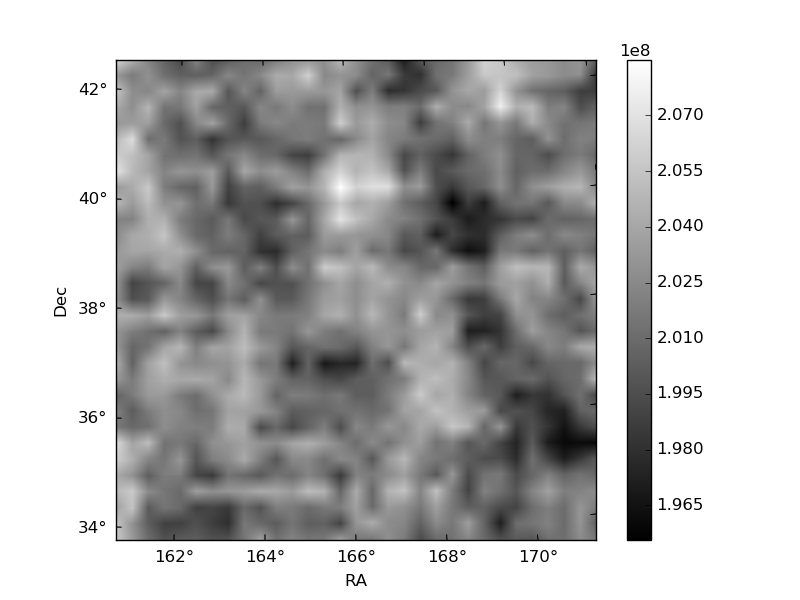
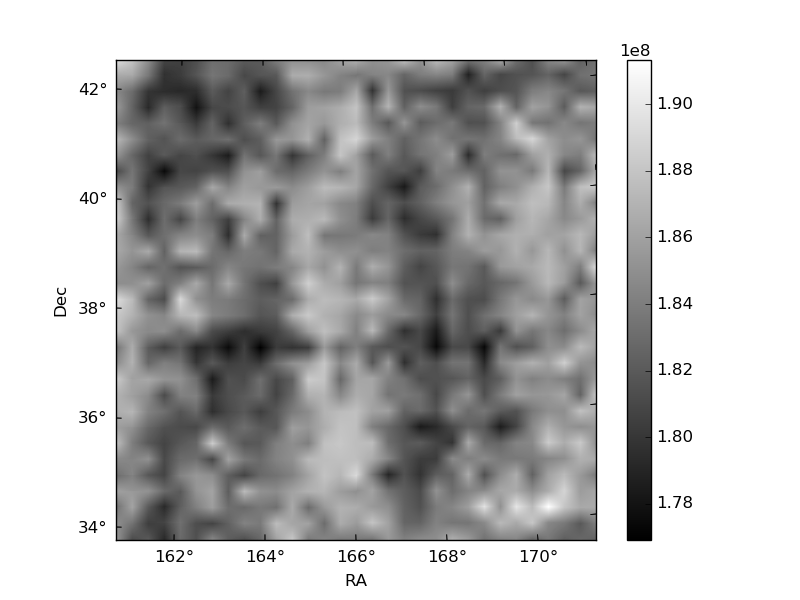
Quadrant B |
|---|---|---|---|
| Quadrant D | 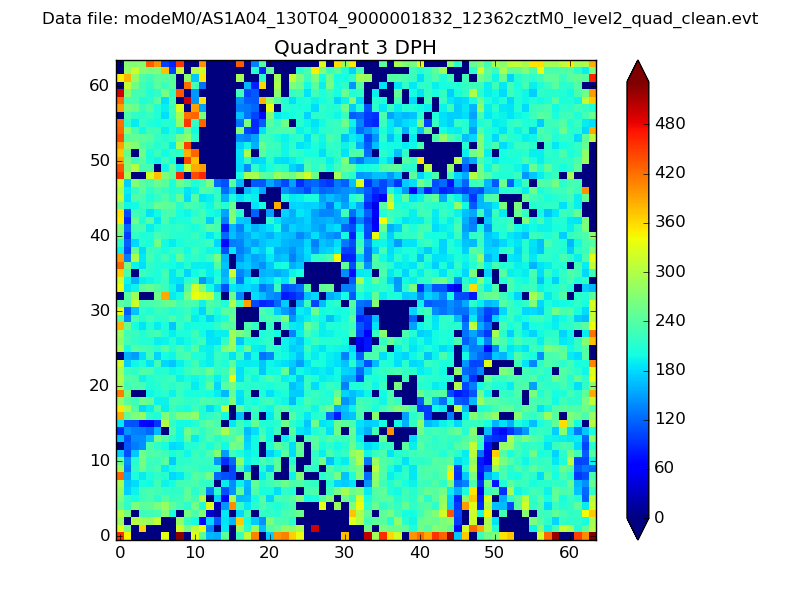 |
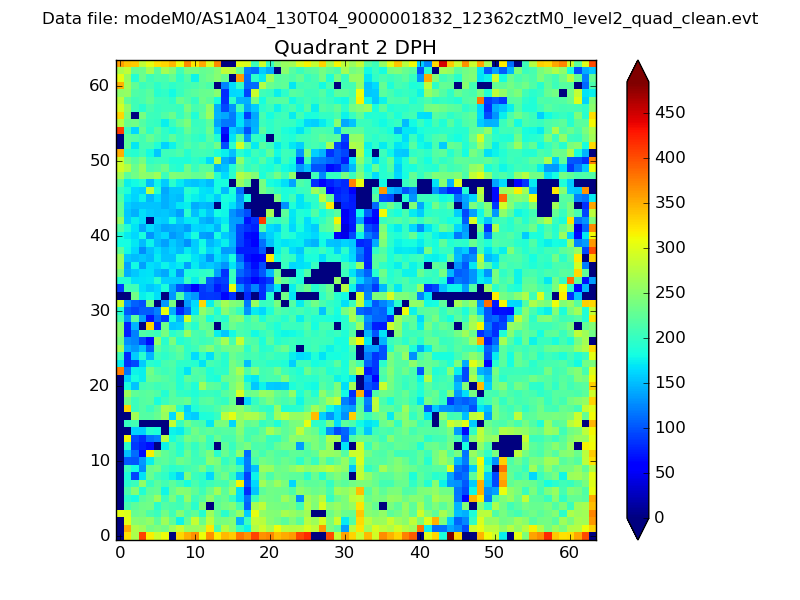 |
Quadrant C |
| Plot type | Count rate plots | Images |
|---|---|---|
| Comparison with Poisson distribution Blue bars denote a histogram of data divided into 1 sec bins. Red curve is a Poisson curve with rate = median count rate of data. |
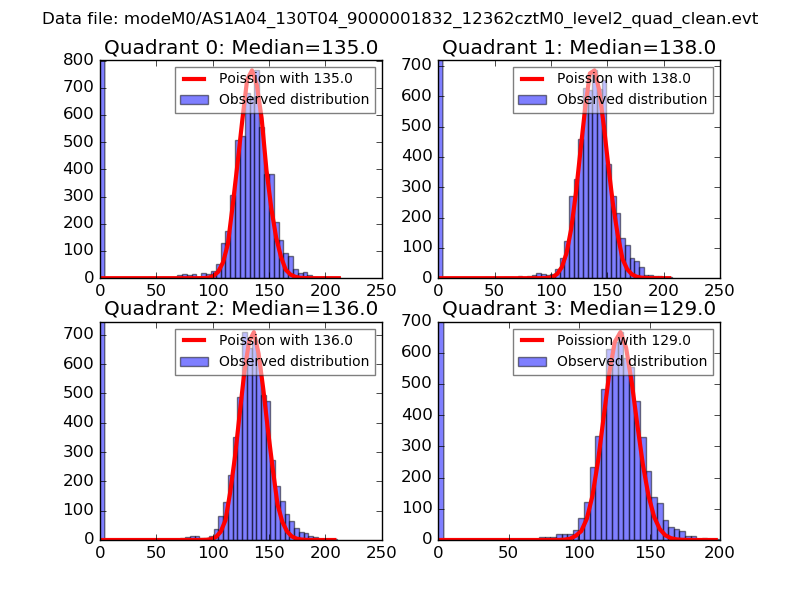 |
 |
| Quadrant-wise count rates Data is divided into 100 sec bins |
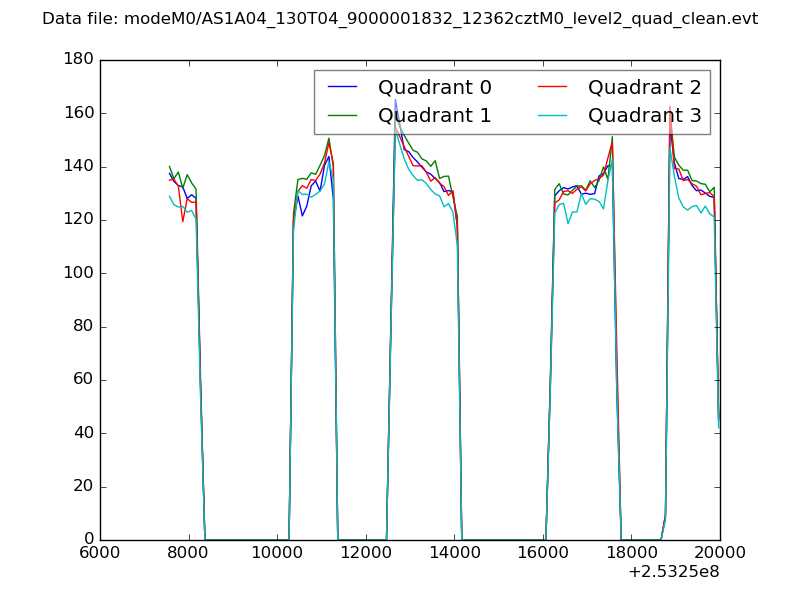 |
|
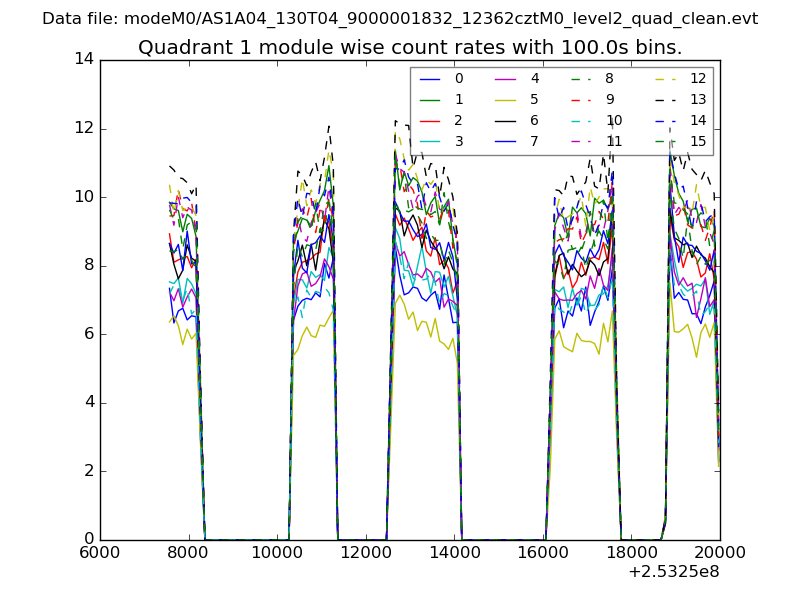
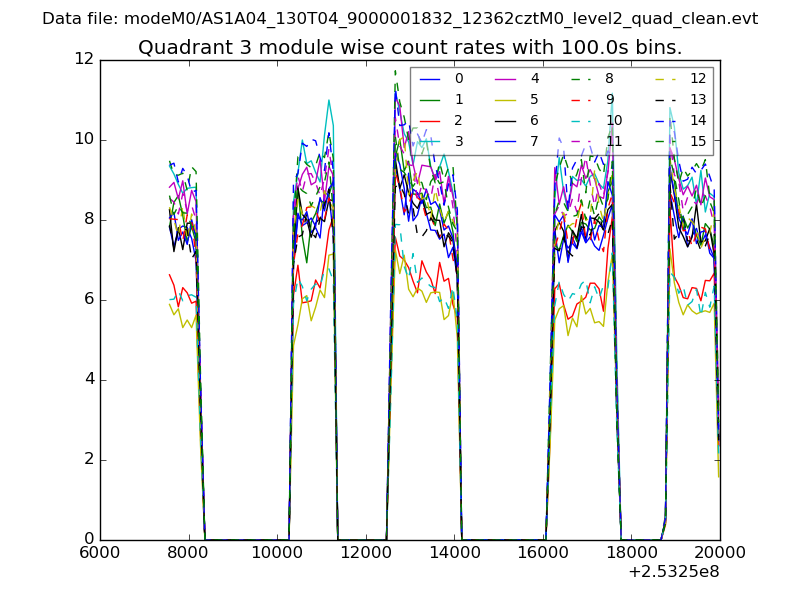
| Module-wise count rates for Quadrant A Data is divided into 100 sec bins |
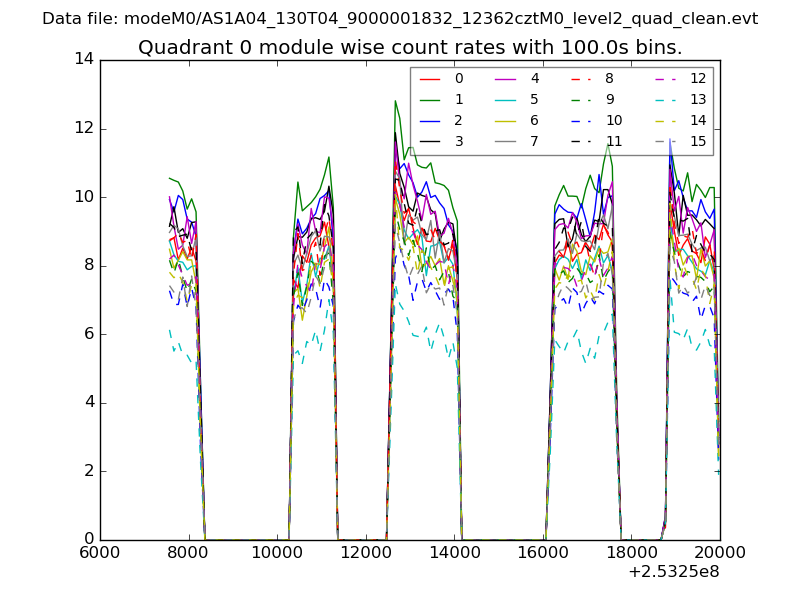 |
 |
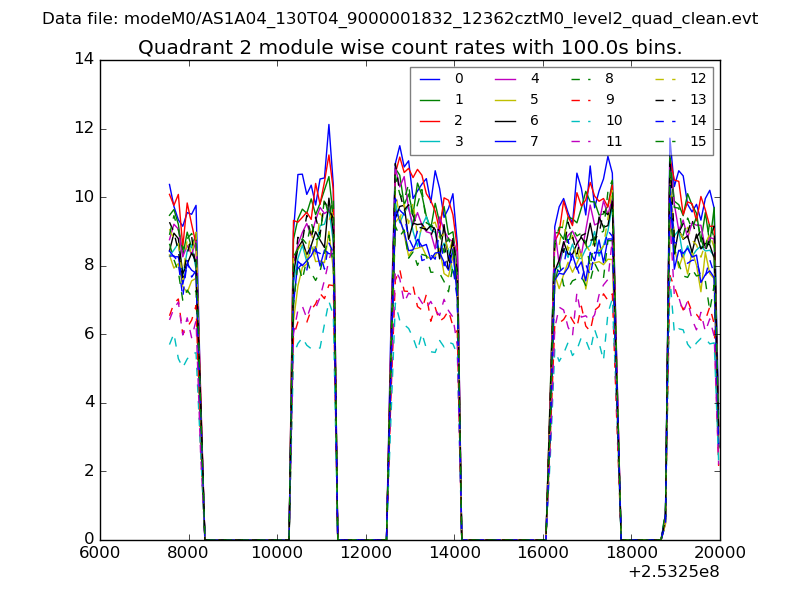
| Module-wise count rates for Quadrant B Data is divided into 100 sec bins |
 |
 |
| Module-wise count rates for Quadrant C Data is divided into 100 sec bins |
 |
 |
| Module-wise count rates for Quadrant D Data is divided into 100 sec bins |
 |
 |
| Parameter | Plot |
|---|---|
| CZT HV Monitor | 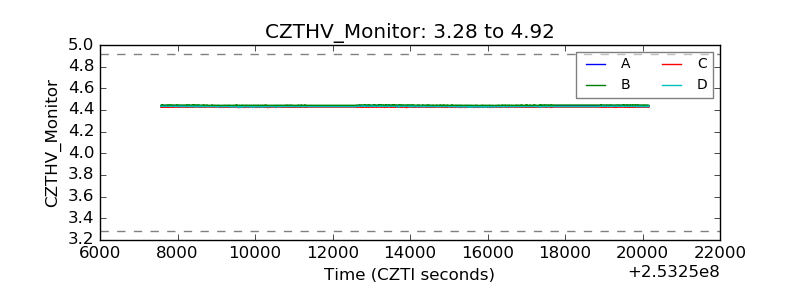 |
| D_VDD | 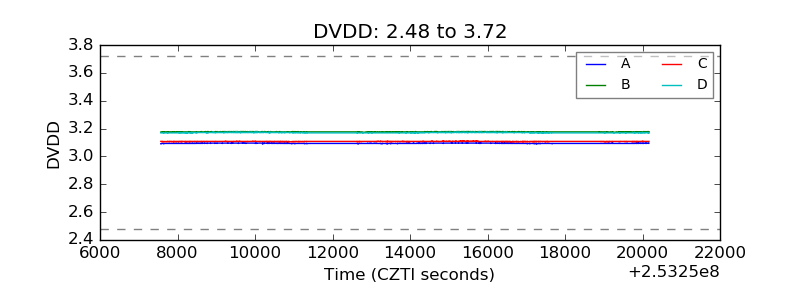 |
| Temperature 1 | 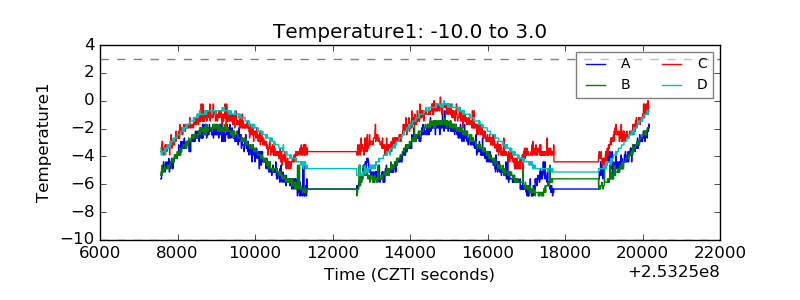 |
| Veto HV Monitor |  |
| Veto LLD | 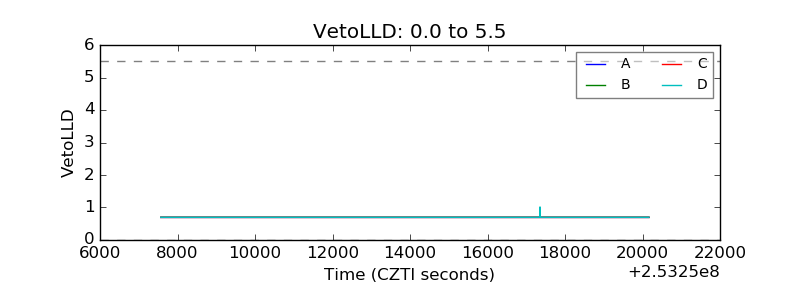 |
| Alpha Counter | 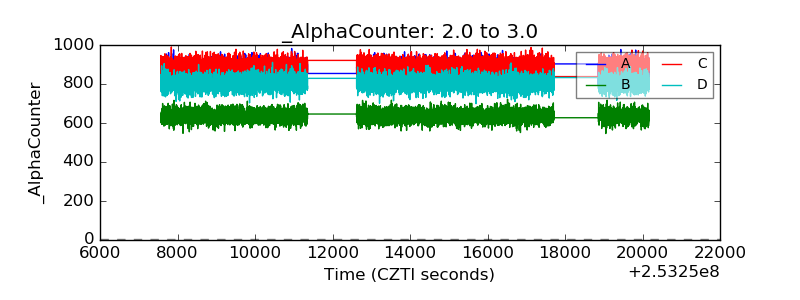 |
| _CPM_Rate | 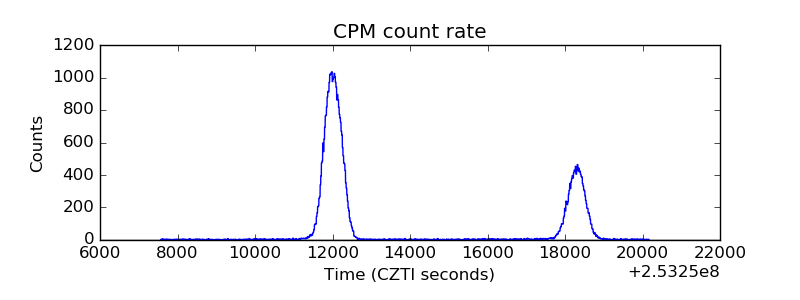 |
| CZT Counter | 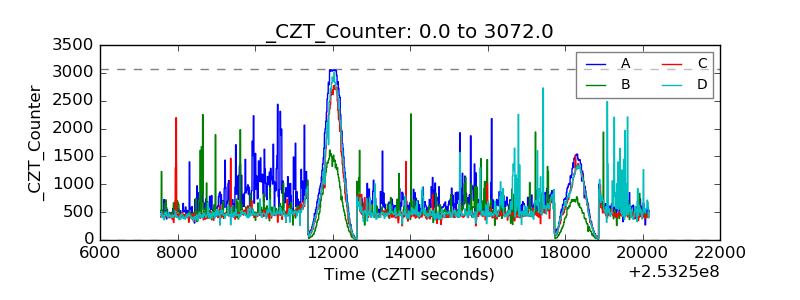 |
| +2.5 Volts monitor |  |
| +5 Volts monitor |  |
| _ROLL_ROT | 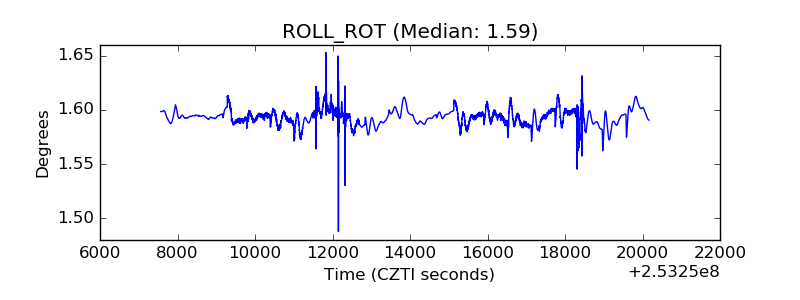 |
| _Roll_DEC | 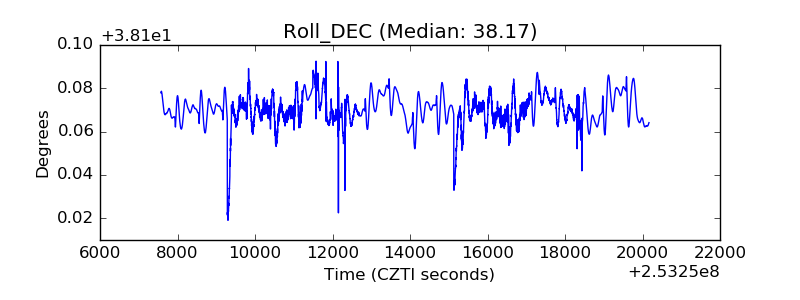 |
| _Roll_RA | 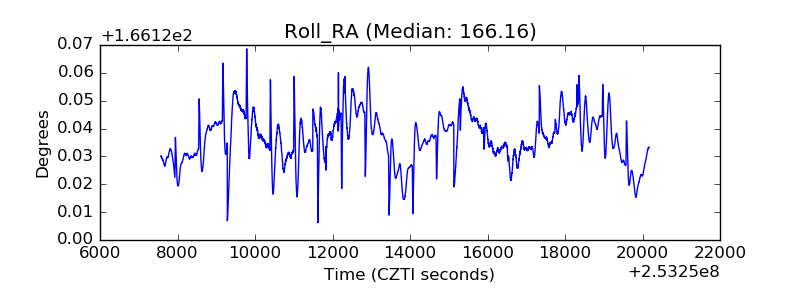 |
| Veto Counter | 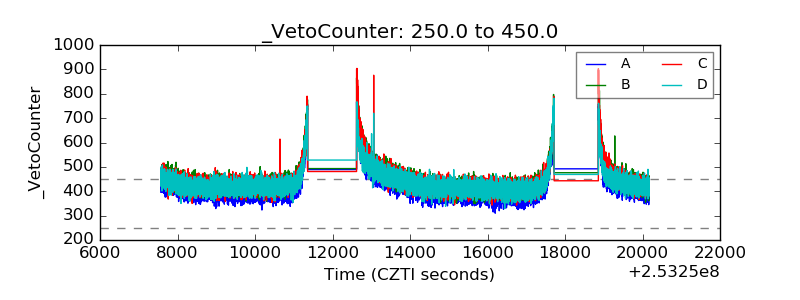 |