| Param | Original file | Final file |
|---|---|---|
| Filename | modeM0/AS1A04_130T04_9000001832_12363cztM0_level2.evt | modeM0/AS1A04_130T04_9000001832_12363cztM0_level2_quad_clean.evt |
| Size (bytes) | 548,161,920 | 83,502,720 |
| Size | 522.8 MB | 79.6 MB |
| Events in quadrant A | 3,996,831 | 523,018 |
| Events in quadrant B | 3,812,151 | 529,185 |
| Events in quadrant C | 3,121,202 | 524,226 |
| Events in quadrant D | 5,217,399 | 485,628 |
| Mode SS | |||
|---|---|---|---|
| Quadrant | BADHDUFLAG | Total packets | Discarded packets |
| A | 0 | 136 | 0 |
| B | 0 | 136 | 0 |
| C | 0 | 136 | 0 |
| D | 0 | 136 | 0 |
| Mode M0 | |||
|---|---|---|---|
| Quadrant | BADHDUFLAG | Total packets | Discarded packets |
| A | 0 | 16260 | 3 |
| B | 0 | 15514 | 2 |
| C | 0 | 13817 | 2 |
| D | 0 | 19924 | 2 |
| Mode M9 | |||
|---|---|---|---|
| Quadrant | BADHDUFLAG | Total packets | Discarded packets |
| A | 0 | 9 | 0 |
| B | 0 | 9 | 0 |
| C | 0 | 9 | 0 |
| D | 0 | 10 | 0 |
| Quadrant | Total seconds | Saturated seconds | Saturation percentage |
|---|---|---|---|
| A | 6688 | 155 | 2.317584% |
| B | 6688 | 204 | 3.050239% |
| C | 6688 | 77 | 1.151316% |
| D | 6688 | 561 | 8.388158% |
Noise dominated data is calculated using 1-second bins in cleaned event files. If a bin has >2000 counts, and if more than 50% of those come from <1% of pixels, then it is considered to be noise-dominated and hence unusable.
| Quadrant | # 1 sec bins | Bins with >0 counts | Bins with >2000 counts | High rate bins dominated by noise | Noise dominated (total time) | Noise dominated (detector-on time) | Marked lightcurve |
|---|---|---|---|---|---|---|---|
| A | 7604 | 6690 | 3 | 3 | 0.04% | 0.04% | 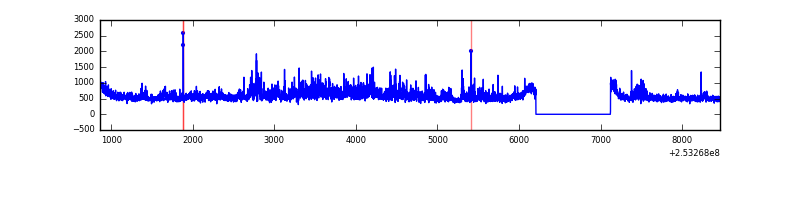 |
| B | 7604 | 6690 | 59 | 59 | 0.78% | 0.88% | 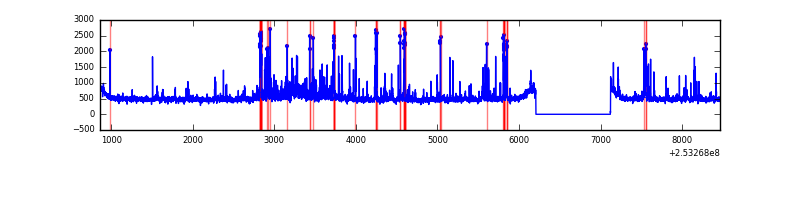 |
| C | 7604 | 6690 | 4 | 4 | 0.05% | 0.06% | 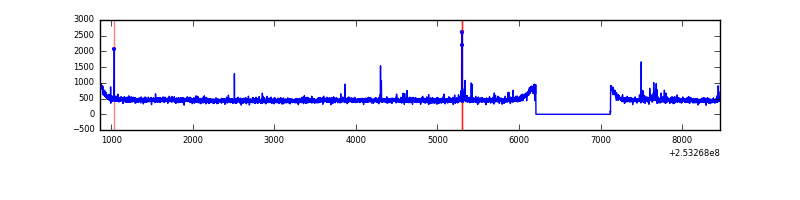 |
| D | 7604 | 6690 | 462 | 462 | 6.08% | 6.91% | 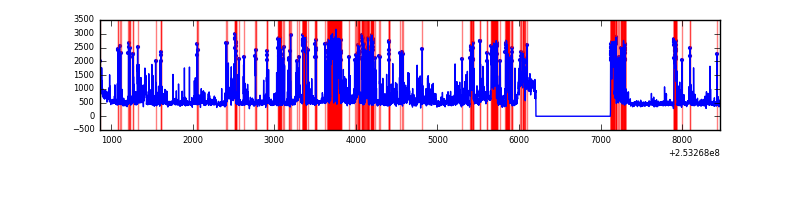 |
Top three noisy pixels from each quadrant. If the there are fewer than three noisy pixels in the level2.evt file, extra rows are filled as -1
| Pixel properties | Quadrant properties | ||||||
|---|---|---|---|---|---|---|---|
| Quadrant | DetID | PixID | Counts | Sigma | Mean | Median | Sigma |
| A | 13 | 251 | 280399 | 1709.33 | 813 | 796 | 163.6 |
| A | 1 | 162 | 206594 | 1258.13 | 813 | 796 | 163.6 |
| A | 1 | 178 | 117775 | 715.14 | 813 | 796 | 163.6 |
| B | 4 | 239 | 299859 | 1952.97 | 808 | 790 | 153.1 |
| B | 10 | 245 | 212377 | 1381.7 | 808 | 790 | 153.1 |
| B | 3 | 64 | 47314 | 303.81 | 808 | 790 | 153.1 |
| C | 15 | 208 | 44513 | 242.63 | 784 | 787 | 180.2 |
| C | 14 | 234 | 13114 | 68.4 | 784 | 787 | 180.2 |
| C | 13 | 61 | 5712 | 27.33 | 784 | 787 | 180.2 |
| D | 1 | 52 | 1788570 | 9790.45 | 759 | 736 | 182.6 |
| D | 13 | 104 | 182951 | 997.83 | 759 | 736 | 182.6 |
| D | 9 | 85 | 106419 | 578.73 | 759 | 736 | 182.6 |
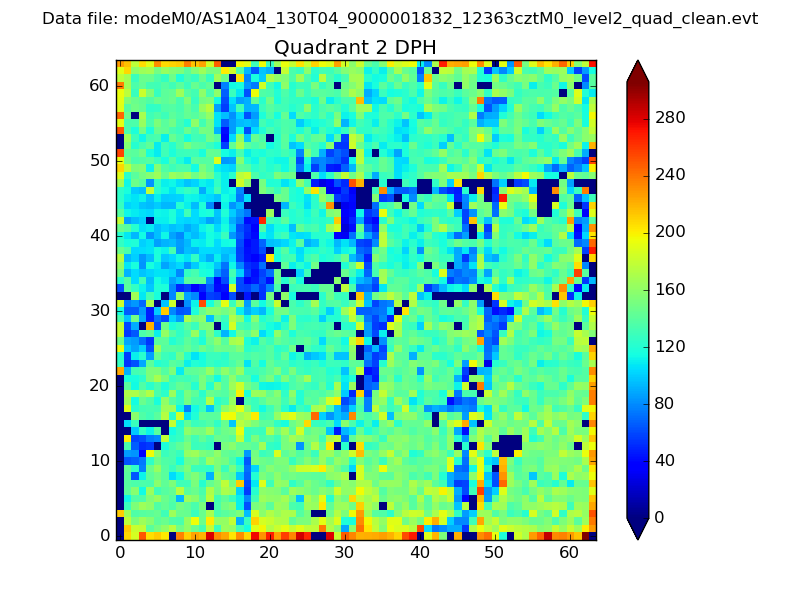
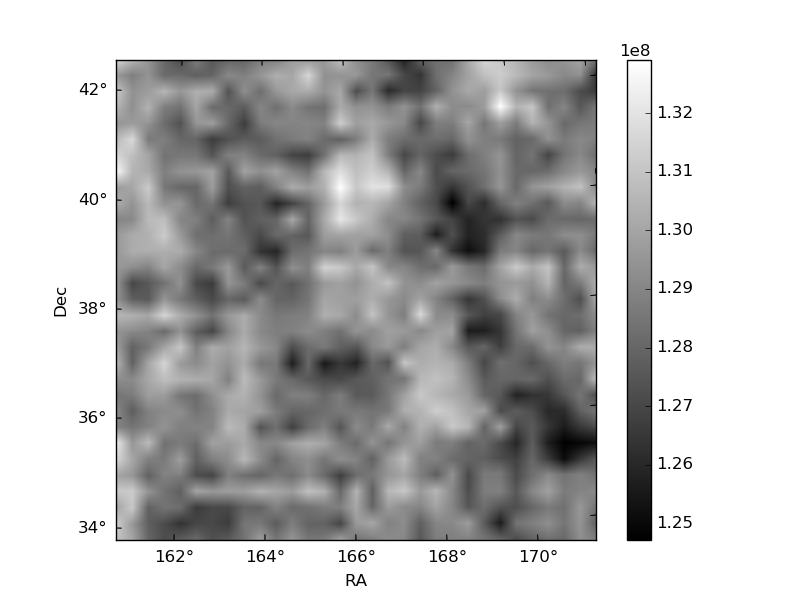
Histogram calculated using DETX and DETY for each event in the final _common_clean file
| Quadrant A | 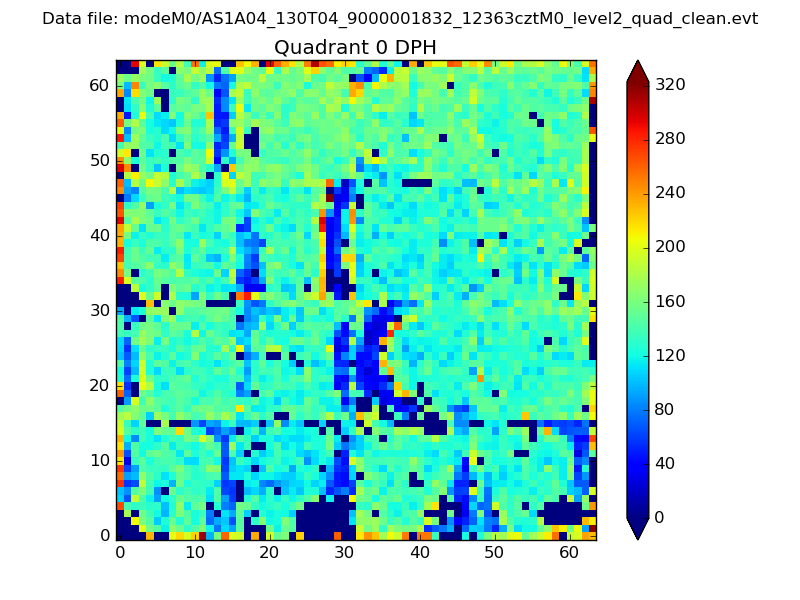 |
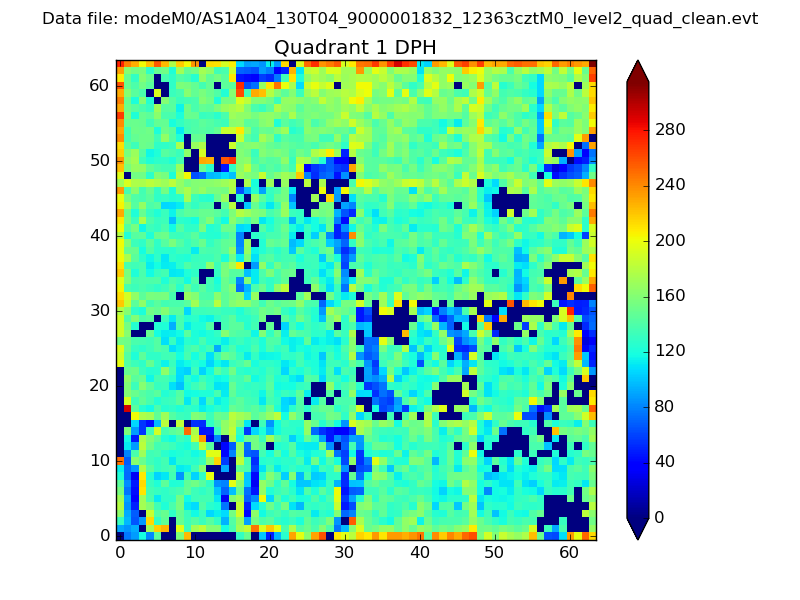 |
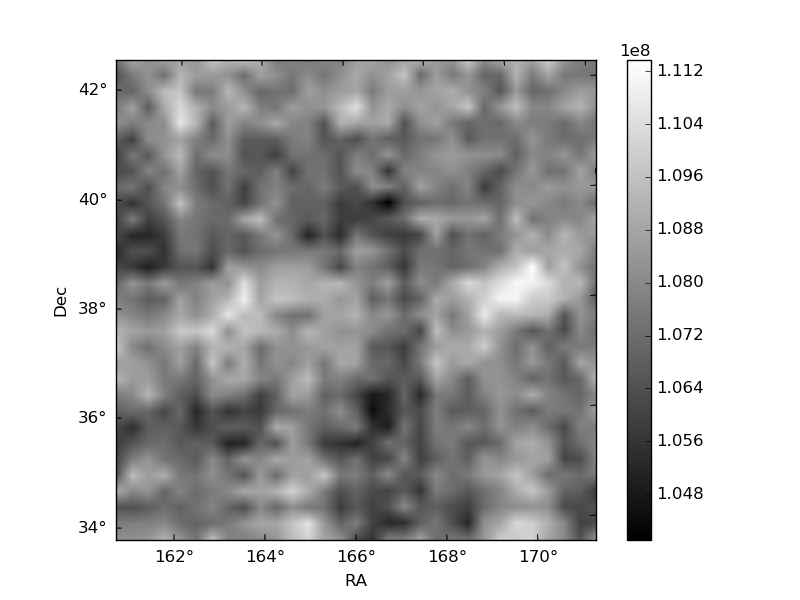
Quadrant B |
|---|---|---|---|
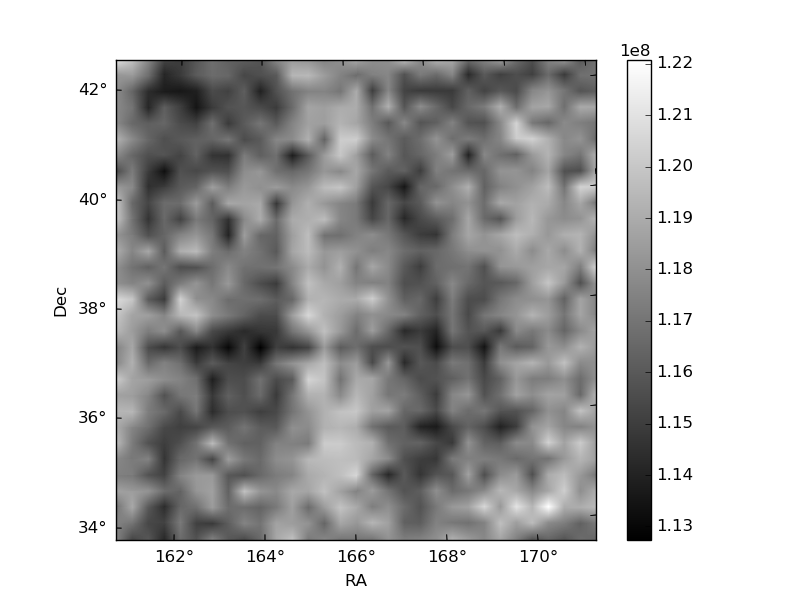
| Quadrant D | 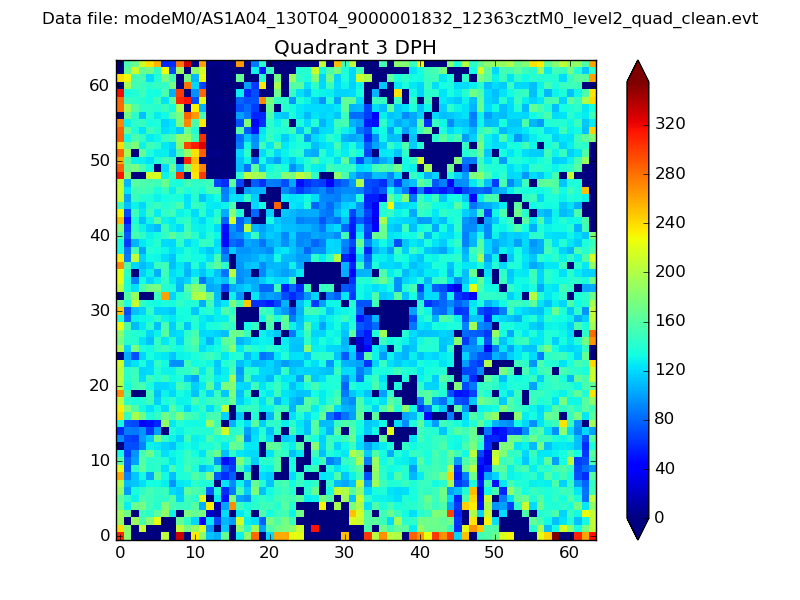 |
 |
Quadrant C |
| Plot type | Count rate plots | Images |
|---|---|---|
| Comparison with Poisson distribution Blue bars denote a histogram of data divided into 1 sec bins. Red curve is a Poisson curve with rate = median count rate of data. |
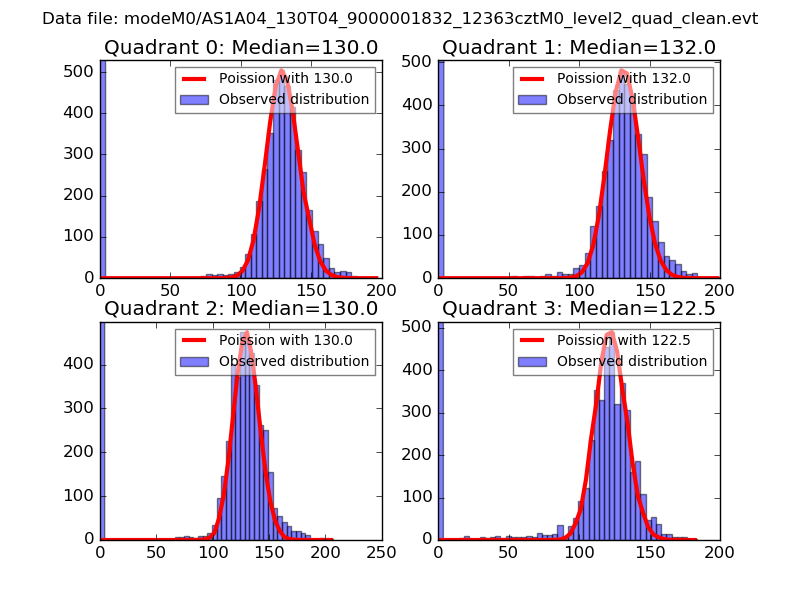 |
 |
| Quadrant-wise count rates Data is divided into 100 sec bins |
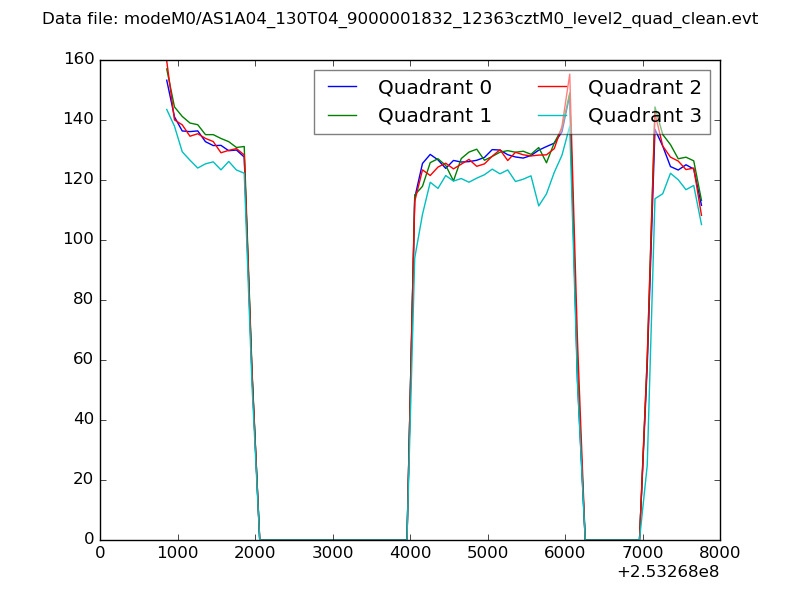 |
|
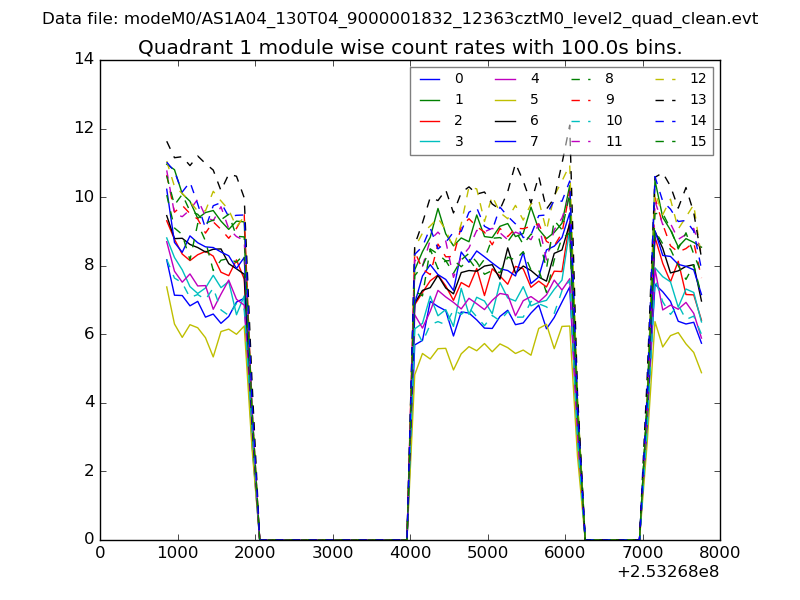
| Module-wise count rates for Quadrant A Data is divided into 100 sec bins |
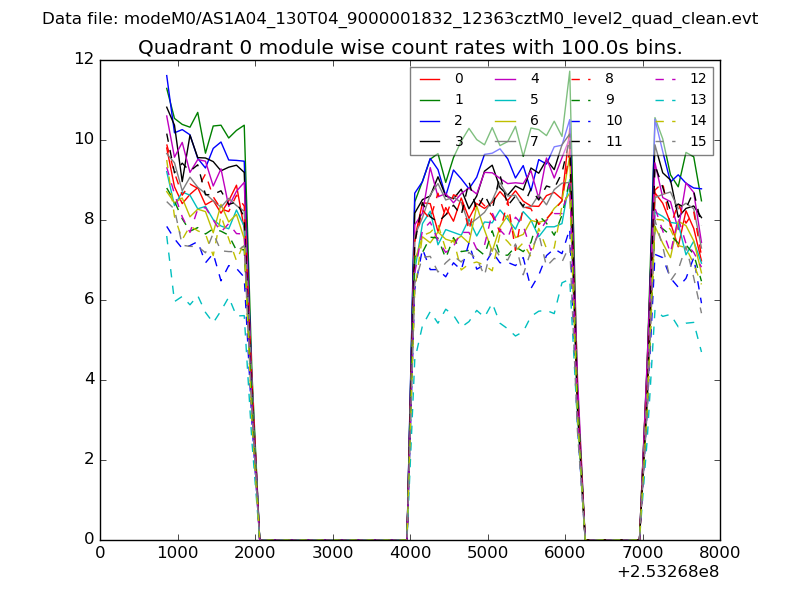 |
 |
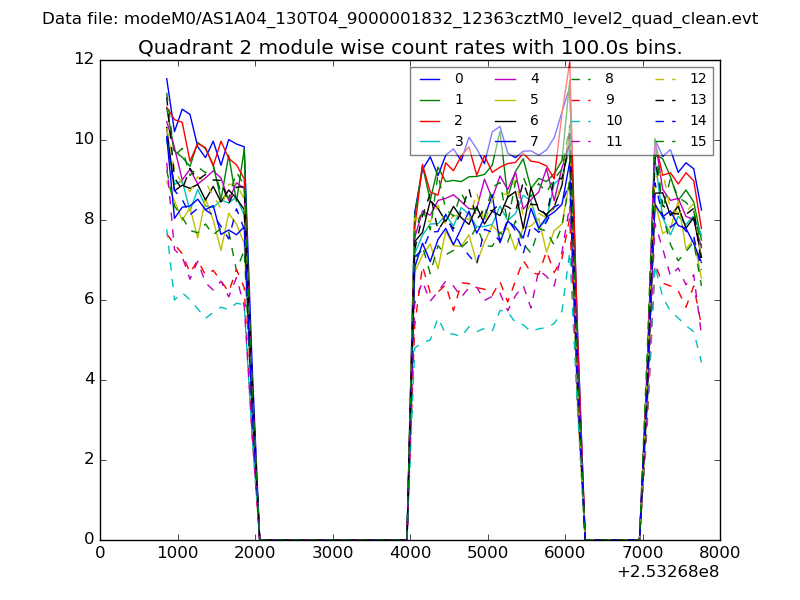
| Module-wise count rates for Quadrant B Data is divided into 100 sec bins |
 |
 |
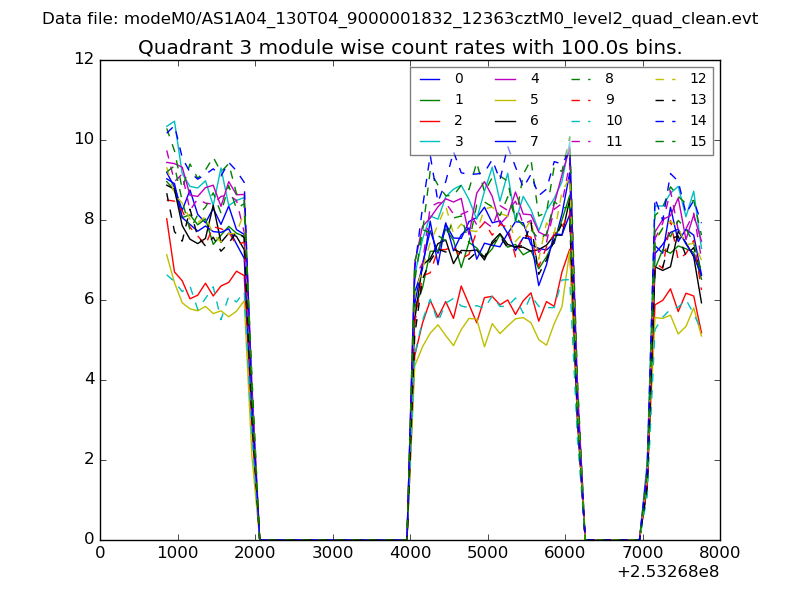
| Module-wise count rates for Quadrant C Data is divided into 100 sec bins |
 |
 |
| Module-wise count rates for Quadrant D Data is divided into 100 sec bins |
 |
 |
| Parameter | Plot |
|---|---|
| CZT HV Monitor | 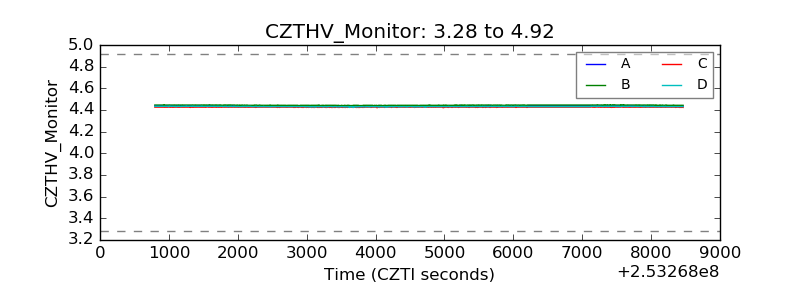 |
| D_VDD | 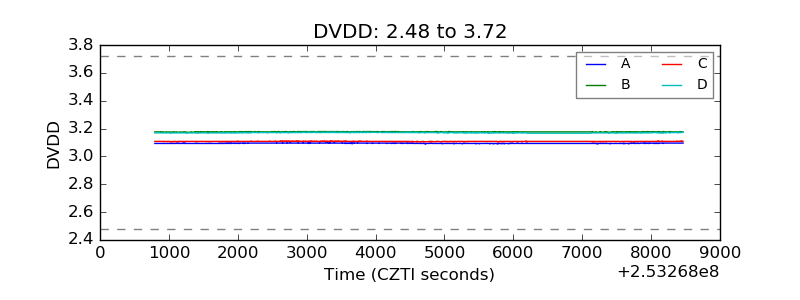 |
| Temperature 1 | 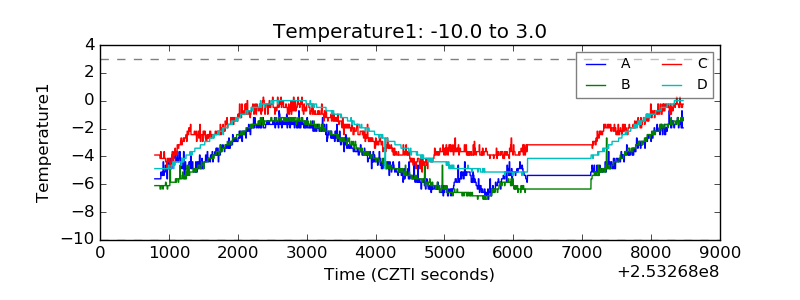 |
| Veto HV Monitor | 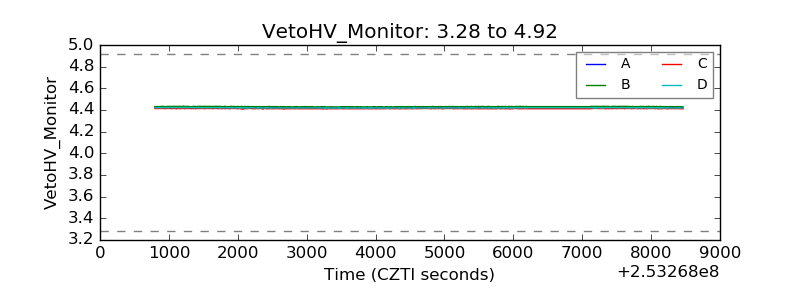 |
| Veto LLD | 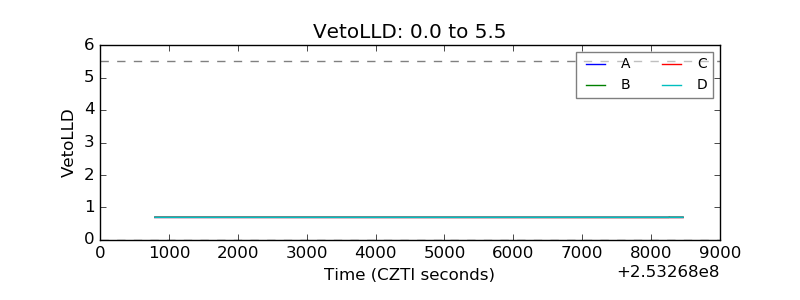 |
| Alpha Counter | 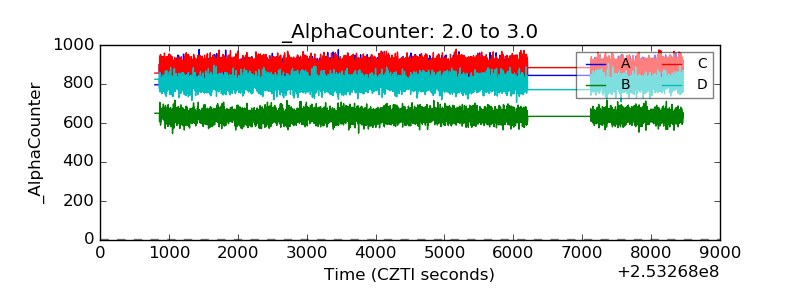 |
| _CPM_Rate | 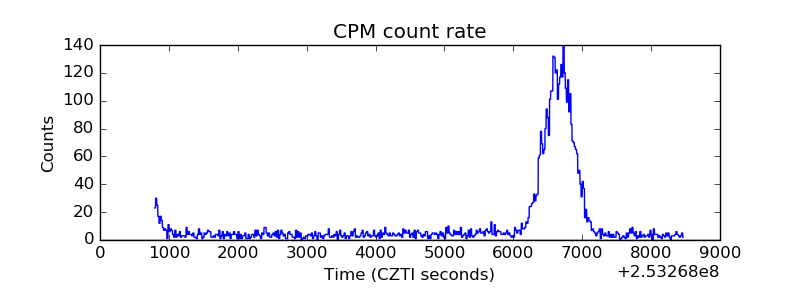 |
| CZT Counter | 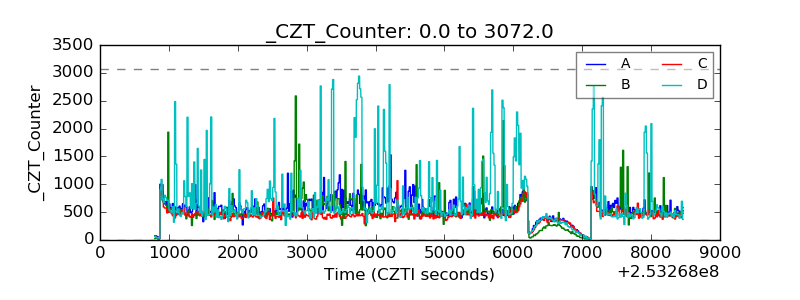 |
| +2.5 Volts monitor |  |
| +5 Volts monitor |  |
| _ROLL_ROT | 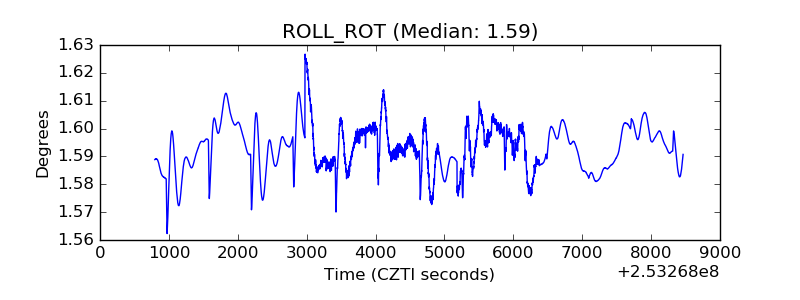 |
| _Roll_DEC | 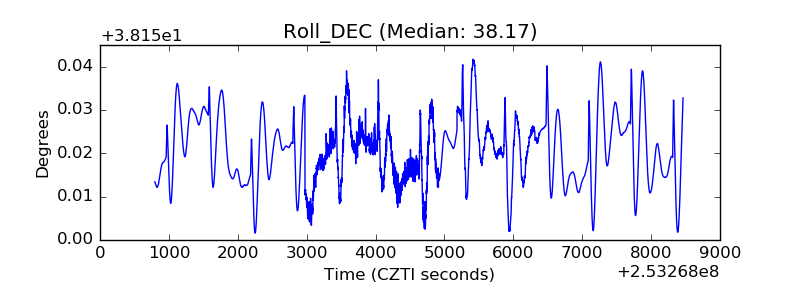 |
| _Roll_RA |  |
| Veto Counter | 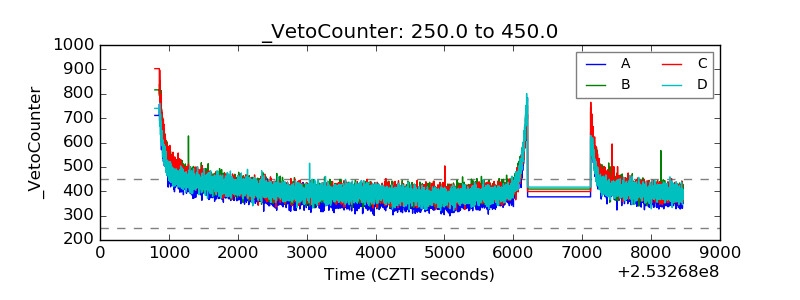 |