| Param | Original file | Final file |
|---|---|---|
| Filename | modeM0/AS1A04_130T04_9000001832_12364cztM0_level2.evt | modeM0/AS1A04_130T04_9000001832_12364cztM0_level2_quad_clean.evt |
| Size (bytes) | 559,491,840 | 81,832,320 |
| Size | 533.6 MB | 78.0 MB |
| Events in quadrant A | 4,126,769 | 498,904 |
| Events in quadrant B | 3,874,663 | 507,163 |
| Events in quadrant C | 3,576,532 | 502,622 |
| Events in quadrant D | 4,869,089 | 458,949 |
| Mode SS | |||
|---|---|---|---|
| Quadrant | BADHDUFLAG | Total packets | Discarded packets |
| A | 0 | 148 | 0 |
| B | 0 | 148 | 0 |
| C | 0 | 148 | 0 |
| D | 0 | 148 | 0 |
| Mode M0 | |||
|---|---|---|---|
| Quadrant | BADHDUFLAG | Total packets | Discarded packets |
| A | 0 | 17004 | 3 |
| B | 0 | 16218 | 2 |
| C | 0 | 15750 | 2 |
| D | 0 | 19430 | 2 |
| Mode M9 | |||
|---|---|---|---|
| Quadrant | BADHDUFLAG | Total packets | Discarded packets |
| A | 0 | 7 | 0 |
| B | 0 | 7 | 0 |
| C | 0 | 7 | 0 |
| D | 0 | 8 | 0 |
| Quadrant | Total seconds | Saturated seconds | Saturation percentage |
|---|---|---|---|
| A | 7327 | 184 | 2.511260% |
| B | 7327 | 192 | 2.620445% |
| C | 7327 | 130 | 1.774260% |
| D | 7327 | 530 | 7.233520% |
Noise dominated data is calculated using 1-second bins in cleaned event files. If a bin has >2000 counts, and if more than 50% of those come from <1% of pixels, then it is considered to be noise-dominated and hence unusable.
| Quadrant | # 1 sec bins | Bins with >0 counts | Bins with >2000 counts | High rate bins dominated by noise | Noise dominated (total time) | Noise dominated (detector-on time) | Marked lightcurve |
|---|---|---|---|---|---|---|---|
| A | 7838 | 7328 | 1 | 1 | 0.01% | 0.01% | 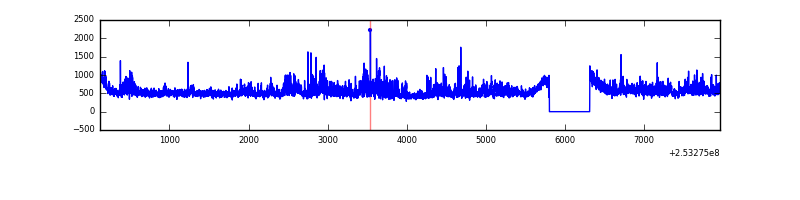 |
| B | 7838 | 7329 | 28 | 28 | 0.36% | 0.38% | 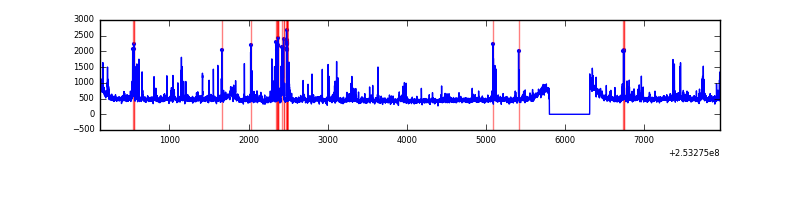 |
| C | 7838 | 7329 | 31 | 31 | 0.40% | 0.42% | 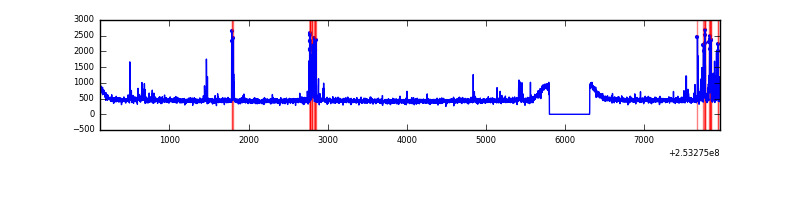 |
| D | 7838 | 7329 | 423 | 423 | 5.40% | 5.77% | 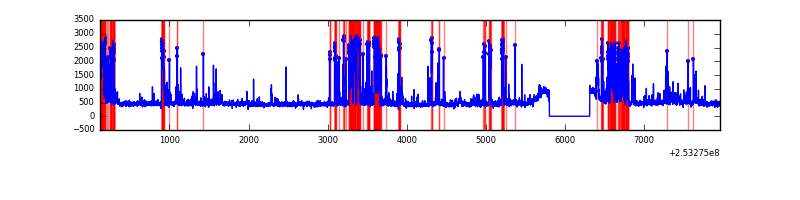 |
Top three noisy pixels from each quadrant. If the there are fewer than three noisy pixels in the level2.evt file, extra rows are filled as -1
| Pixel properties | Quadrant properties | ||||||
|---|---|---|---|---|---|---|---|
| Quadrant | DetID | PixID | Counts | Sigma | Mean | Median | Sigma |
| A | 1 | 162 | 214506 | 1182.46 | 881 | 862 | 180.7 |
| A | 13 | 251 | 130950 | 720.0 | 881 | 862 | 180.7 |
| A | 1 | 178 | 124129 | 682.25 | 881 | 862 | 180.7 |
| B | 4 | 239 | 240931 | 1421.72 | 879 | 858 | 168.9 |
| B | 10 | 245 | 79316 | 464.63 | 879 | 858 | 168.9 |
| B | 0 | 228 | 20472 | 116.15 | 879 | 858 | 168.9 |
| C | 15 | 208 | 249602 | 1257.36 | 851 | 855 | 197.8 |
| C | 0 | 207 | 7411 | 33.14 | 851 | 855 | 197.8 |
| C | 13 | 61 | 6435 | 28.21 | 851 | 855 | 197.8 |
| D | 1 | 52 | 1435723 | 7143.02 | 832 | 806 | 200.9 |
| D | 14 | 34 | 68681 | 337.88 | 832 | 806 | 200.9 |
| D | 13 | 104 | 46675 | 228.34 | 832 | 806 | 200.9 |
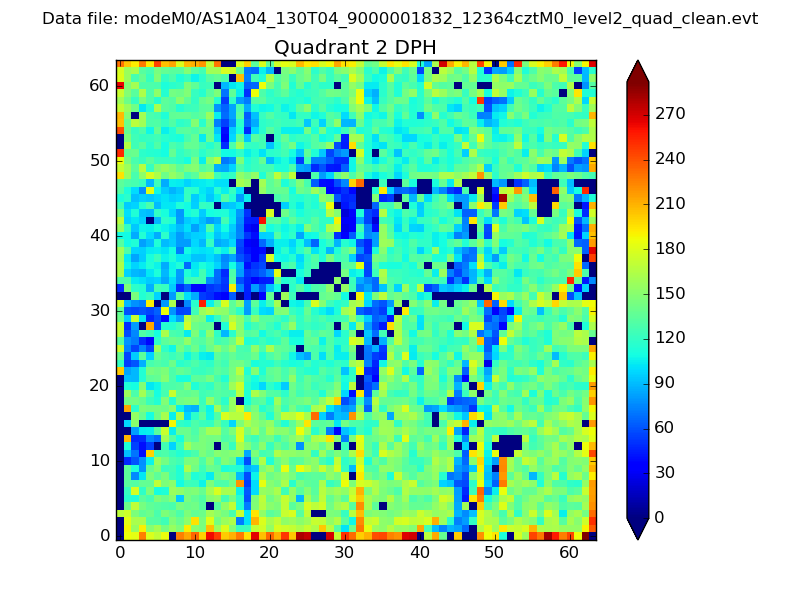
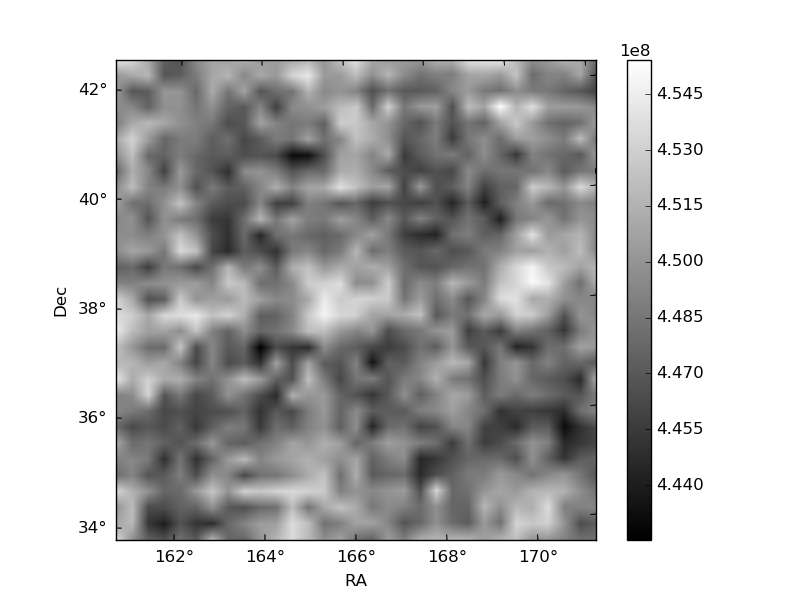
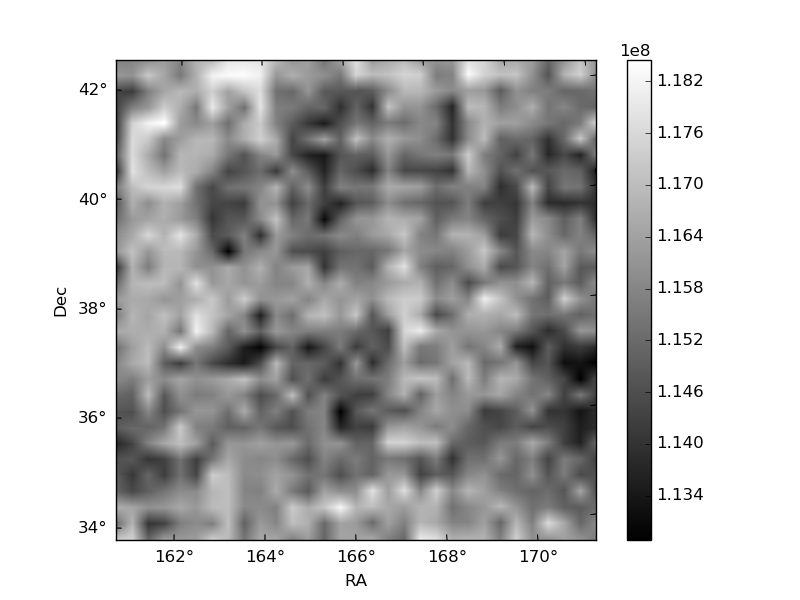
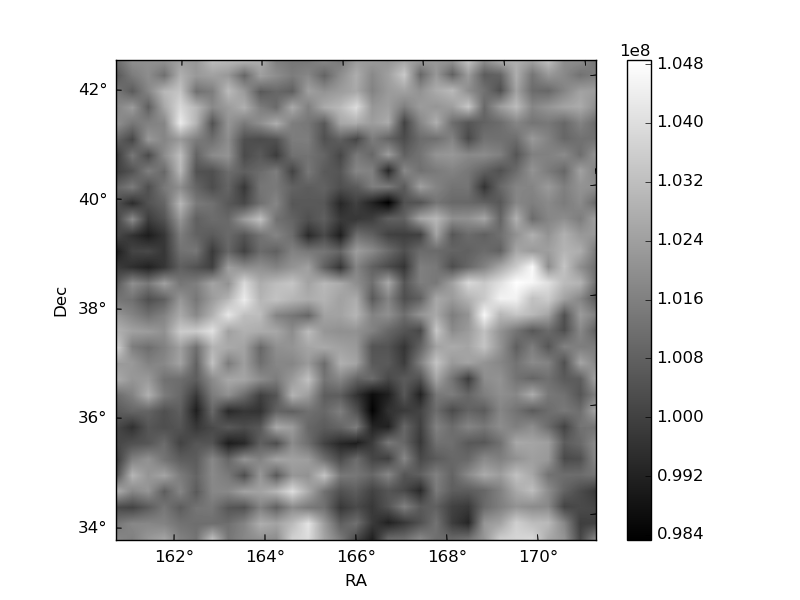
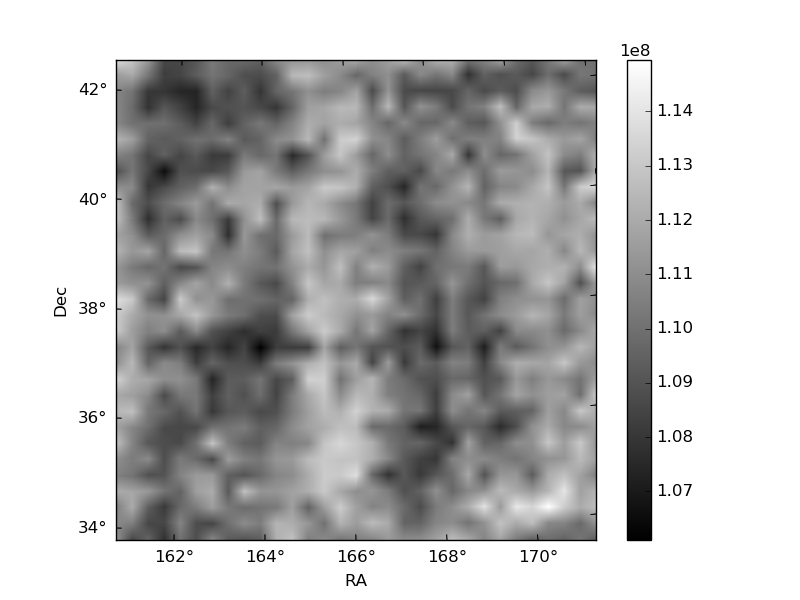
Histogram calculated using DETX and DETY for each event in the final _common_clean file
| Quadrant A | 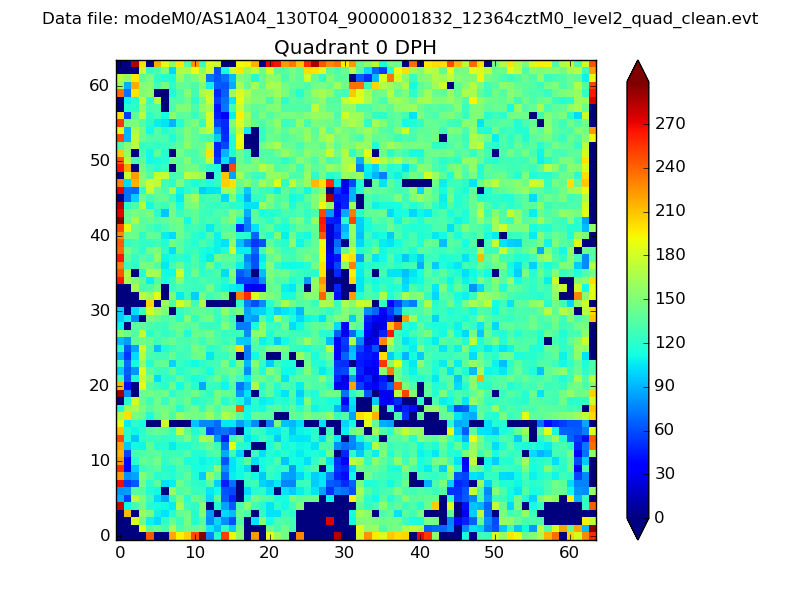 |
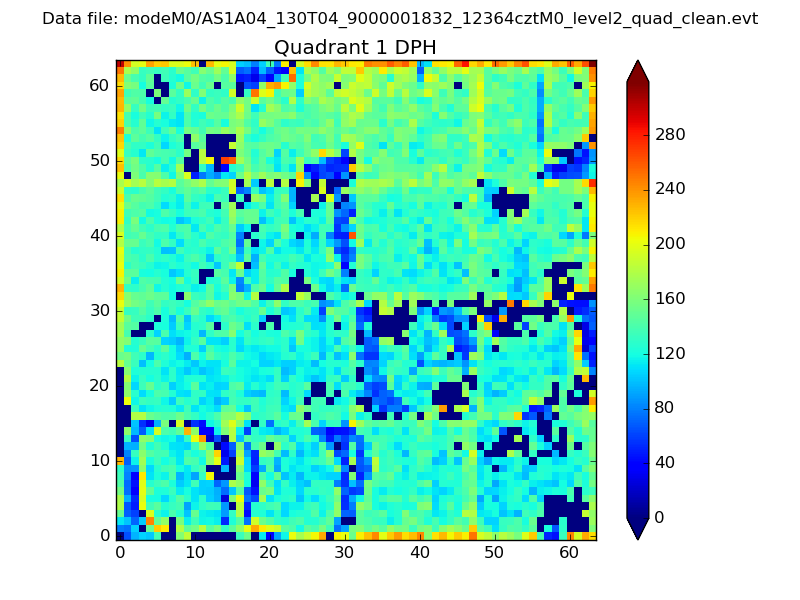 |
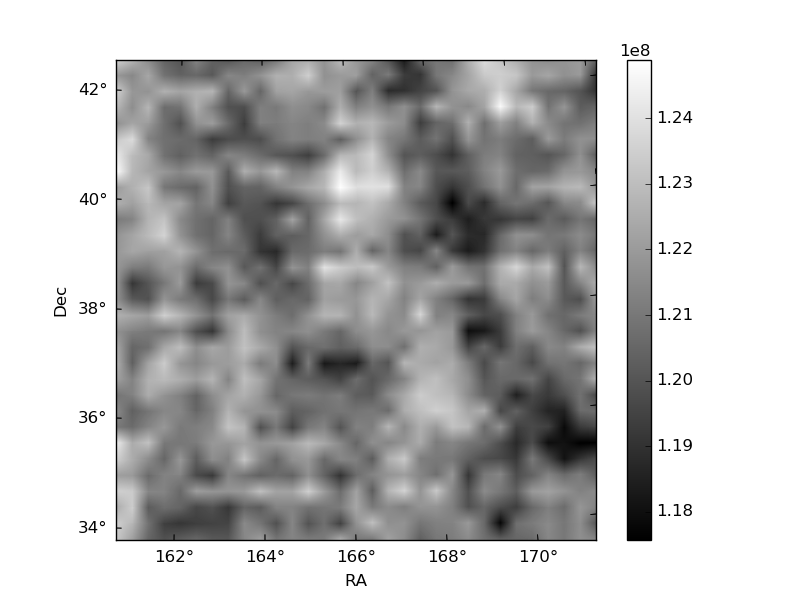
Quadrant B |
|---|---|---|---|
| Quadrant D | 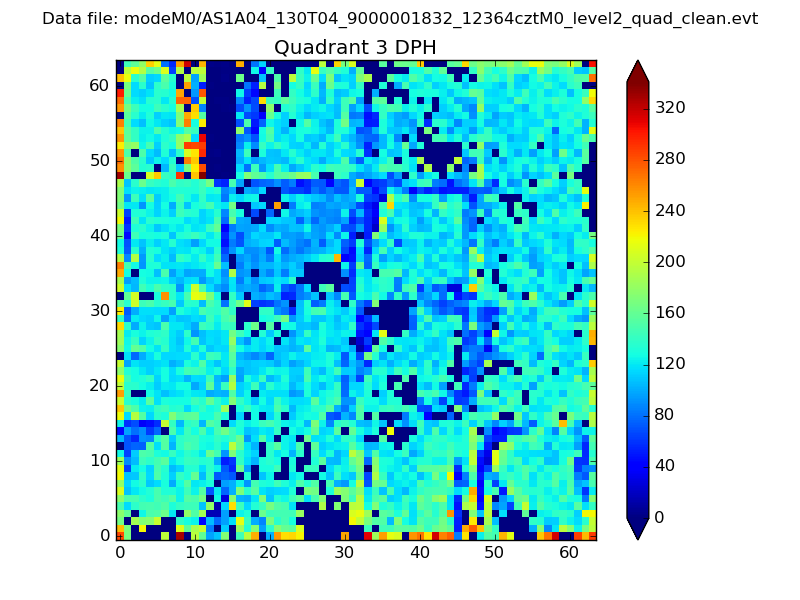 |
 |
Quadrant C |
| Plot type | Count rate plots | Images |
|---|---|---|
| Comparison with Poisson distribution Blue bars denote a histogram of data divided into 1 sec bins. Red curve is a Poisson curve with rate = median count rate of data. |
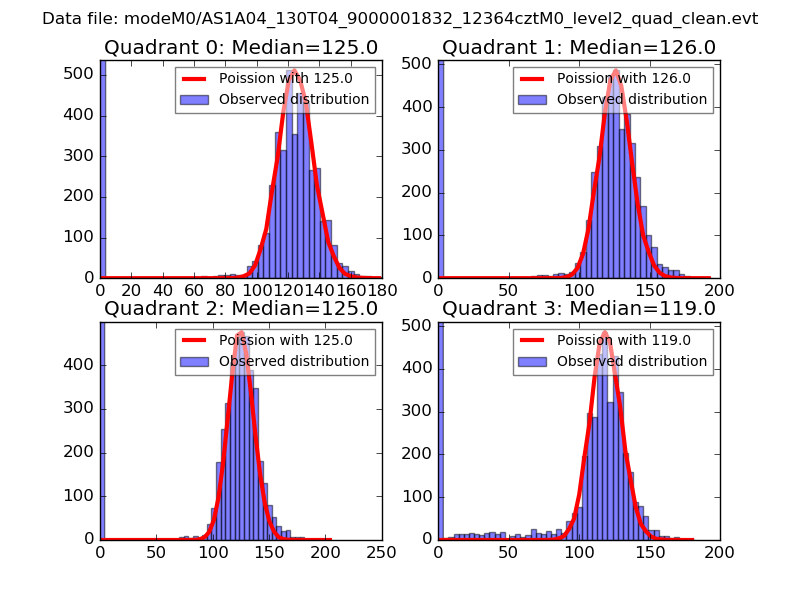 |
 |
| Quadrant-wise count rates Data is divided into 100 sec bins |
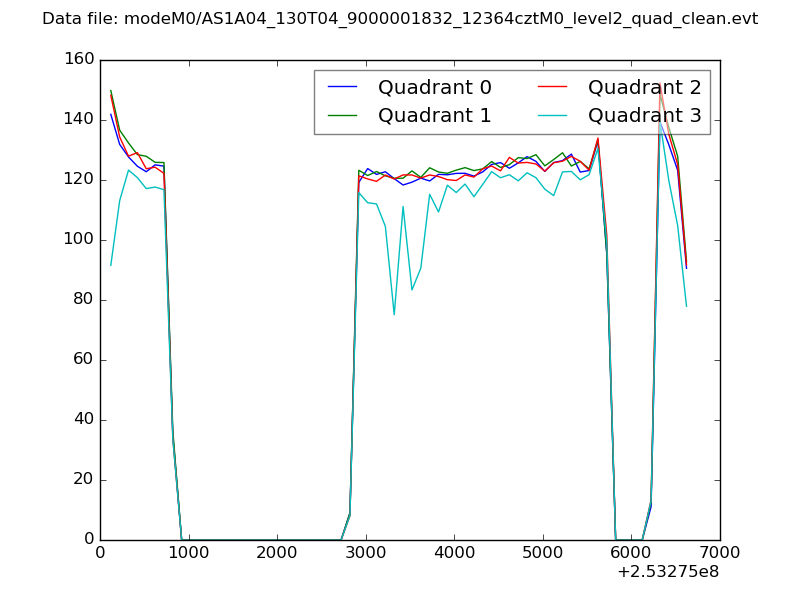 |
|
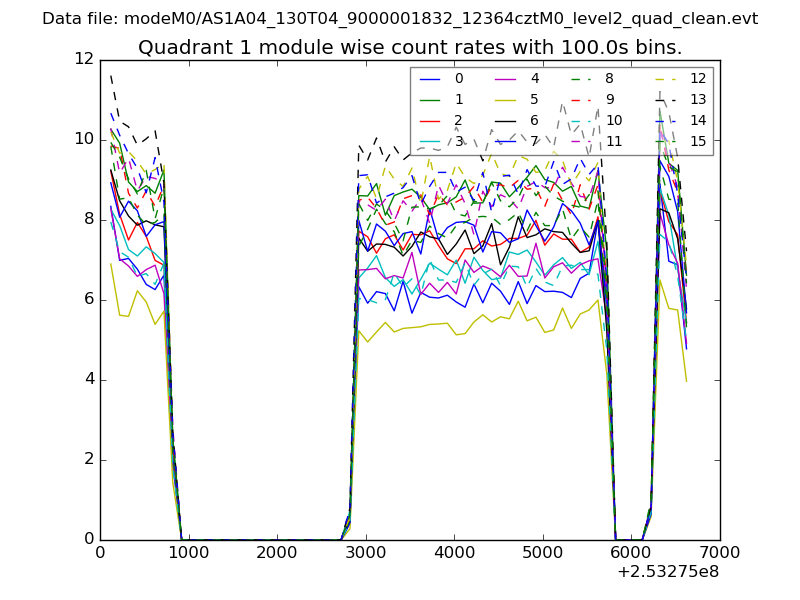
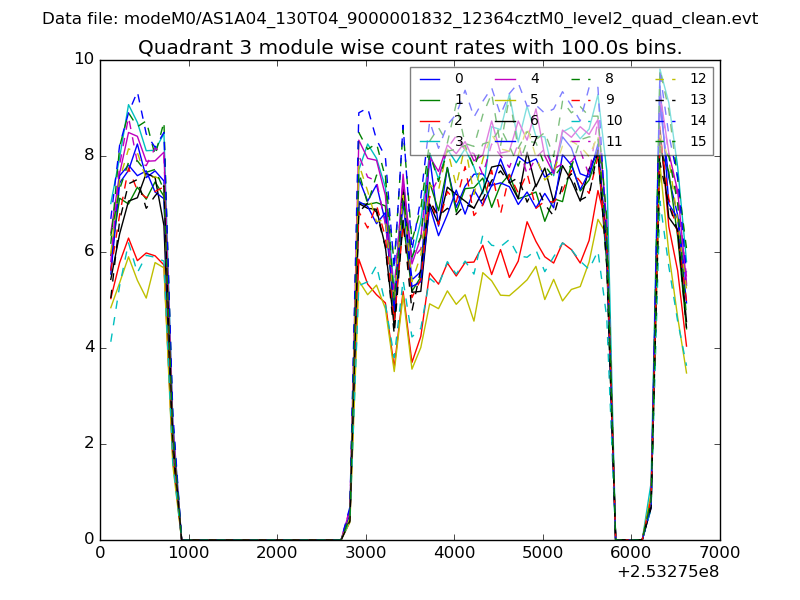
| Module-wise count rates for Quadrant A Data is divided into 100 sec bins |
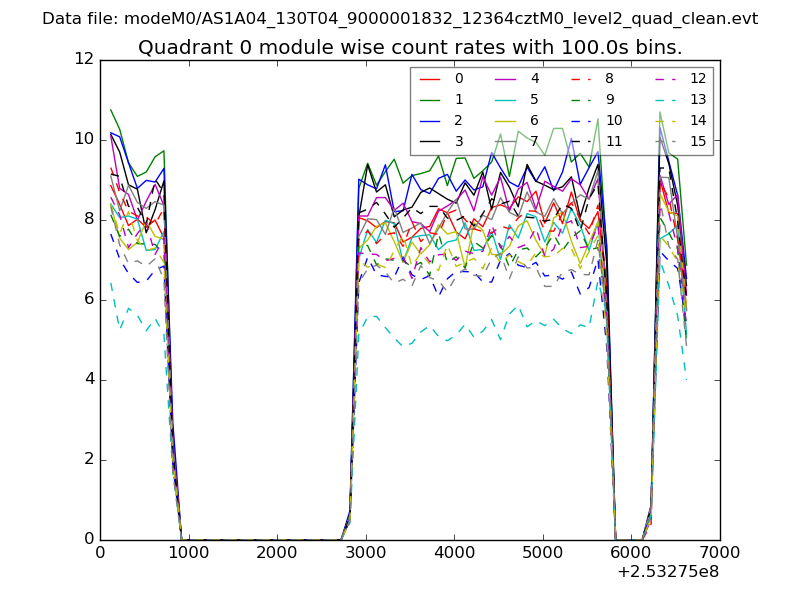 |
 |
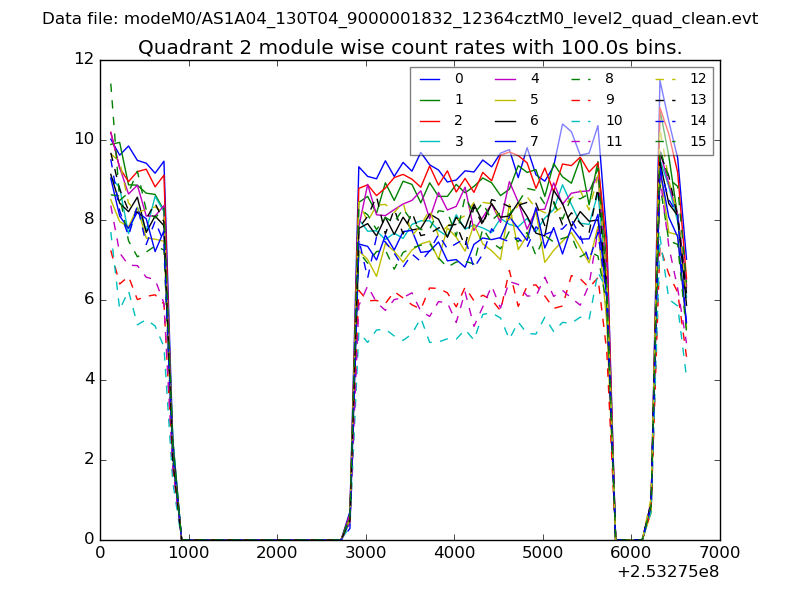
| Module-wise count rates for Quadrant B Data is divided into 100 sec bins |
 |
 |
| Module-wise count rates for Quadrant C Data is divided into 100 sec bins |
 |
 |
| Module-wise count rates for Quadrant D Data is divided into 100 sec bins |
 |
 |
| Parameter | Plot |
|---|---|
| CZT HV Monitor | 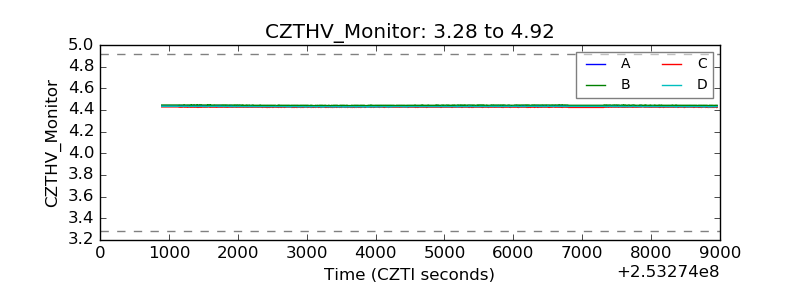 |
| D_VDD | 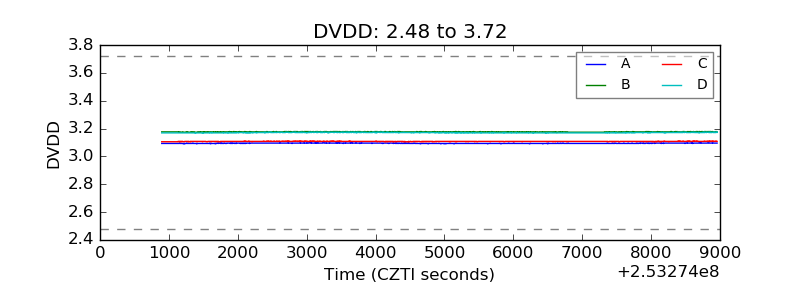 |
| Temperature 1 | 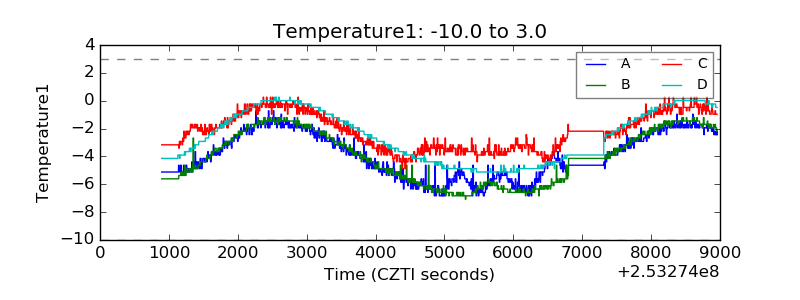 |
| Veto HV Monitor | 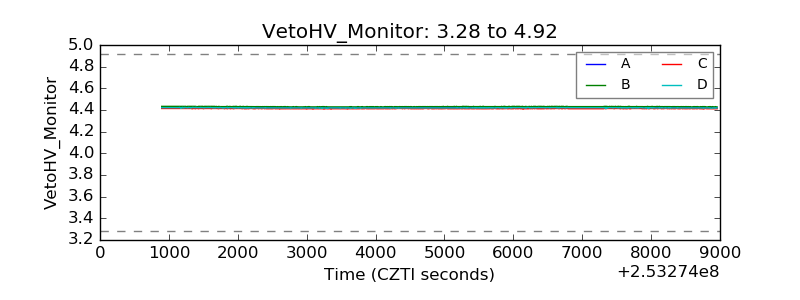 |
| Veto LLD | 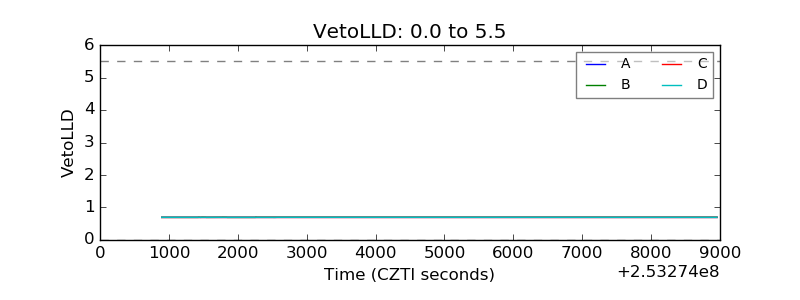 |
| Alpha Counter | 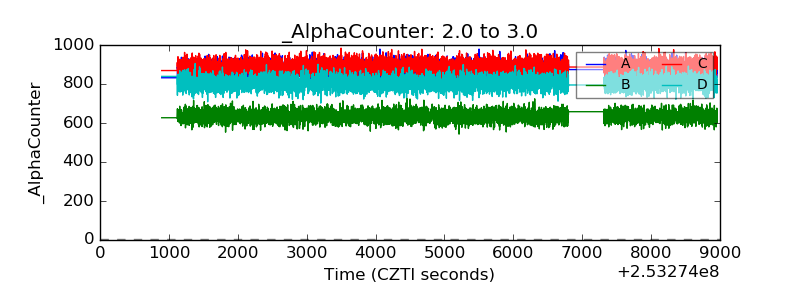 |
| _CPM_Rate |  |
| CZT Counter | 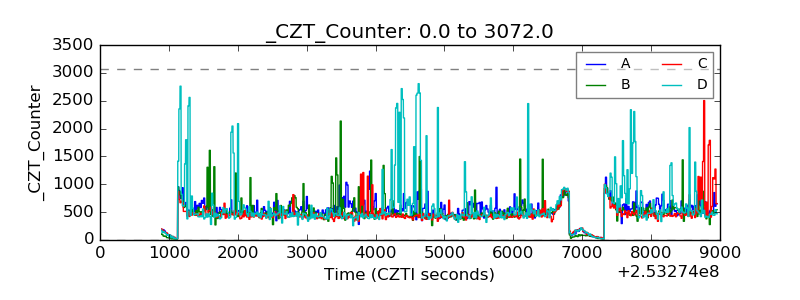 |
| +2.5 Volts monitor |  |
| +5 Volts monitor |  |
| _ROLL_ROT | 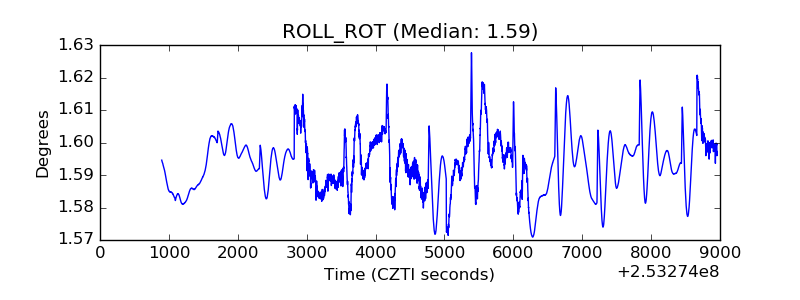 |
| _Roll_DEC | 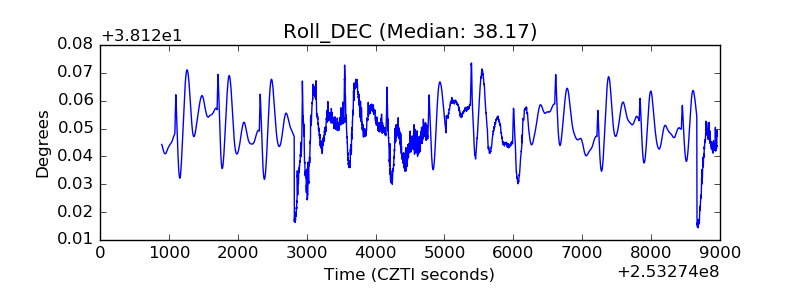 |
| _Roll_RA | 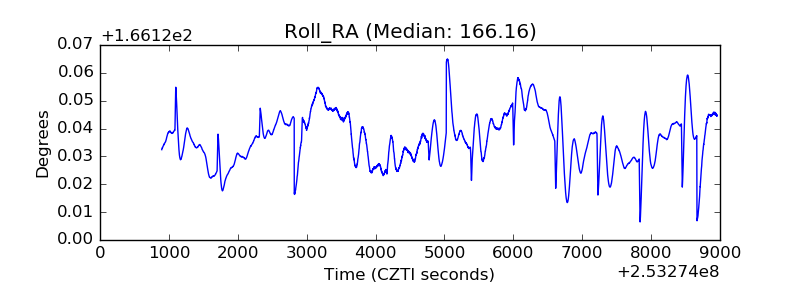 |
| Veto Counter | 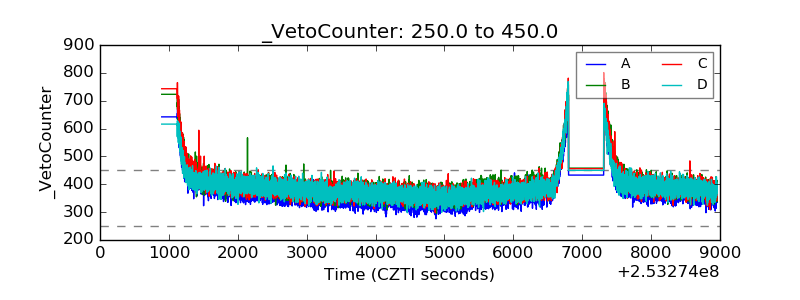 |