| Param | Original file | Final file |
|---|---|---|
| Filename | modeM0/AS1A04_130T04_9000001832_12365cztM0_level2.evt | modeM0/AS1A04_130T04_9000001832_12365cztM0_level2_quad_clean.evt |
| Size (bytes) | 272,016,000 | 32,552,640 |
| Size | 259.4 MB | 31.0 MB |
| Events in quadrant A | 2,098,014 | 184,821 |
| Events in quadrant B | 1,865,609 | 186,353 |
| Events in quadrant C | 1,782,875 | 185,942 |
| Events in quadrant D | 2,246,297 | 173,887 |
| Mode SS | |||
|---|---|---|---|
| Quadrant | BADHDUFLAG | Total packets | Discarded packets |
| A | 0 | 72 | 0 |
| B | 0 | 72 | 0 |
| C | 0 | 72 | 0 |
| D | 0 | 72 | 0 |
| Mode M0 | |||
|---|---|---|---|
| Quadrant | BADHDUFLAG | Total packets | Discarded packets |
| A | 0 | 8609 | 1 |
| B | 0 | 7874 | 1 |
| C | 0 | 7821 | 1 |
| D | 0 | 9166 | 1 |
| Mode M9 | |||
|---|---|---|---|
| Quadrant | BADHDUFLAG | Total packets | Discarded packets |
| A | 0 | 3 | 0 |
| B | 0 | 3 | 0 |
| C | 0 | 3 | 0 |
| D | 0 | 4 | 0 |
| Quadrant | Total seconds | Saturated seconds | Saturation percentage |
|---|---|---|---|
| A | 3587 | 63 | 1.756342% |
| B | 3587 | 68 | 1.895735% |
| C | 3587 | 46 | 1.282409% |
| D | 3587 | 149 | 4.153889% |
Noise dominated data is calculated using 1-second bins in cleaned event files. If a bin has >2000 counts, and if more than 50% of those come from <1% of pixels, then it is considered to be noise-dominated and hence unusable.
| Quadrant | # 1 sec bins | Bins with >0 counts | Bins with >2000 counts | High rate bins dominated by noise | Noise dominated (total time) | Noise dominated (detector-on time) | Marked lightcurve |
|---|---|---|---|---|---|---|---|
| A | 3587 | 3587 | 1 | 1 | 0.03% | 0.03% | 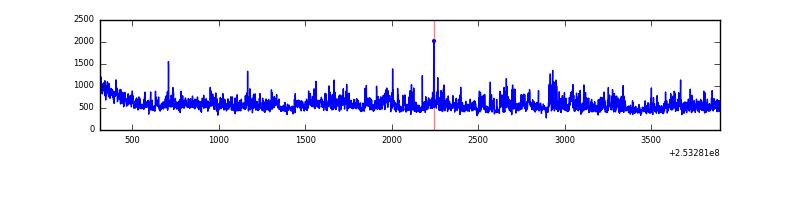 |
| B | 3588 | 3588 | 12 | 12 | 0.33% | 0.33% | 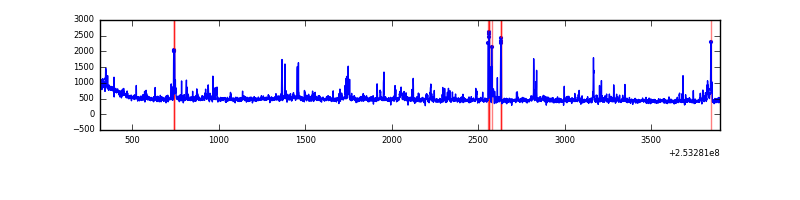 |
| C | 3588 | 3588 | 18 | 18 | 0.50% | 0.50% | 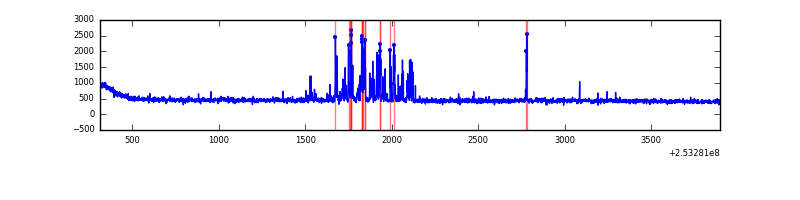 |
| D | 3588 | 3588 | 115 | 115 | 3.21% | 3.21% | 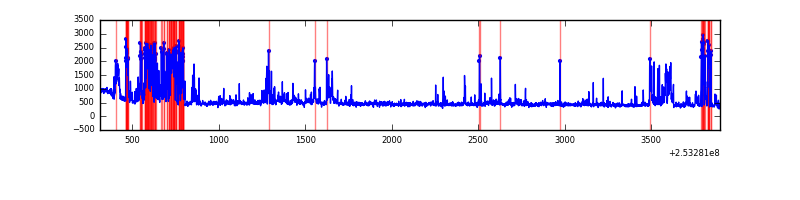 |
Top three noisy pixels from each quadrant. If the there are fewer than three noisy pixels in the level2.evt file, extra rows are filled as -1
| Pixel properties | Quadrant properties | ||||||
|---|---|---|---|---|---|---|---|
| Quadrant | DetID | PixID | Counts | Sigma | Mean | Median | Sigma |
| A | 13 | 251 | 175926 | 1992.73 | 422 | 414 | 88.1 |
| A | 1 | 162 | 96535 | 1091.34 | 422 | 414 | 88.1 |
| A | 1 | 178 | 54732 | 616.72 | 422 | 414 | 88.1 |
| B | 4 | 239 | 83873 | 1021.69 | 422 | 412 | 81.7 |
| B | 10 | 245 | 67216 | 817.79 | 422 | 412 | 81.7 |
| B | 10 | 244 | 14737 | 175.36 | 422 | 412 | 81.7 |
| C | 15 | 208 | 175123 | 1800.35 | 411 | 412 | 97.0 |
| C | 0 | 207 | 3502 | 31.84 | 411 | 412 | 97.0 |
| C | 13 | 61 | 3041 | 27.09 | 411 | 412 | 97.0 |
| D | 1 | 52 | 371167 | 3676.22 | 409 | 397 | 100.9 |
| D | 13 | 104 | 100285 | 990.4 | 409 | 397 | 100.9 |
| D | 14 | 34 | 88986 | 878.37 | 409 | 397 | 100.9 |
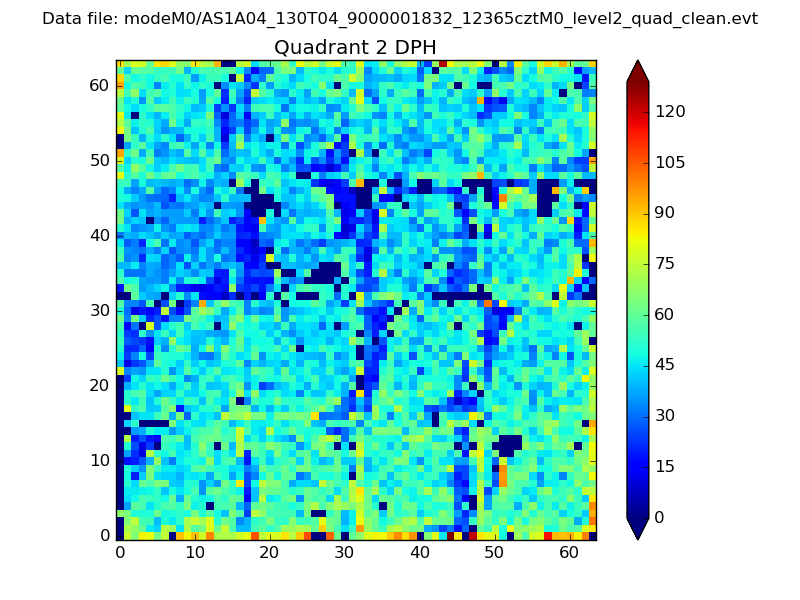
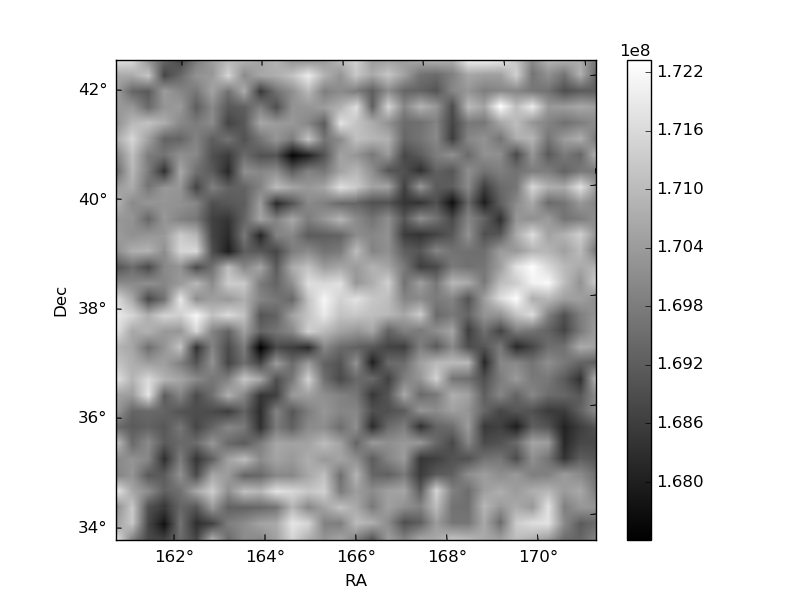
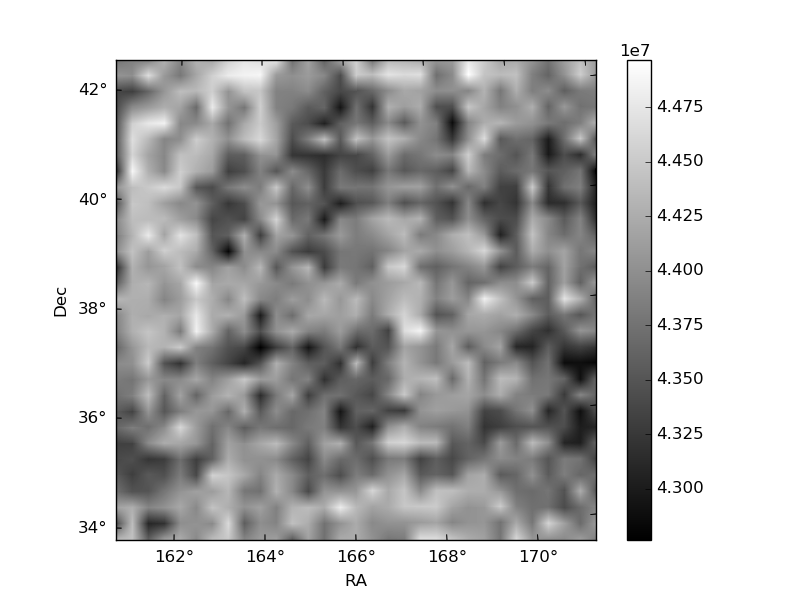
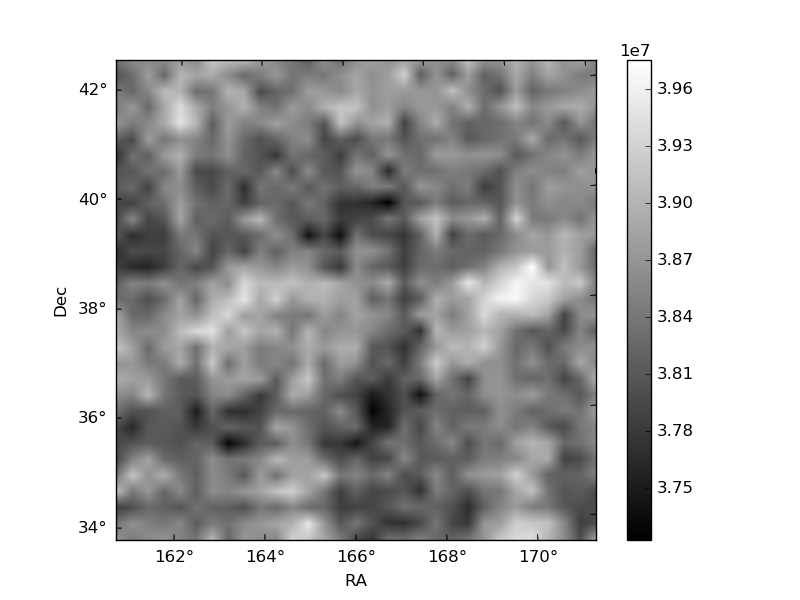
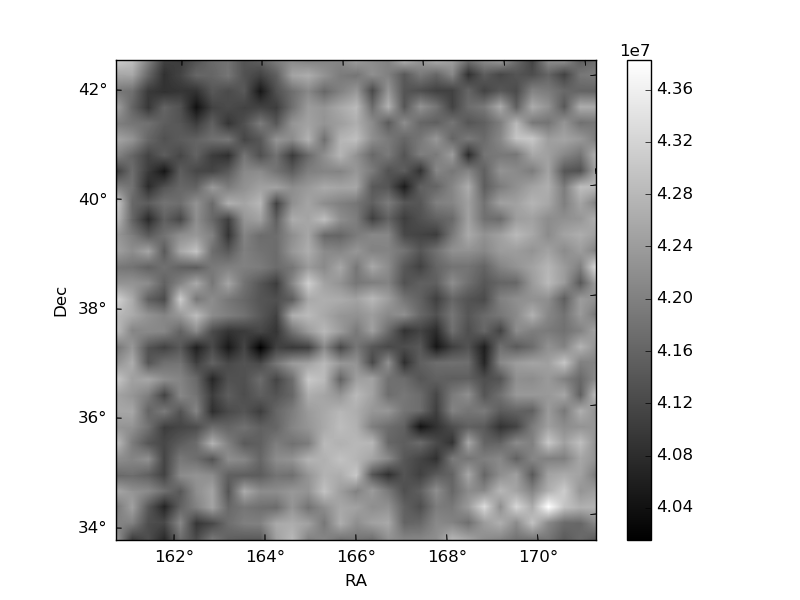
Histogram calculated using DETX and DETY for each event in the final _common_clean file
| Quadrant A | 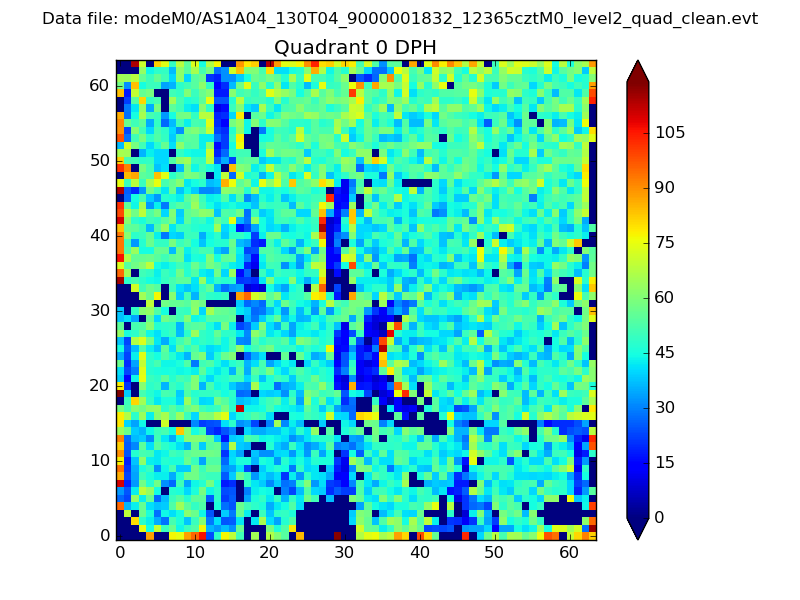 |
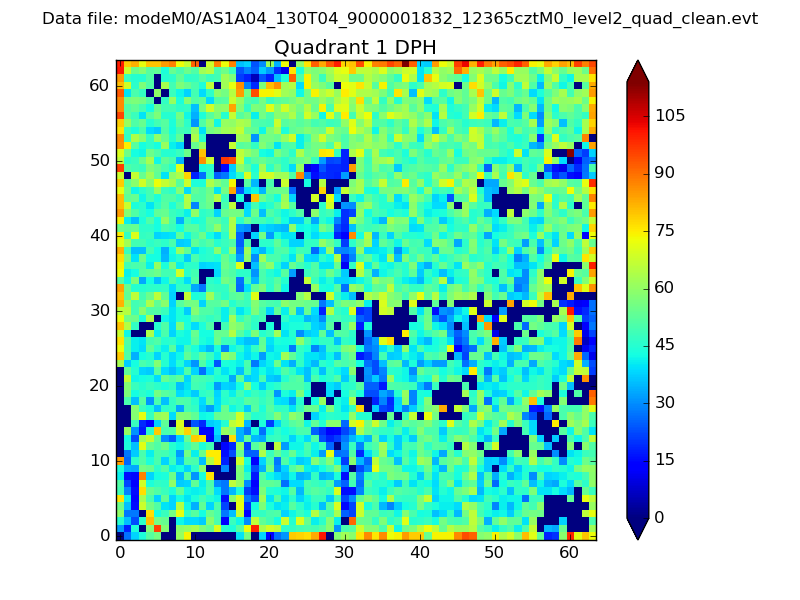 |
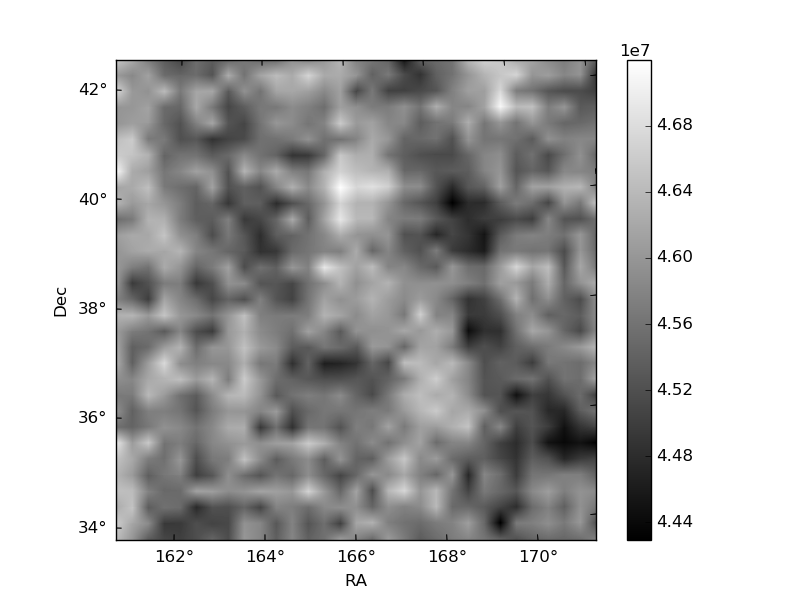
Quadrant B |
|---|---|---|---|
| Quadrant D | 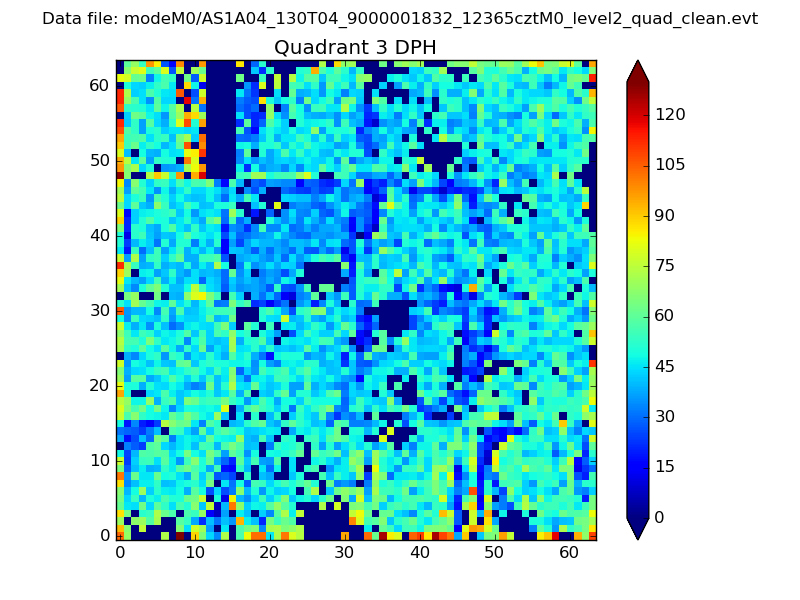 |
 |
Quadrant C |
| Plot type | Count rate plots | Images |
|---|---|---|
| Comparison with Poisson distribution Blue bars denote a histogram of data divided into 1 sec bins. Red curve is a Poisson curve with rate = median count rate of data. |
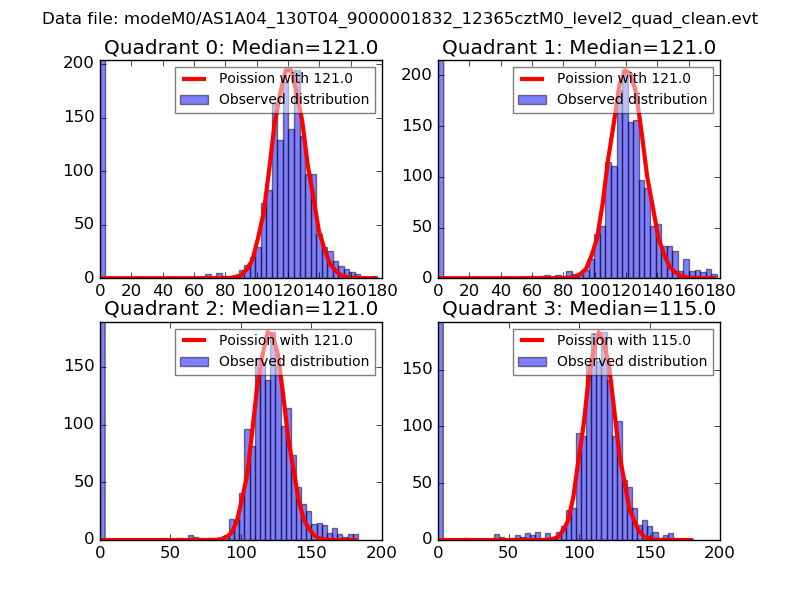 |
 |
| Quadrant-wise count rates Data is divided into 100 sec bins |
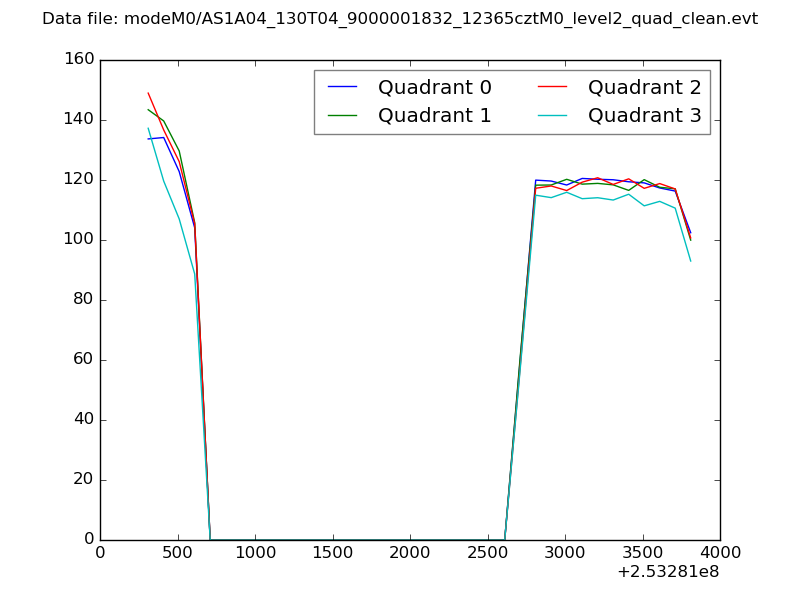 |
|
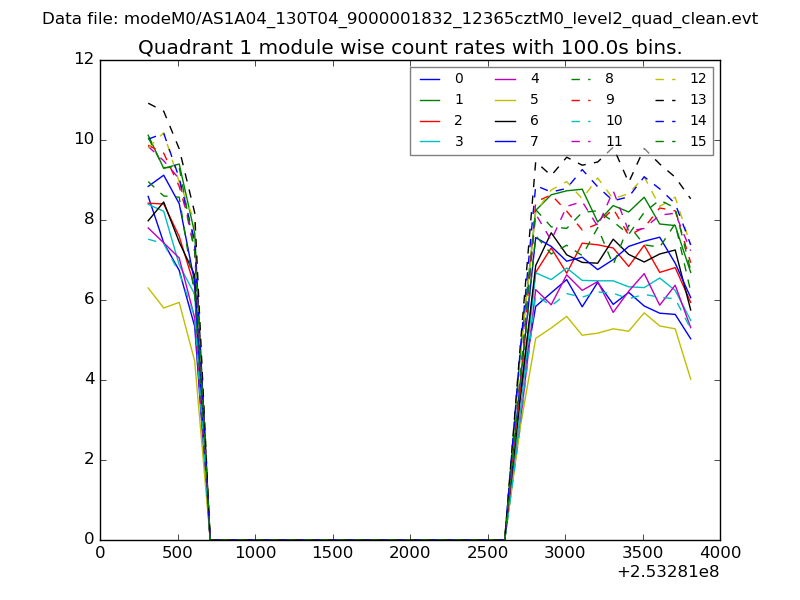
| Module-wise count rates for Quadrant A Data is divided into 100 sec bins |
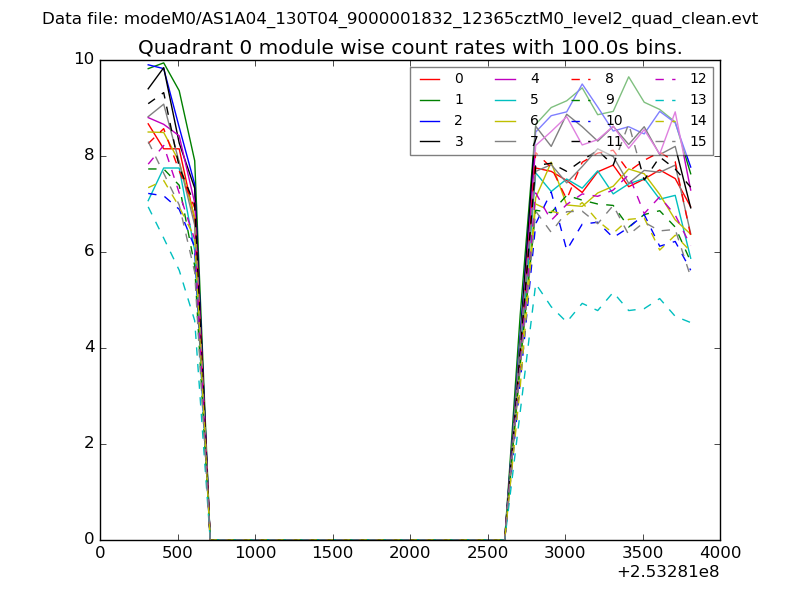 |
 |
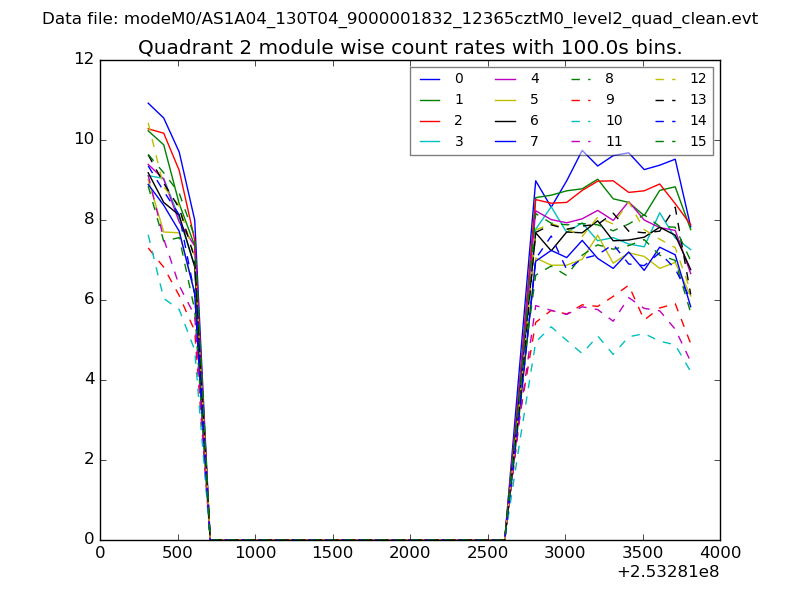
| Module-wise count rates for Quadrant B Data is divided into 100 sec bins |
 |
 |
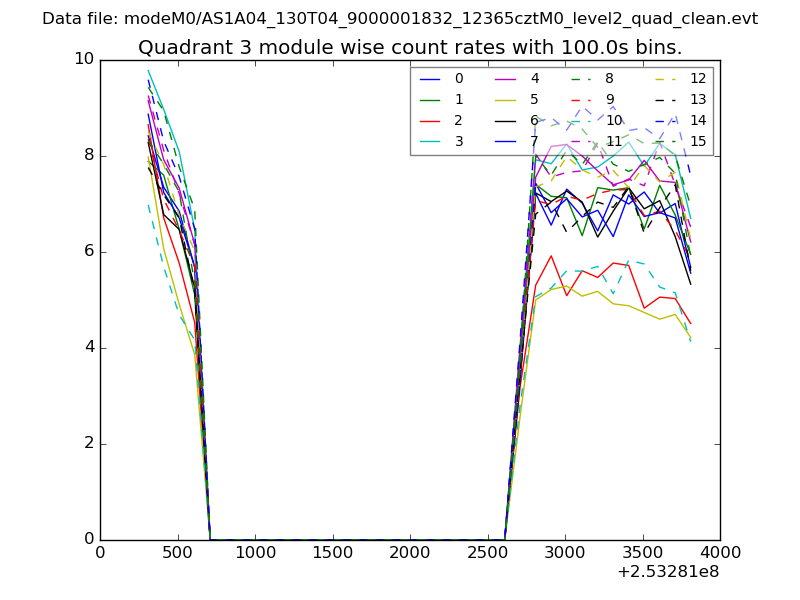
| Module-wise count rates for Quadrant C Data is divided into 100 sec bins |
 |
 |
| Module-wise count rates for Quadrant D Data is divided into 100 sec bins |
 |
 |
| Parameter | Plot |
|---|---|
| CZT HV Monitor | 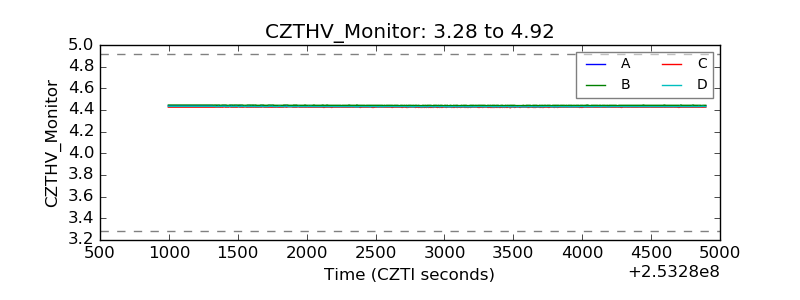 |
| D_VDD | 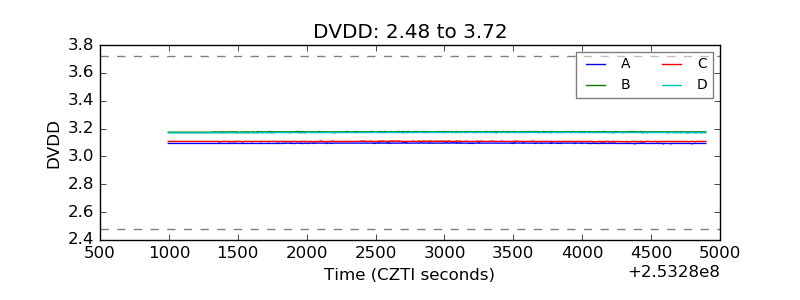 |
| Temperature 1 | 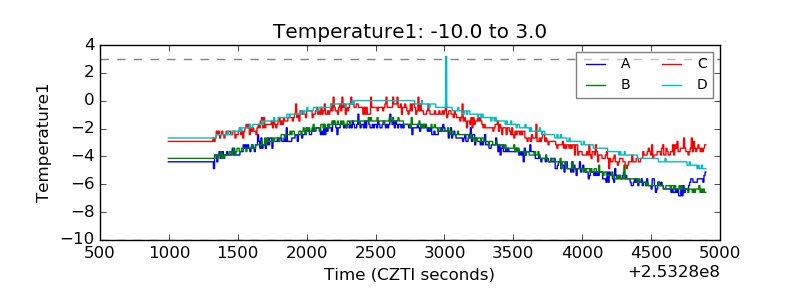 |
| Veto HV Monitor | 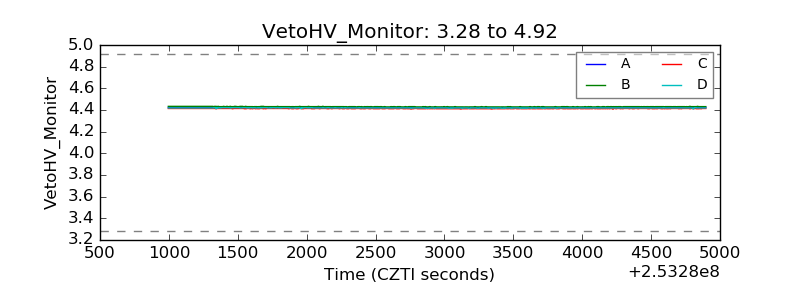 |
| Veto LLD | 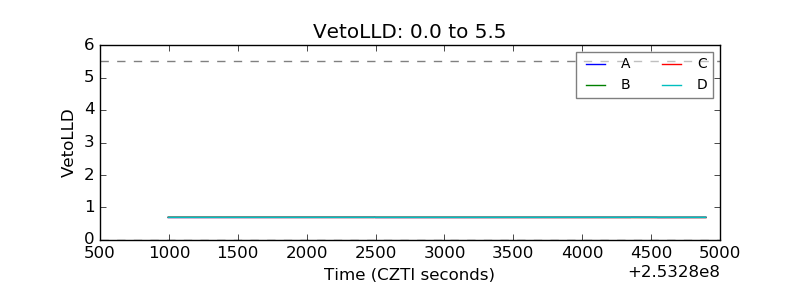 |
| Alpha Counter | 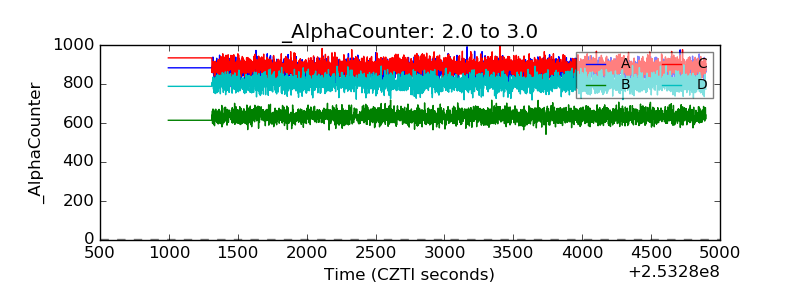 |
| _CPM_Rate | 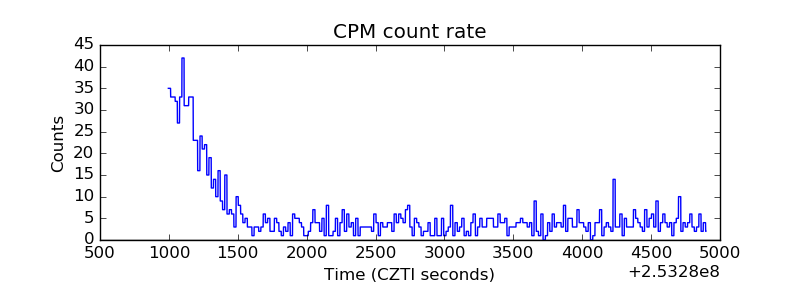 |
| CZT Counter | 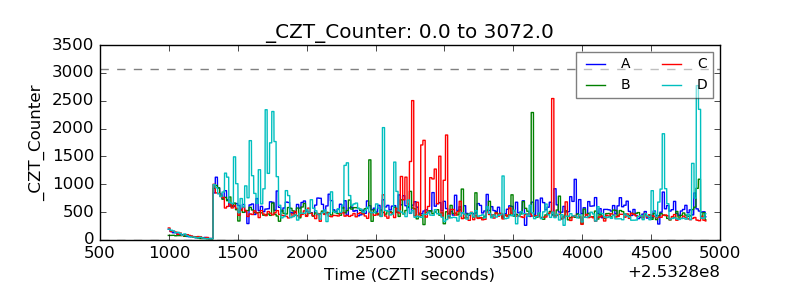 |
| +2.5 Volts monitor |  |
| +5 Volts monitor |  |
| _ROLL_ROT | 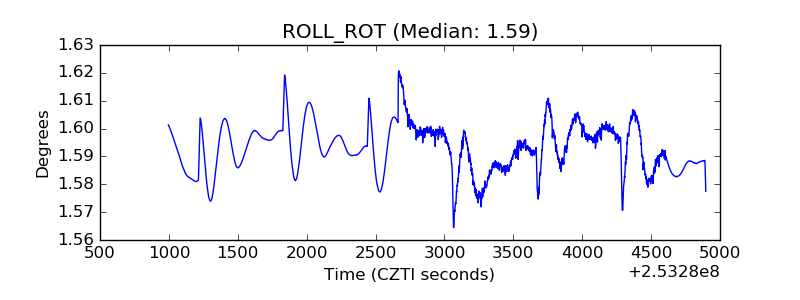 |
| _Roll_DEC | 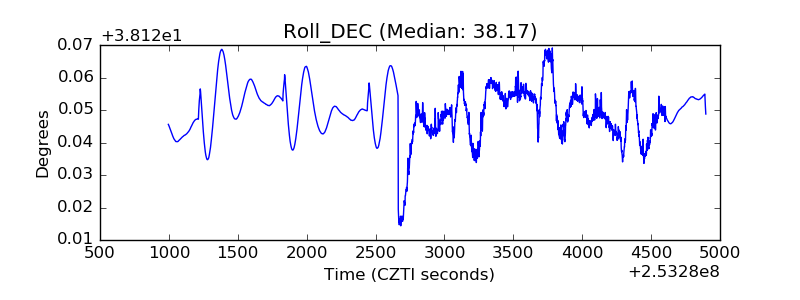 |
| _Roll_RA | 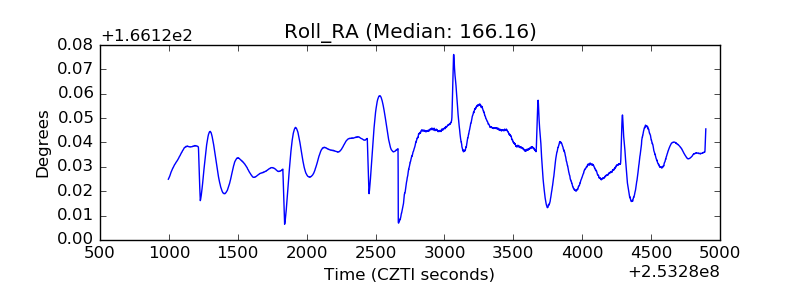 |
| Veto Counter | 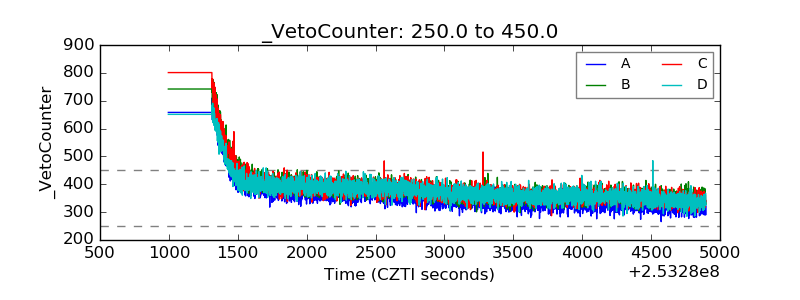 |