| Param | Original file | Final file |
|---|---|---|
| Filename | modeM0/AS1A04_212T01_9000001834_12365cztM0_level2.evt | modeM0/AS1A04_212T01_9000001834_12365cztM0_level2_quad_clean.evt |
| Size (bytes) | 256,314,240 | 63,011,520 |
| Size | 244.4 MB | 60.1 MB |
| Events in quadrant A | 2,102,580 | 420,995 |
| Events in quadrant B | 1,974,324 | 429,428 |
| Events in quadrant C | 1,582,806 | 416,646 |
| Events in quadrant D | 1,867,320 | 397,031 |
| Mode M0 | |||
|---|---|---|---|
| Quadrant | BADHDUFLAG | Total packets | Discarded packets |
| A | 0 | 8573 | 2 |
| B | 0 | 8102 | 1 |
| C | 0 | 7126 | 1 |
| D | 0 | 7969 | 1 |
| Mode M9 | |||
|---|---|---|---|
| Quadrant | BADHDUFLAG | Total packets | Discarded packets |
| A | 0 | 2 | 0 |
| B | 0 | 2 | 0 |
| C | 0 | 2 | 0 |
| D | 0 | 2 | 0 |
| Mode SS | |||
|---|---|---|---|
| Quadrant | BADHDUFLAG | Total packets | Discarded packets |
| A | 0 | 72 | 0 |
| B | 0 | 72 | 0 |
| C | 0 | 72 | 0 |
| D | 0 | 72 | 0 |
| Quadrant | Total seconds | Saturated seconds | Saturation percentage |
|---|---|---|---|
| A | 3438 | 81 | 2.356021% |
| B | 3438 | 78 | 2.268761% |
| C | 3438 | 43 | 1.250727% |
| D | 3438 | 101 | 2.937755% |
Noise dominated data is calculated using 1-second bins in cleaned event files. If a bin has >2000 counts, and if more than 50% of those come from <1% of pixels, then it is considered to be noise-dominated and hence unusable.
| Quadrant | # 1 sec bins | Bins with >0 counts | Bins with >2000 counts | High rate bins dominated by noise | Noise dominated (total time) | Noise dominated (detector-on time) | Marked lightcurve |
|---|---|---|---|---|---|---|---|
| A | 3689 | 3439 | 0 | 0 | 0.00% | 0.00% | 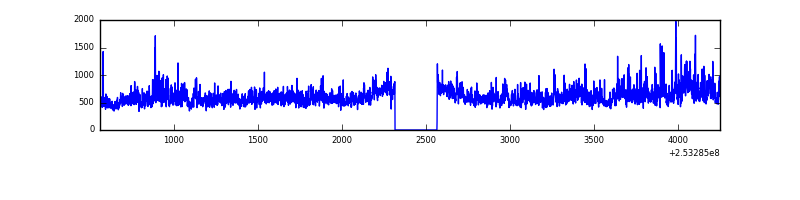 |
| B | 3689 | 3439 | 22 | 22 | 0.60% | 0.64% | 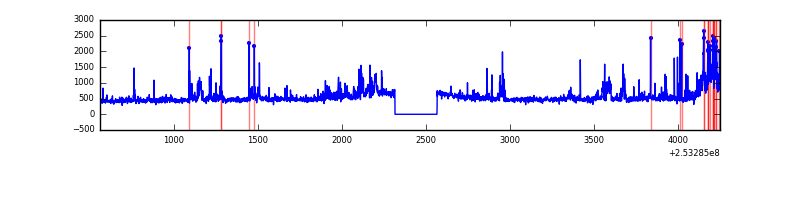 |
| C | 3688 | 3438 | 0 | 0 | 0.00% | 0.00% |  |
| D | 3688 | 3438 | 41 | 41 | 1.11% | 1.19% | 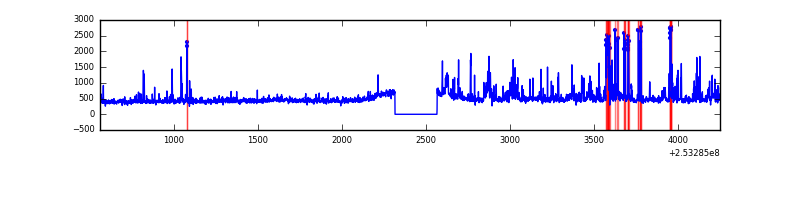 |
Top three noisy pixels from each quadrant. If the there are fewer than three noisy pixels in the level2.evt file, extra rows are filled as -1
| Pixel properties | Quadrant properties | ||||||
|---|---|---|---|---|---|---|---|
| Quadrant | DetID | PixID | Counts | Sigma | Mean | Median | Sigma |
| A | 13 | 251 | 145174 | 1660.55 | 414 | 404 | 87.2 |
| A | 1 | 162 | 130054 | 1487.12 | 414 | 404 | 87.2 |
| A | 1 | 178 | 70162 | 800.14 | 414 | 404 | 87.2 |
| B | 4 | 239 | 259346 | 3248.68 | 412 | 402 | 79.7 |
| B | 10 | 245 | 35894 | 445.28 | 412 | 402 | 79.7 |
| B | 0 | 219 | 23586 | 290.86 | 412 | 402 | 79.7 |
| C | 15 | 208 | 37565 | 403.38 | 393 | 394 | 92.1 |
| C | 8 | 128 | 3473 | 33.41 | 393 | 394 | 92.1 |
| C | 0 | 207 | 3134 | 29.73 | 393 | 394 | 92.1 |
| D | 1 | 52 | 193696 | 2021.63 | 392 | 380 | 95.6 |
| D | 13 | 249 | 46561 | 482.94 | 392 | 380 | 95.6 |
| D | 10 | 199 | 34647 | 358.35 | 392 | 380 | 95.6 |
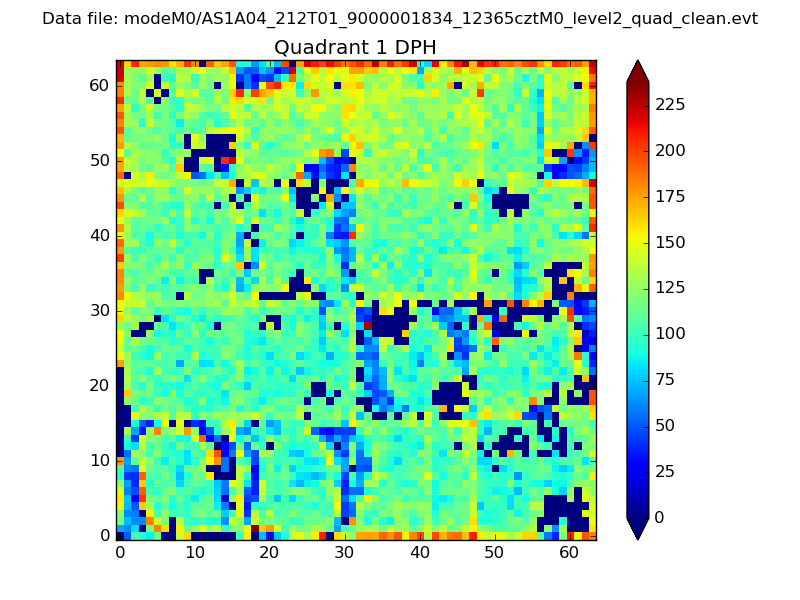
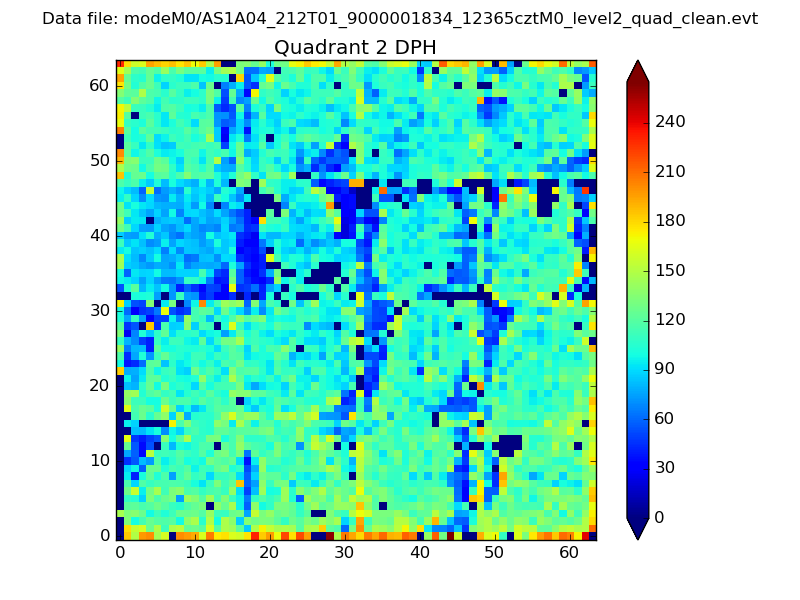
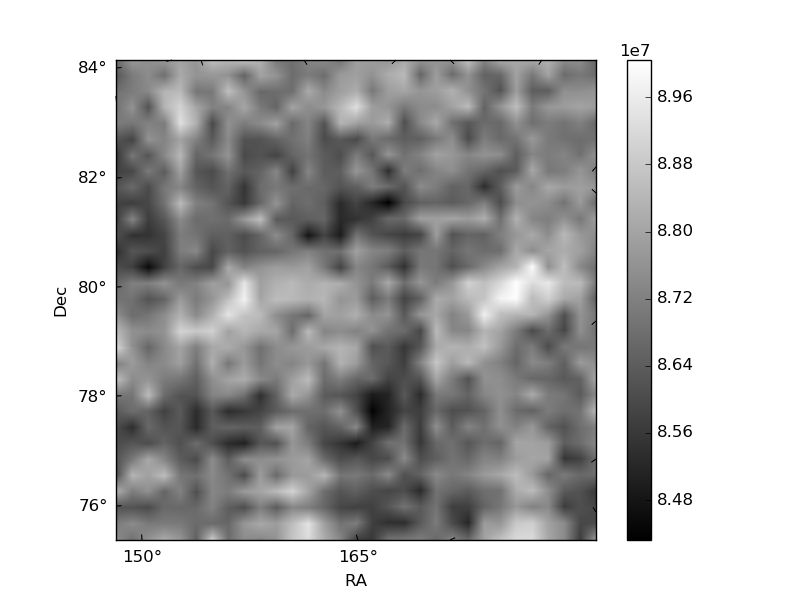
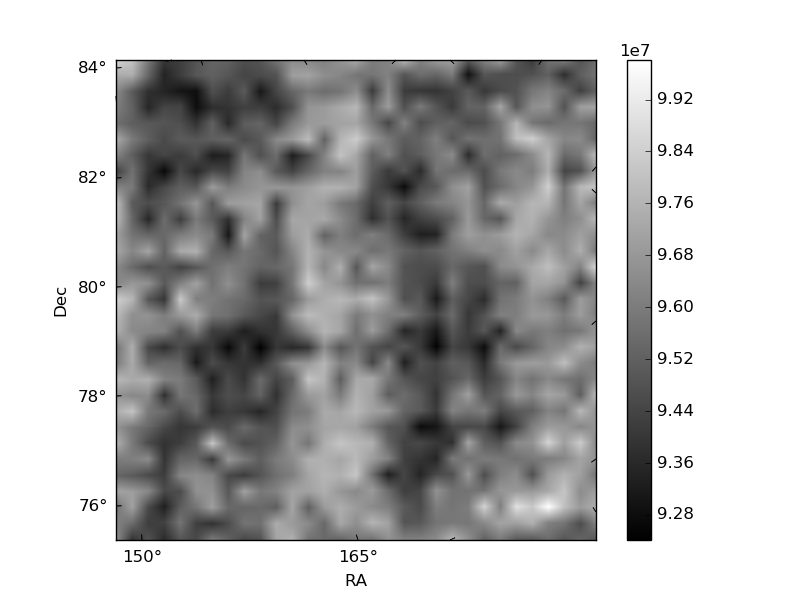
Histogram calculated using DETX and DETY for each event in the final _common_clean file
| Quadrant A | 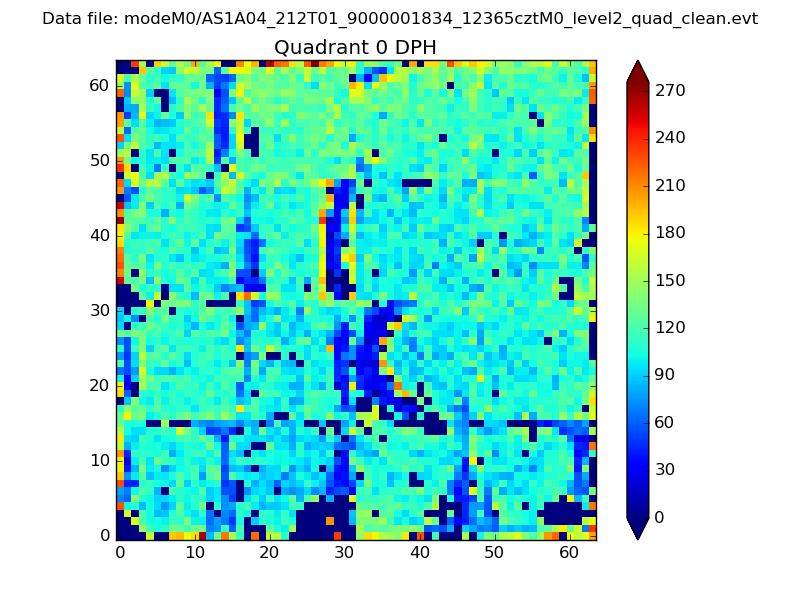 |
 |
Quadrant B |
|---|---|---|---|
| Quadrant D | 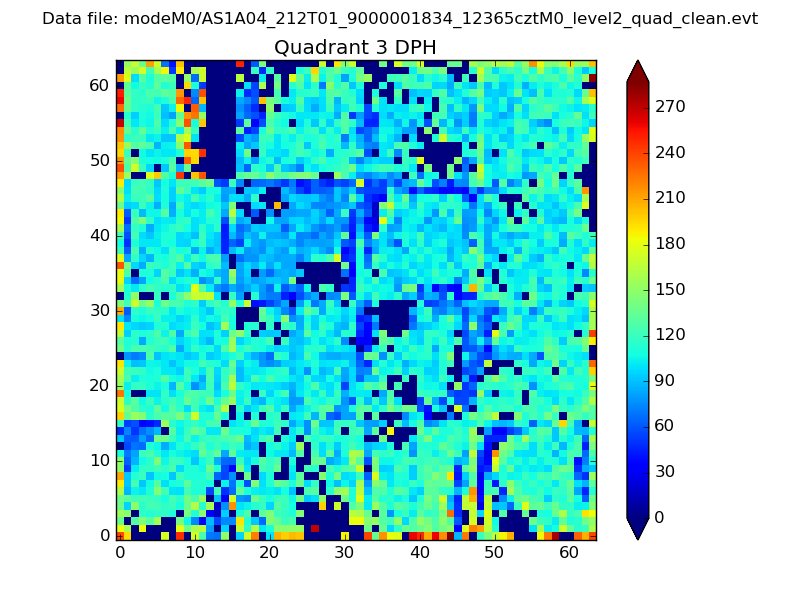 |
 |
Quadrant C |
| Plot type | Count rate plots | Images |
|---|---|---|
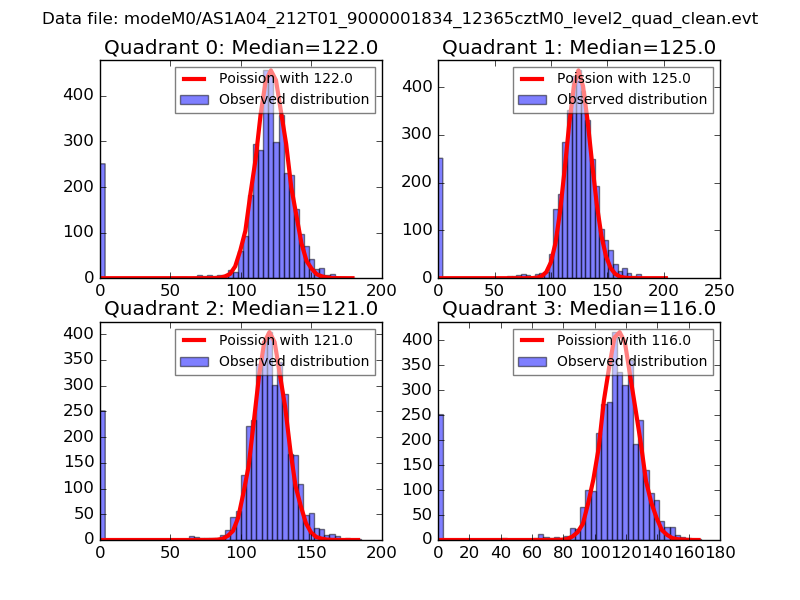
| Comparison with Poisson distribution Blue bars denote a histogram of data divided into 1 sec bins. Red curve is a Poisson curve with rate = median count rate of data. |
 |
 |
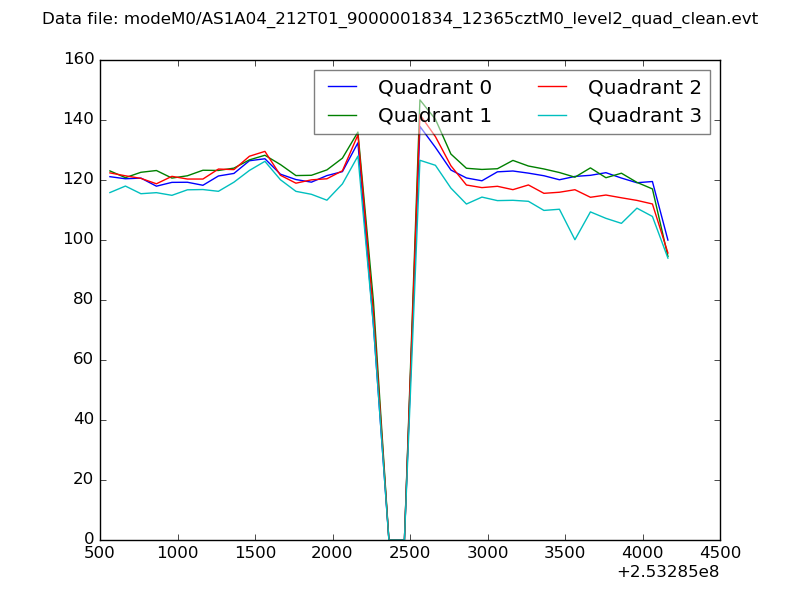
| Quadrant-wise count rates Data is divided into 100 sec bins |
 |
|
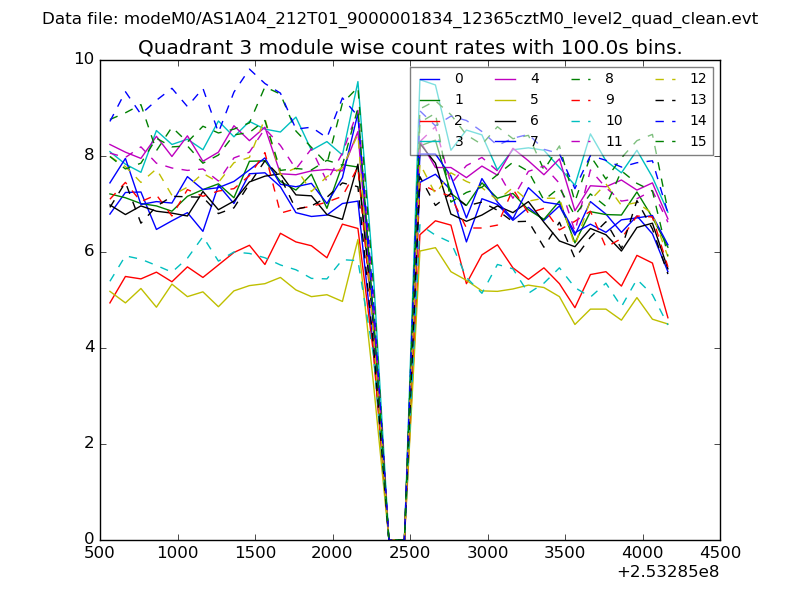
| Module-wise count rates for Quadrant A Data is divided into 100 sec bins |
 |
 |
| Module-wise count rates for Quadrant B Data is divided into 100 sec bins |
 |
 |
| Module-wise count rates for Quadrant C Data is divided into 100 sec bins |
 |
 |
| Module-wise count rates for Quadrant D Data is divided into 100 sec bins |
 |
 |
| Parameter | Plot |
|---|---|
| CZT HV Monitor |  |
| D_VDD | 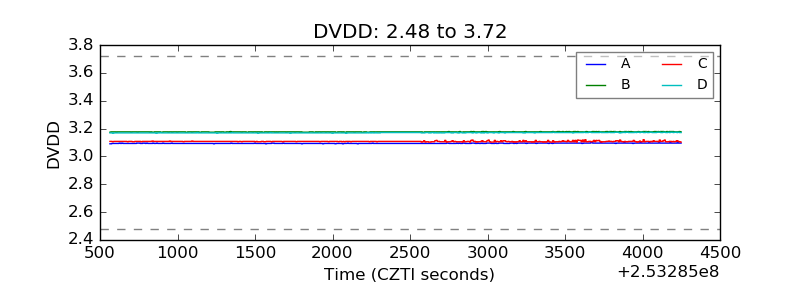 |
| Temperature 1 | 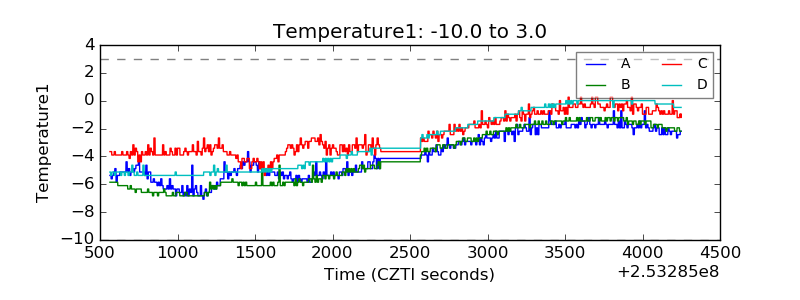 |
| Veto HV Monitor | 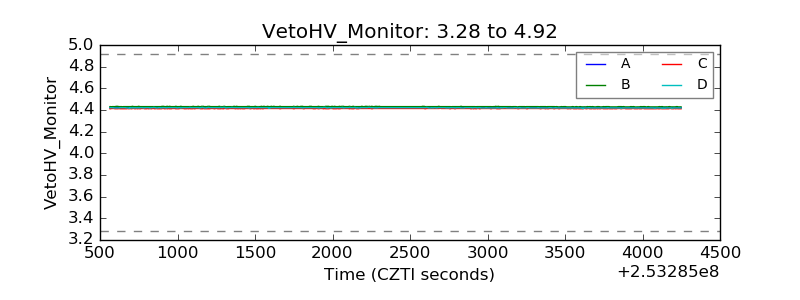 |
| Veto LLD | 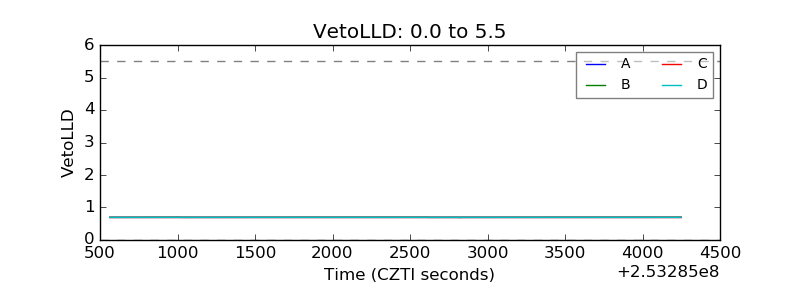 |
| Alpha Counter | 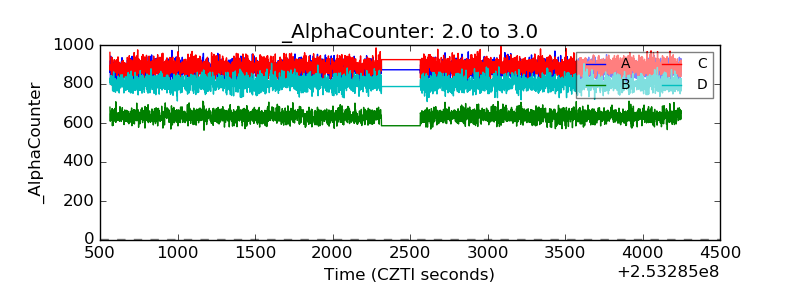 |
| _CPM_Rate | 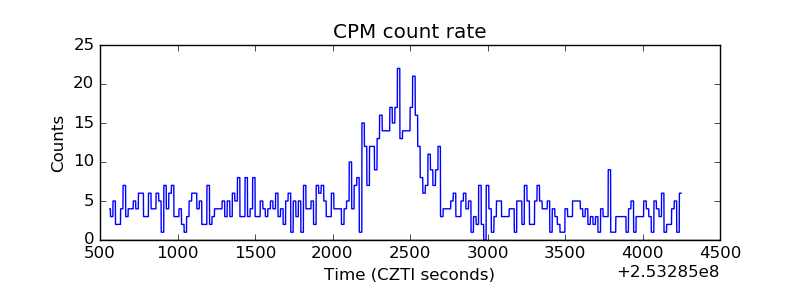 |
| CZT Counter | 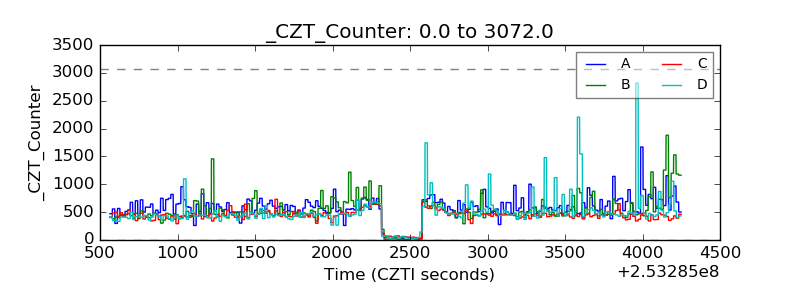 |
| +2.5 Volts monitor |  |
| +5 Volts monitor |  |
| _ROLL_ROT | 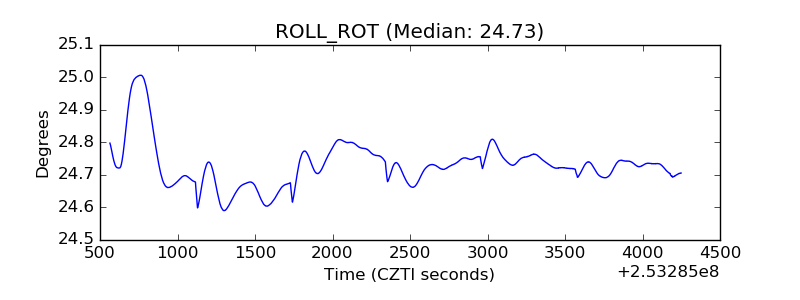 |
| _Roll_DEC | 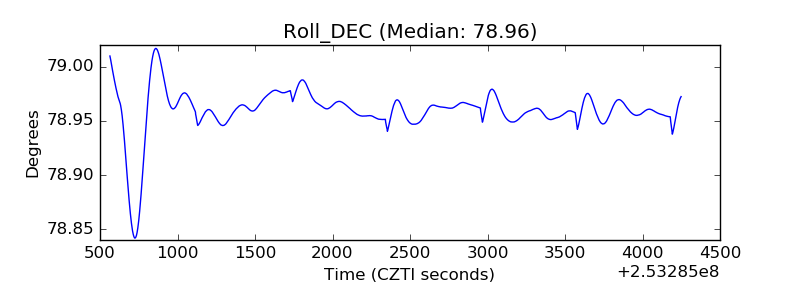 |
| _Roll_RA | 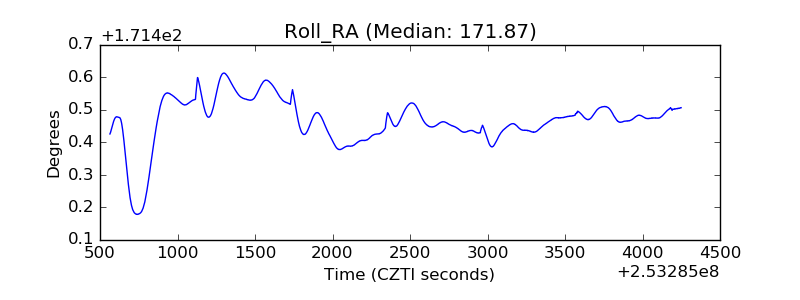 |
| Veto Counter |  |