| Param | Original file | Final file |
|---|---|---|
| Filename | modeM0/AS1A04_212T01_9000001834_12366cztM0_level2.evt | modeM0/AS1A04_212T01_9000001834_12366cztM0_level2_quad_clean.evt |
| Size (bytes) | 538,387,200 | 118,903,680 |
| Size | 513.4 MB | 113.4 MB |
| Events in quadrant A | 4,806,012 | 792,872 |
| Events in quadrant B | 3,842,479 | 808,342 |
| Events in quadrant C | 3,084,008 | 781,879 |
| Events in quadrant D | 4,119,662 | 752,207 |
| Mode M0 | |||
|---|---|---|---|
| Quadrant | BADHDUFLAG | Total packets | Discarded packets |
| A | 0 | 18798 | 2 |
| B | 0 | 15862 | 1 |
| C | 0 | 14032 | 1 |
| D | 0 | 16782 | 1 |
| Mode M9 | |||
|---|---|---|---|
| Quadrant | BADHDUFLAG | Total packets | Discarded packets |
| A | 0 | 4 | 0 |
| B | 0 | 4 | 0 |
| C | 0 | 4 | 0 |
| D | 0 | 4 | 0 |
| Mode SS | |||
|---|---|---|---|
| Quadrant | BADHDUFLAG | Total packets | Discarded packets |
| A | 0 | 134 | 0 |
| B | 0 | 134 | 0 |
| C | 0 | 134 | 0 |
| D | 0 | 134 | 0 |
| Quadrant | Total seconds | Saturated seconds | Saturation percentage |
|---|---|---|---|
| A | 6686 | 257 | 3.843853% |
| B | 6686 | 118 | 1.764882% |
| C | 6686 | 53 | 0.792701% |
| D | 6686 | 202 | 3.021238% |
Noise dominated data is calculated using 1-second bins in cleaned event files. If a bin has >2000 counts, and if more than 50% of those come from <1% of pixels, then it is considered to be noise-dominated and hence unusable.
| Quadrant | # 1 sec bins | Bins with >0 counts | Bins with >2000 counts | High rate bins dominated by noise | Noise dominated (total time) | Noise dominated (detector-on time) | Marked lightcurve |
|---|---|---|---|---|---|---|---|
| A | 7027 | 6687 | 41 | 41 | 0.58% | 0.61% | 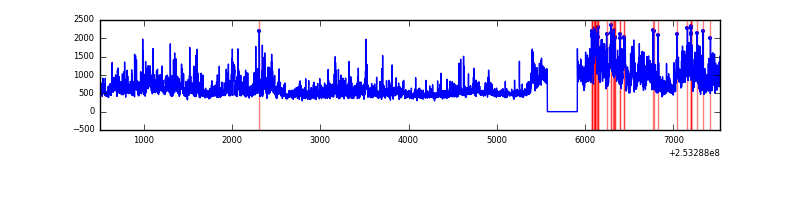 |
| B | 7027 | 6687 | 48 | 48 | 0.68% | 0.72% | 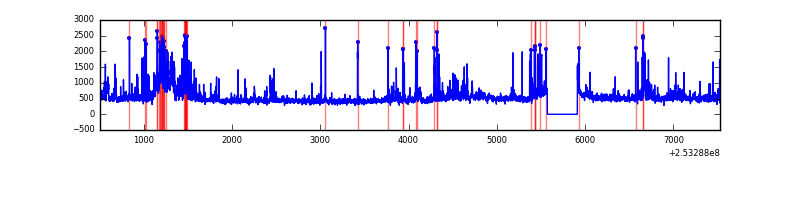 |
| C | 7026 | 6686 | 16 | 16 | 0.23% | 0.24% | 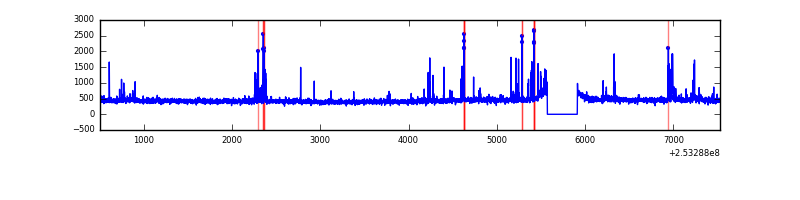 |
| D | 7027 | 6687 | 178 | 178 | 2.53% | 2.66% | 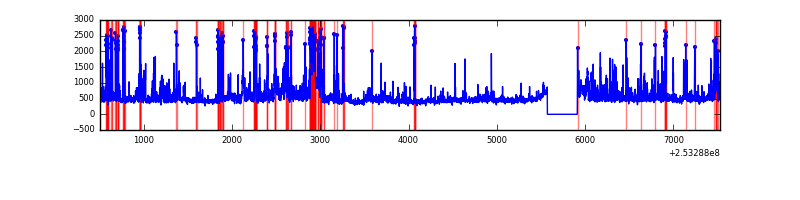 |
Top three noisy pixels from each quadrant. If the there are fewer than three noisy pixels in the level2.evt file, extra rows are filled as -1
| Pixel properties | Quadrant properties | ||||||
|---|---|---|---|---|---|---|---|
| Quadrant | DetID | PixID | Counts | Sigma | Mean | Median | Sigma |
| A | 8 | 15 | 814849 | 5259.45 | 758 | 740 | 154.8 |
| A | 13 | 251 | 573589 | 3700.82 | 758 | 740 | 154.8 |
| A | 1 | 162 | 202066 | 1300.64 | 758 | 740 | 154.8 |
| B | 4 | 239 | 471818 | 3255.98 | 762 | 744 | 144.7 |
| B | 10 | 245 | 157057 | 1080.41 | 762 | 744 | 144.7 |
| B | 0 | 85 | 64985 | 444.02 | 762 | 744 | 144.7 |
| C | 15 | 208 | 157233 | 922.72 | 735 | 736 | 169.6 |
| C | 14 | 234 | 45852 | 266.01 | 735 | 736 | 169.6 |
| C | 8 | 128 | 5741 | 29.51 | 735 | 736 | 169.6 |
| D | 1 | 52 | 566089 | 3206.87 | 732 | 709 | 176.3 |
| D | 13 | 104 | 473092 | 2679.39 | 732 | 709 | 176.3 |
| D | 1 | 7 | 83130 | 467.5 | 732 | 709 | 176.3 |
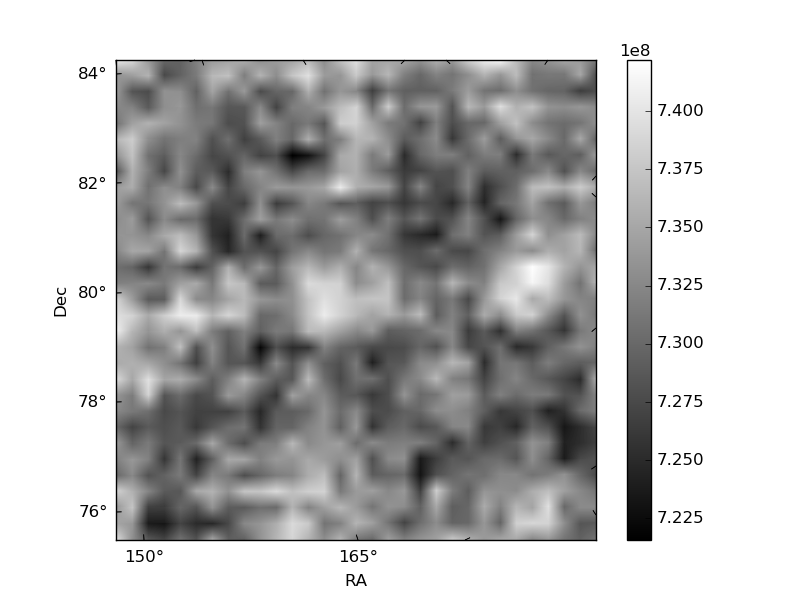
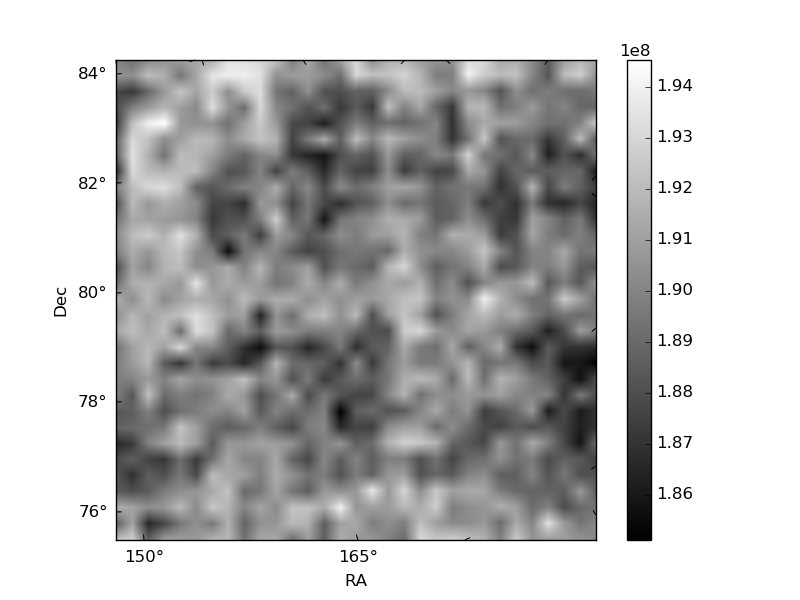
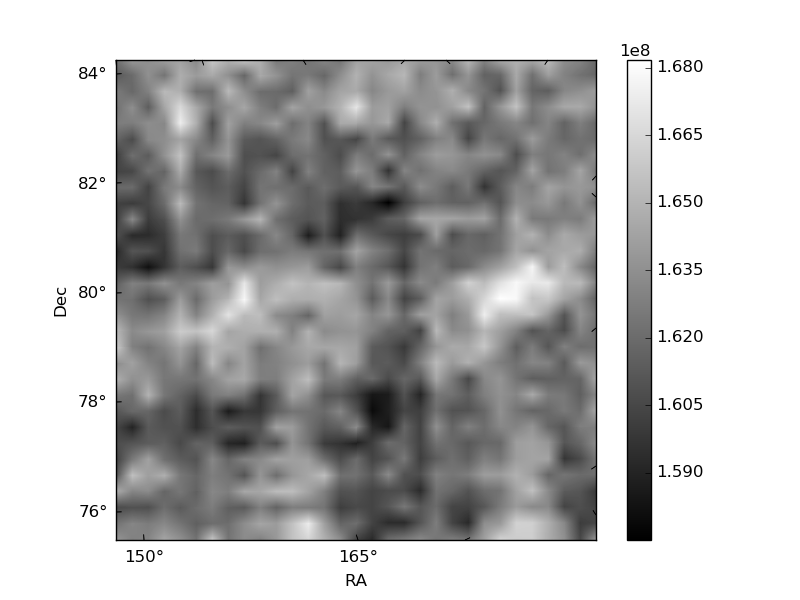
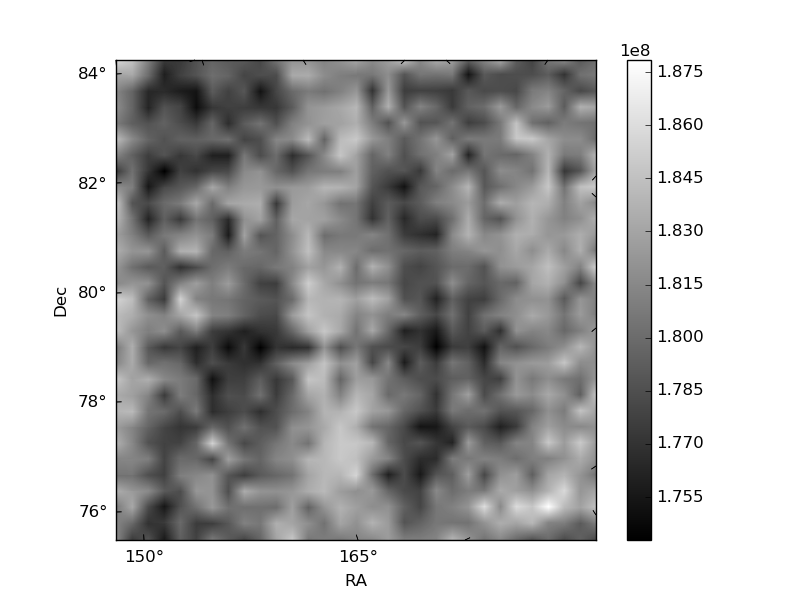
Histogram calculated using DETX and DETY for each event in the final _common_clean file
| Quadrant A | 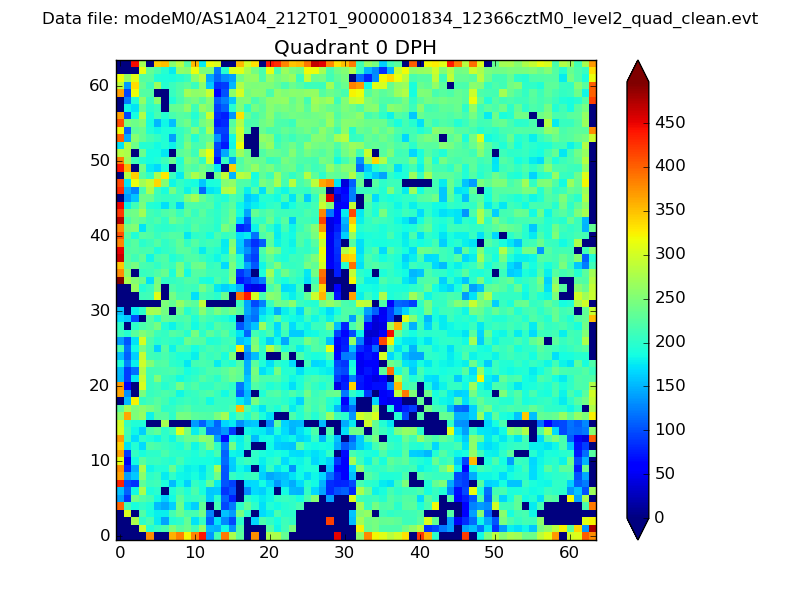 |
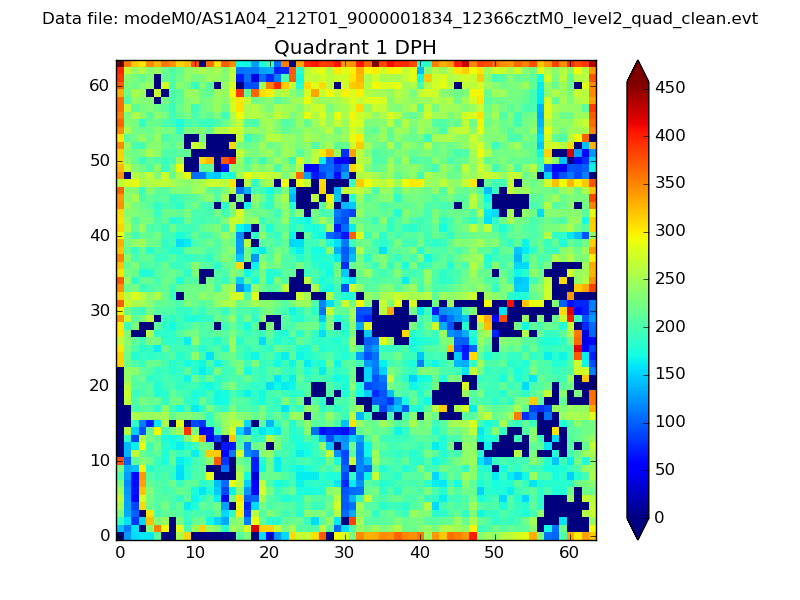 |
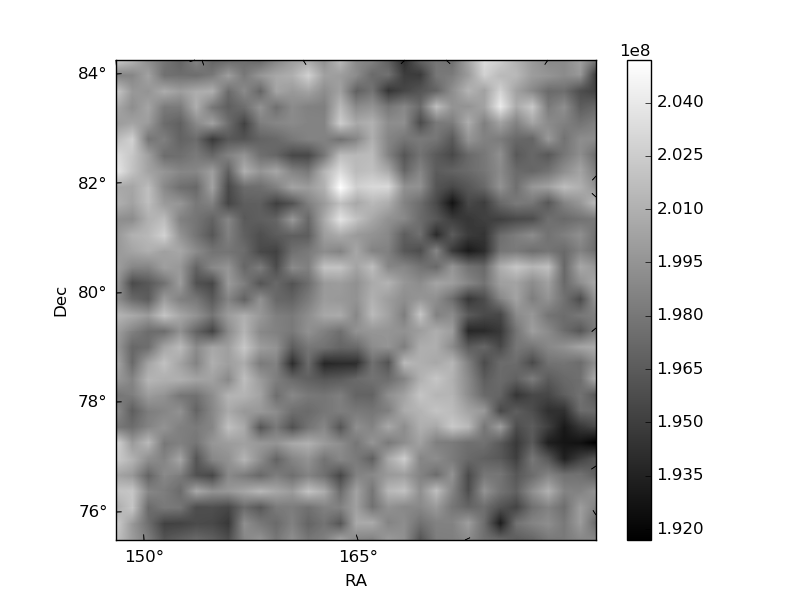
Quadrant B |
|---|---|---|---|
| Quadrant D | 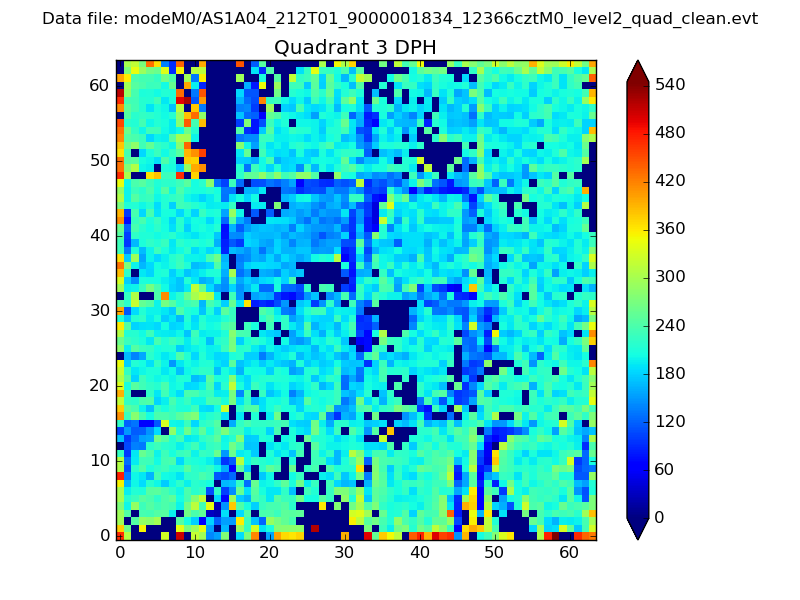 |
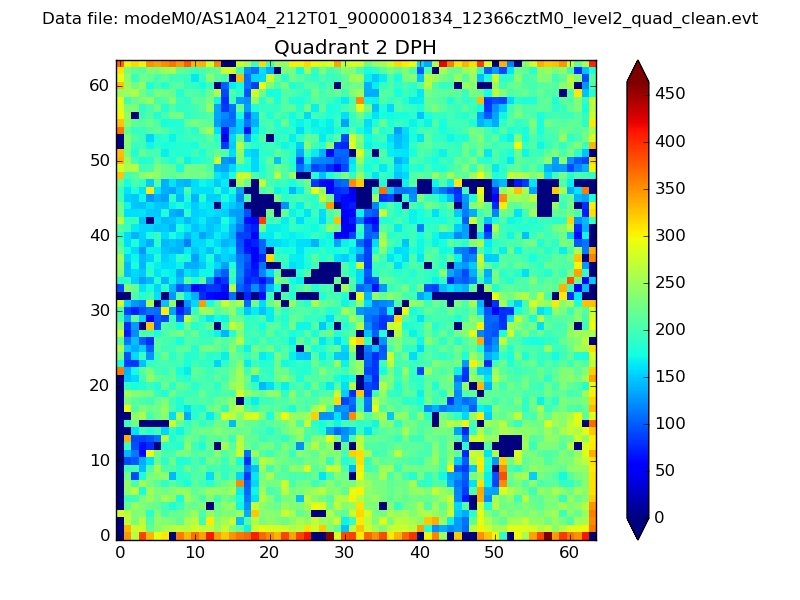 |
Quadrant C |
| Plot type | Count rate plots | Images |
|---|---|---|
| Comparison with Poisson distribution Blue bars denote a histogram of data divided into 1 sec bins. Red curve is a Poisson curve with rate = median count rate of data. |
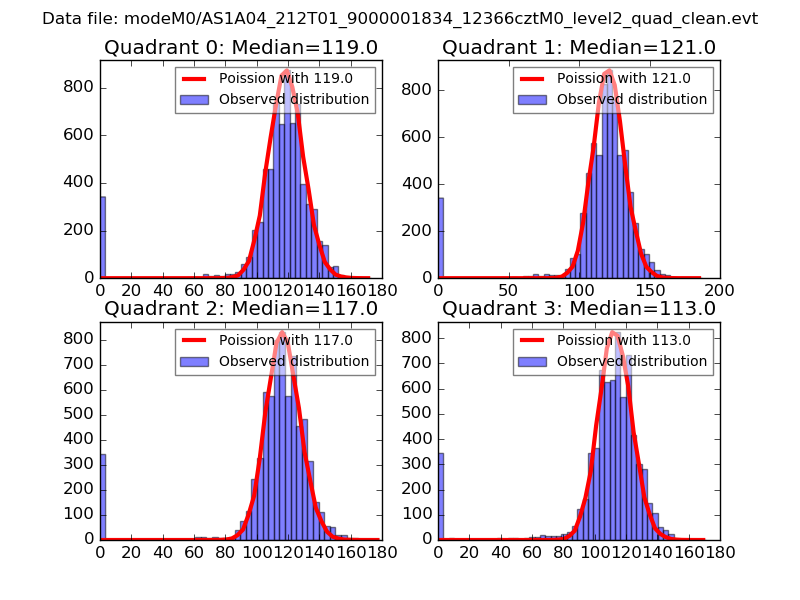 |
 |
| Quadrant-wise count rates Data is divided into 100 sec bins |
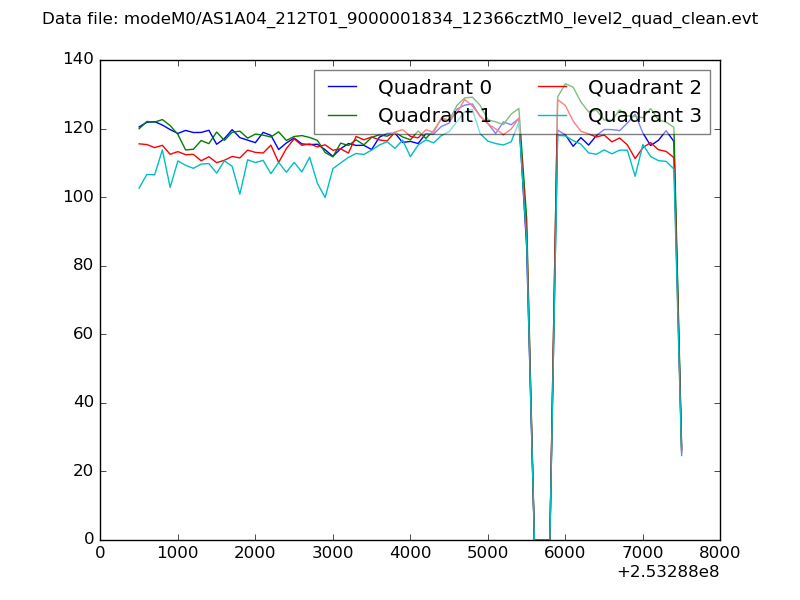 |
|
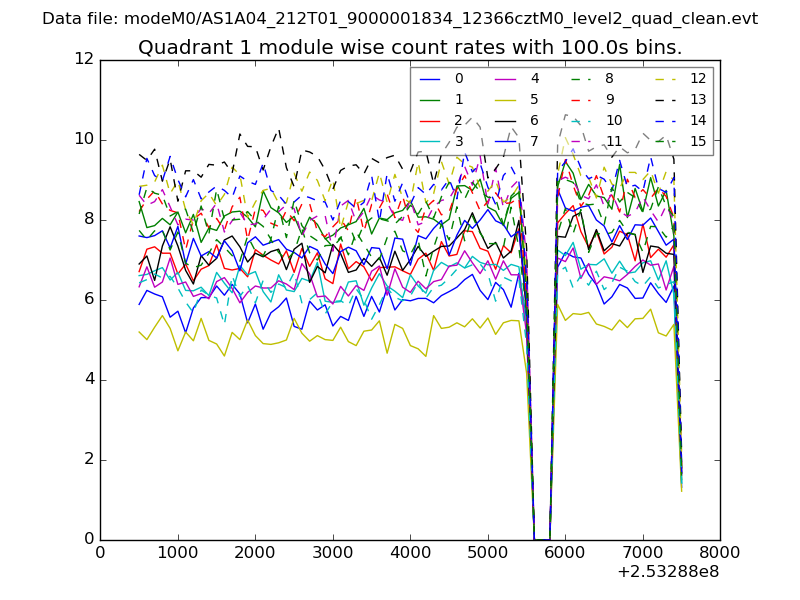
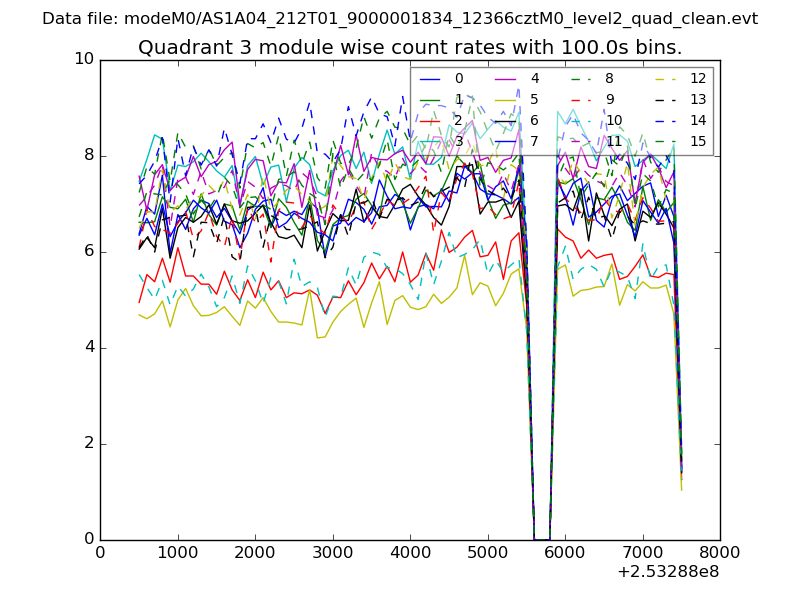
| Module-wise count rates for Quadrant A Data is divided into 100 sec bins |
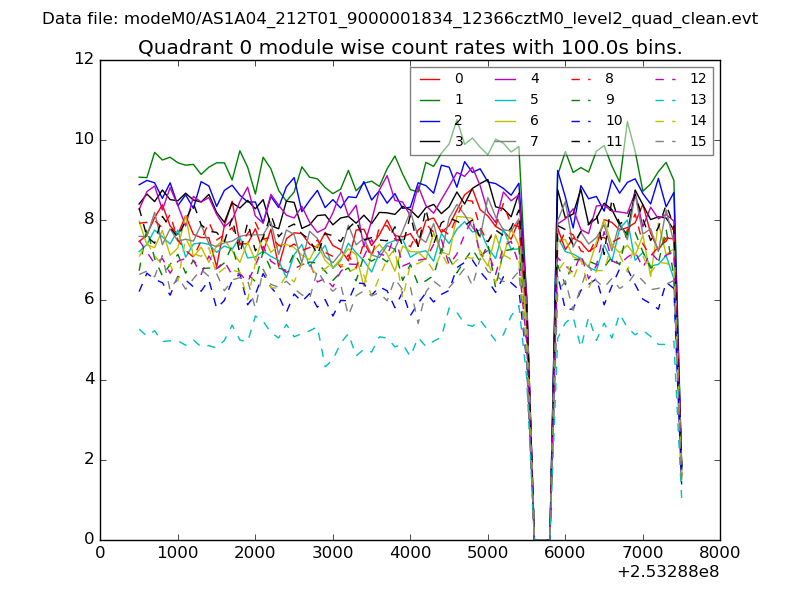 |
 |
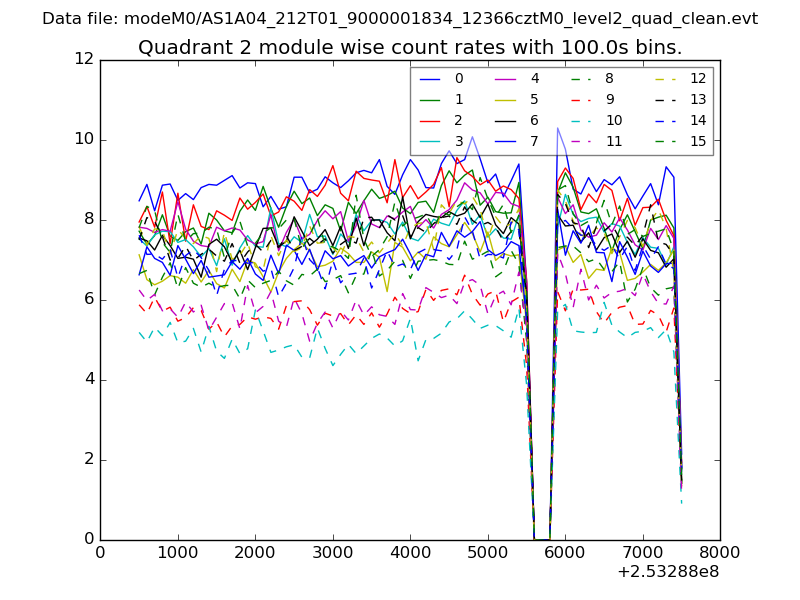
| Module-wise count rates for Quadrant B Data is divided into 100 sec bins |
 |
 |
| Module-wise count rates for Quadrant C Data is divided into 100 sec bins |
 |
 |
| Module-wise count rates for Quadrant D Data is divided into 100 sec bins |
 |
 |
| Parameter | Plot |
|---|---|
| CZT HV Monitor |  |
| D_VDD | 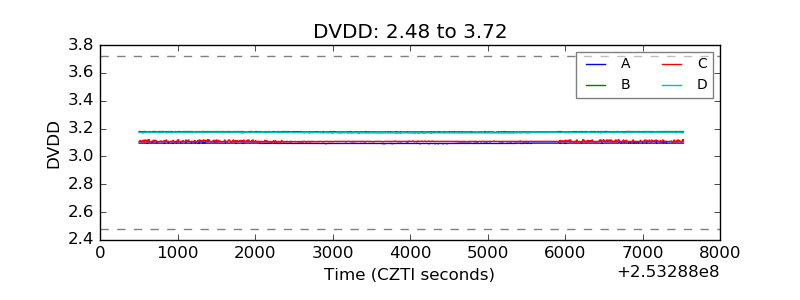 |
| Temperature 1 |  |
| Veto HV Monitor | 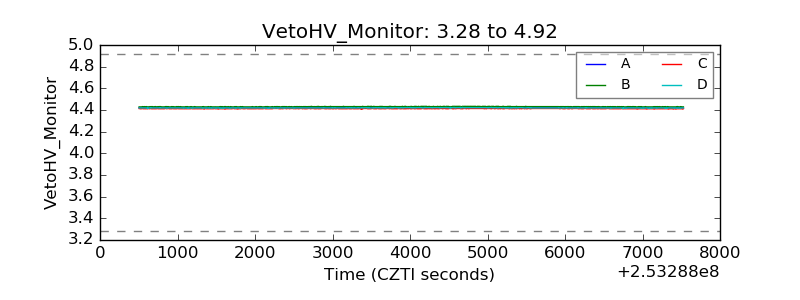 |
| Veto LLD |  |
| Alpha Counter | 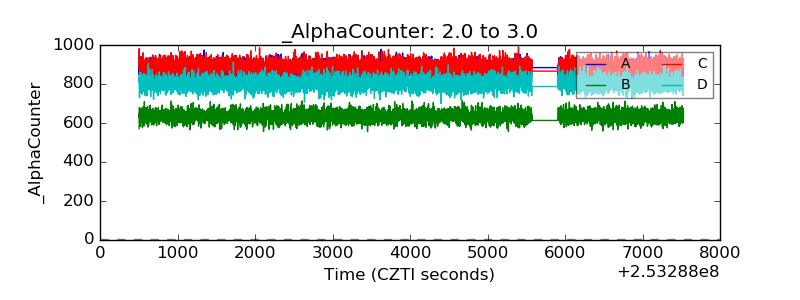 |
| _CPM_Rate | 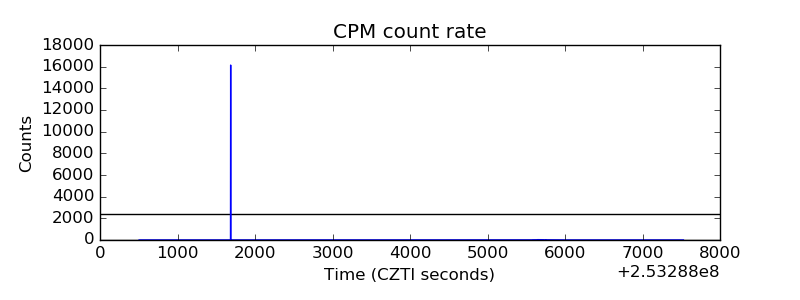 |
| CZT Counter | 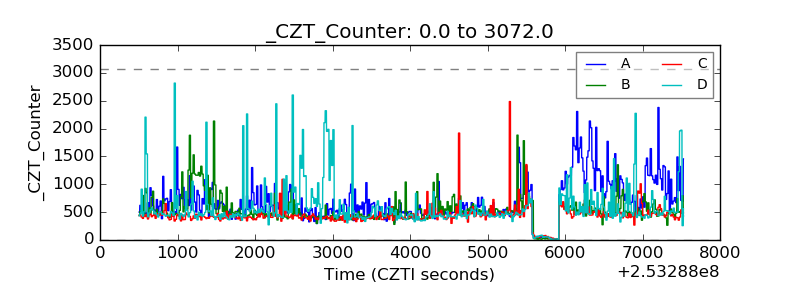 |
| +2.5 Volts monitor |  |
| +5 Volts monitor |  |
| _ROLL_ROT | 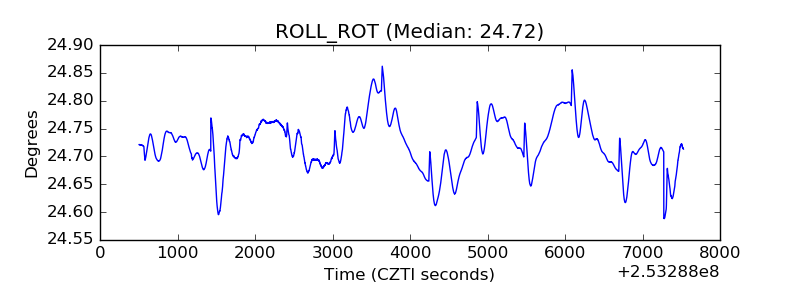 |
| _Roll_DEC | 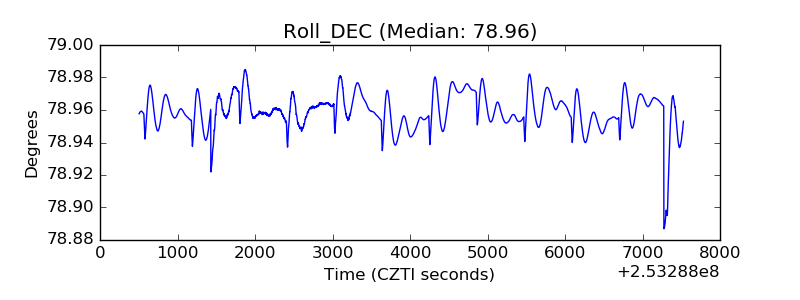 |
| _Roll_RA | 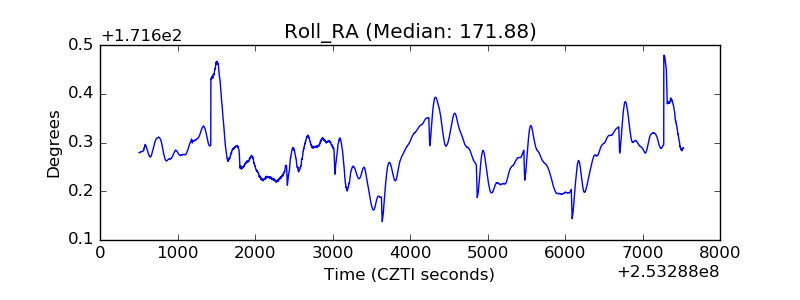 |
| Veto Counter | 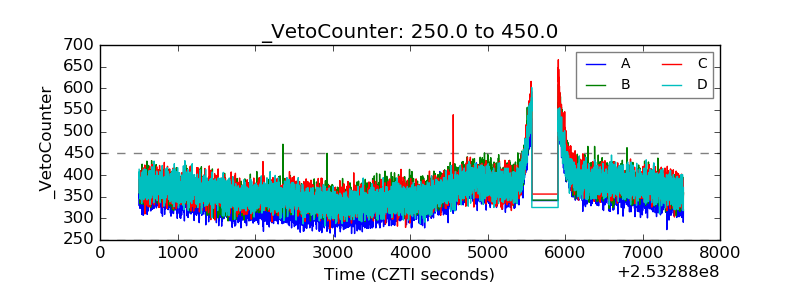 |