| Param | Original file | Final file |
|---|---|---|
| Filename | modeM0/AS1A04_212T01_9000001834_12369cztM0_level2.evt | modeM0/AS1A04_212T01_9000001834_12369cztM0_level2_quad_clean.evt |
| Size (bytes) | 202,086,720 | 40,752,000 |
| Size | 192.7 MB | 38.9 MB |
| Events in quadrant A | 2,005,135 | 270,498 |
| Events in quadrant B | 1,169,984 | 278,651 |
| Events in quadrant C | 1,226,435 | 262,413 |
| Events in quadrant D | 1,557,936 | 253,745 |
| Mode M0 | |||
|---|---|---|---|
| Quadrant | BADHDUFLAG | Total packets | Discarded packets |
| A | 0 | 7571 | 0 |
| B | 0 | 5061 | 0 |
| C | 0 | 5302 | 0 |
| D | 0 | 6195 | 0 |
| Mode SS | |||
|---|---|---|---|
| Quadrant | BADHDUFLAG | Total packets | Discarded packets |
| A | 0 | 48 | 0 |
| B | 0 | 48 | 0 |
| C | 0 | 48 | 0 |
| D | 0 | 48 | 0 |
| Quadrant | Total seconds | Saturated seconds | Saturation percentage |
|---|---|---|---|
| A | 2333 | 83 | 3.557651% |
| B | 2333 | 10 | 0.428633% |
| C | 2333 | 60 | 2.571796% |
| D | 2333 | 94 | 4.029147% |
Noise dominated data is calculated using 1-second bins in cleaned event files. If a bin has >2000 counts, and if more than 50% of those come from <1% of pixels, then it is considered to be noise-dominated and hence unusable.
| Quadrant | # 1 sec bins | Bins with >0 counts | Bins with >2000 counts | High rate bins dominated by noise | Noise dominated (total time) | Noise dominated (detector-on time) | Marked lightcurve |
|---|---|---|---|---|---|---|---|
| A | 2333 | 2333 | 62 | 62 | 2.66% | 2.66% | 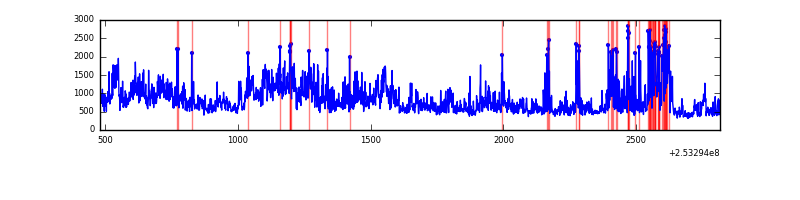 |
| B | 2333 | 2333 | 3 | 3 | 0.13% | 0.13% | 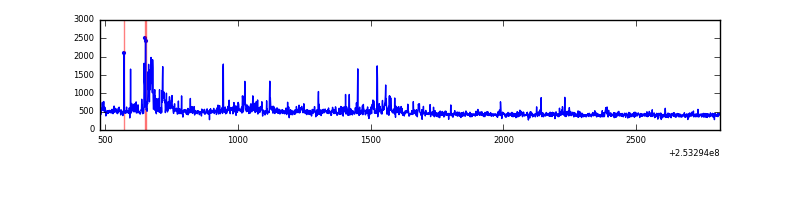 |
| C | 2334 | 2334 | 50 | 50 | 2.14% | 2.14% |  |
| D | 2334 | 2334 | 85 | 85 | 3.64% | 3.64% | 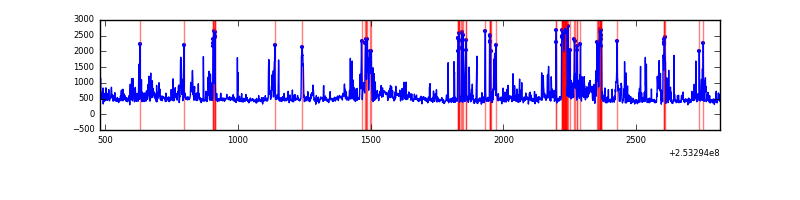 |
Top three noisy pixels from each quadrant. If the there are fewer than three noisy pixels in the level2.evt file, extra rows are filled as -1
| Pixel properties | Quadrant properties | ||||||
|---|---|---|---|---|---|---|---|
| Quadrant | DetID | PixID | Counts | Sigma | Mean | Median | Sigma |
| A | 8 | 15 | 601183 | 11221.41 | 254 | 248 | 53.6 |
| A | 13 | 251 | 294105 | 5487.27 | 254 | 248 | 53.6 |
| A | 1 | 162 | 46175 | 857.61 | 254 | 248 | 53.6 |
| B | 4 | 239 | 107841 | 2127.5 | 259 | 252 | 50.6 |
| B | 10 | 245 | 14251 | 276.82 | 259 | 252 | 50.6 |
| B | 0 | 219 | 8617 | 165.41 | 259 | 252 | 50.6 |
| C | 15 | 208 | 232500 | 3889.77 | 250 | 252 | 59.7 |
| C | 14 | 234 | 10221 | 166.96 | 250 | 252 | 59.7 |
| C | 8 | 128 | 3145 | 48.45 | 250 | 252 | 59.7 |
| D | 1 | 52 | 402628 | 6427.53 | 249 | 241 | 62.6 |
| D | 13 | 104 | 85689 | 1364.9 | 249 | 241 | 62.6 |
| D | 5 | 222 | 74916 | 1192.82 | 249 | 241 | 62.6 |
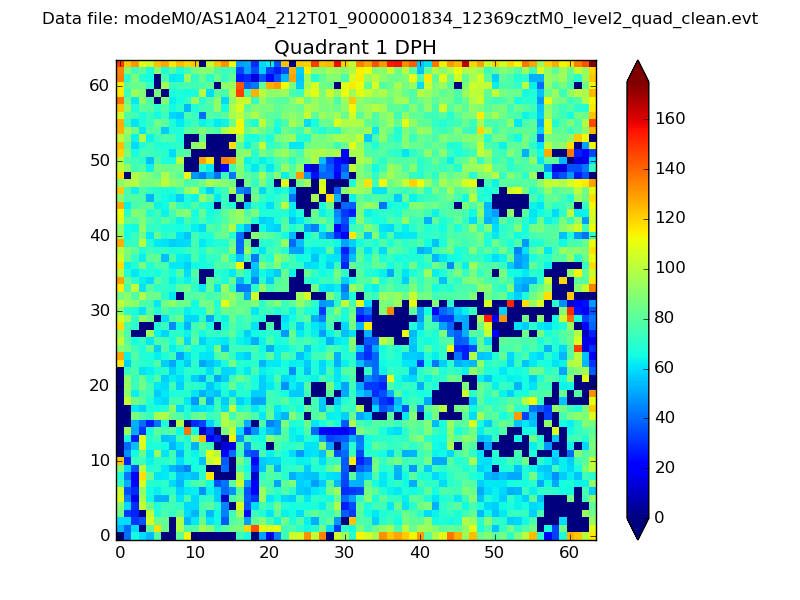
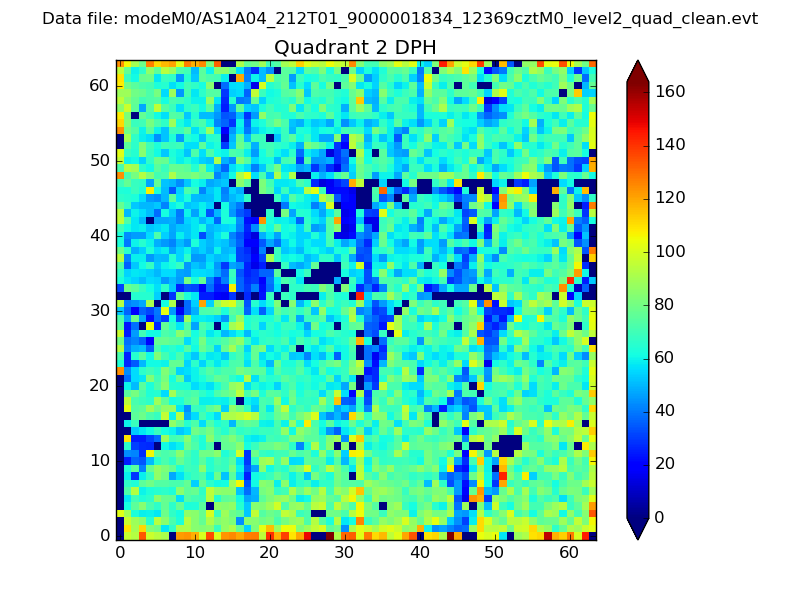
Histogram calculated using DETX and DETY for each event in the final _common_clean file
| Quadrant A | 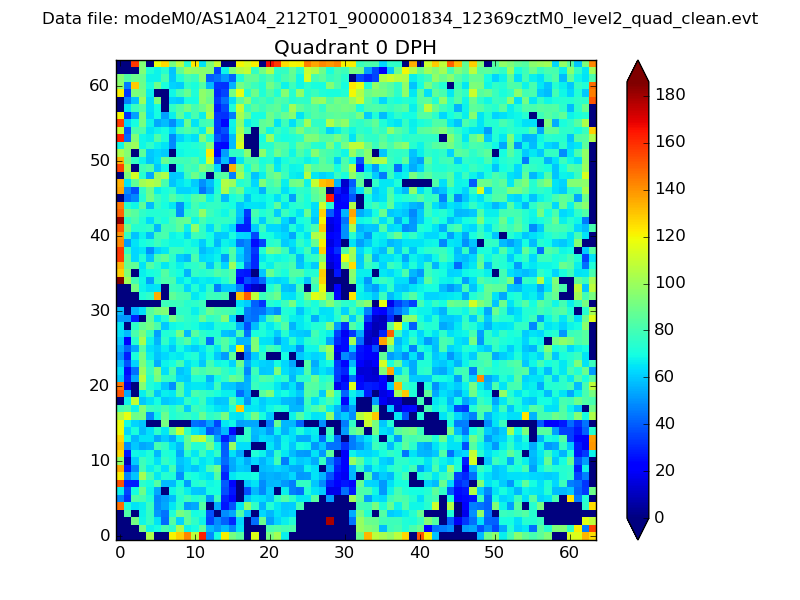 |
 |
Quadrant B |
|---|---|---|---|
| Quadrant D |  |
 |
Quadrant C |
| Plot type | Count rate plots | Images |
|---|---|---|
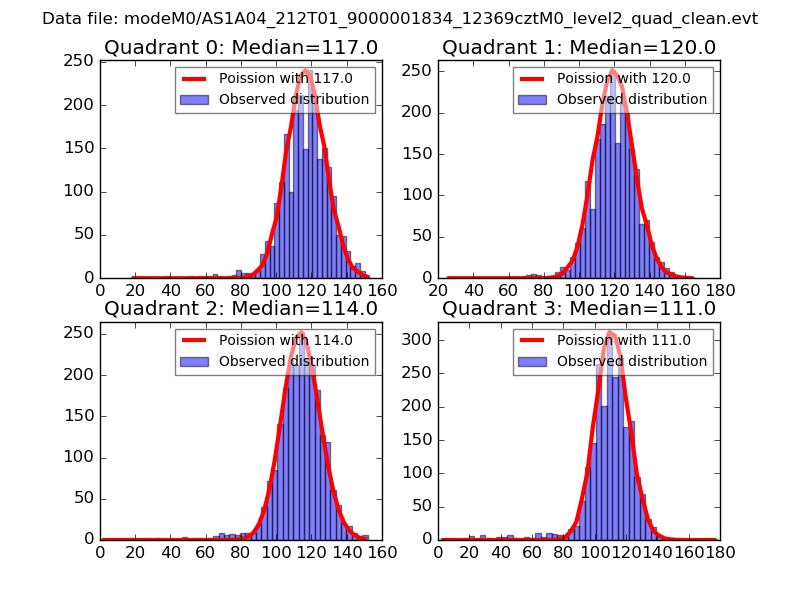
| Comparison with Poisson distribution Blue bars denote a histogram of data divided into 1 sec bins. Red curve is a Poisson curve with rate = median count rate of data. |
 |
 |
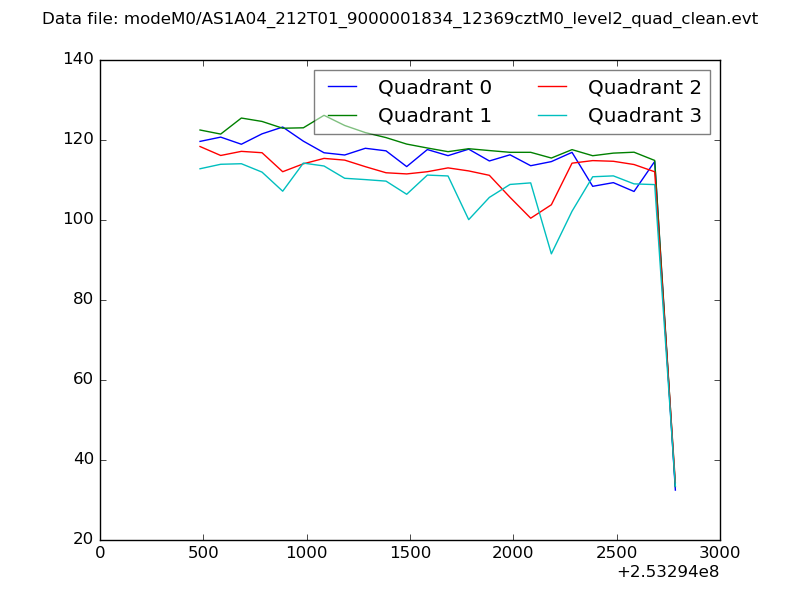
| Quadrant-wise count rates Data is divided into 100 sec bins |
 |
|
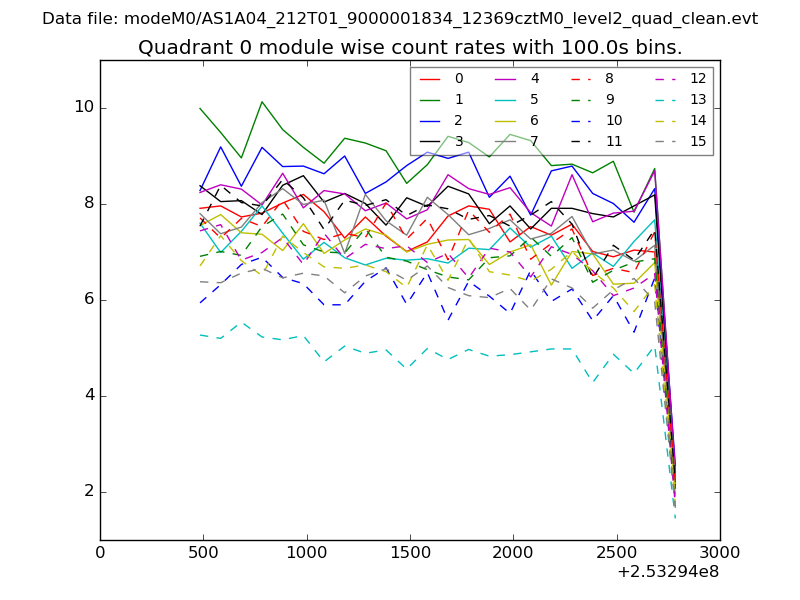
| Module-wise count rates for Quadrant A Data is divided into 100 sec bins |
 |
 |
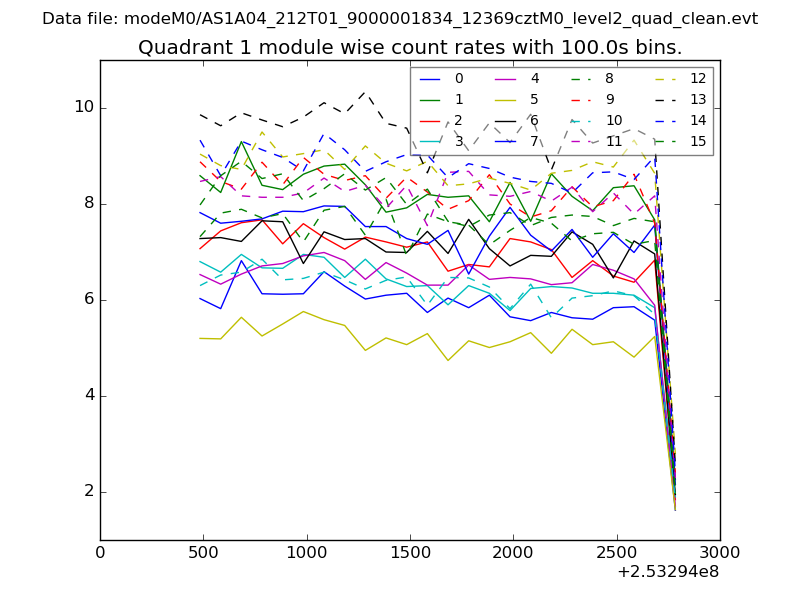
| Module-wise count rates for Quadrant B Data is divided into 100 sec bins |
 |
 |
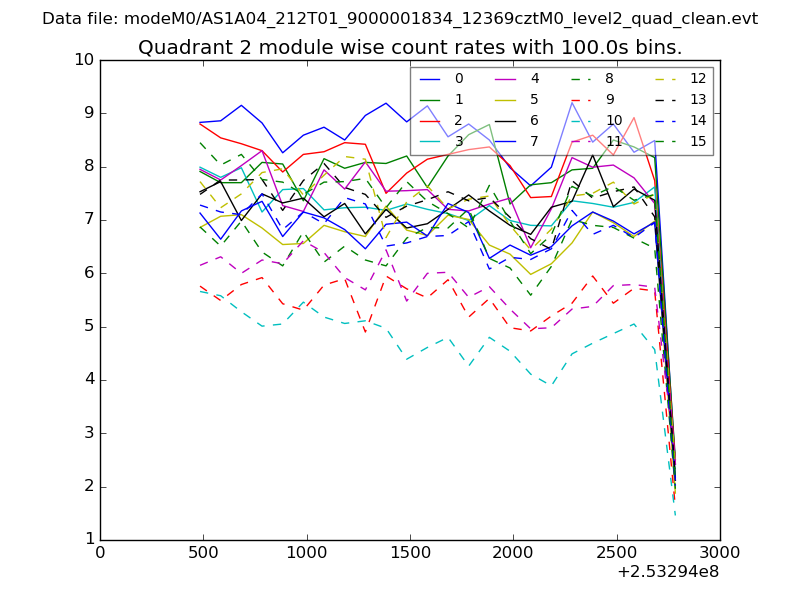
| Module-wise count rates for Quadrant C Data is divided into 100 sec bins |
 |
 |
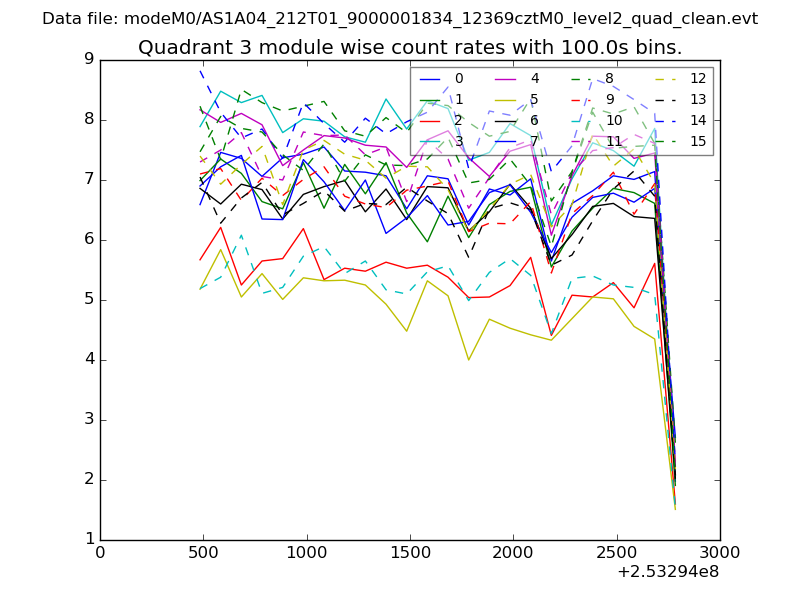
| Module-wise count rates for Quadrant D Data is divided into 100 sec bins |
 |
 |
| Parameter | Plot |
|---|---|
| CZT HV Monitor | 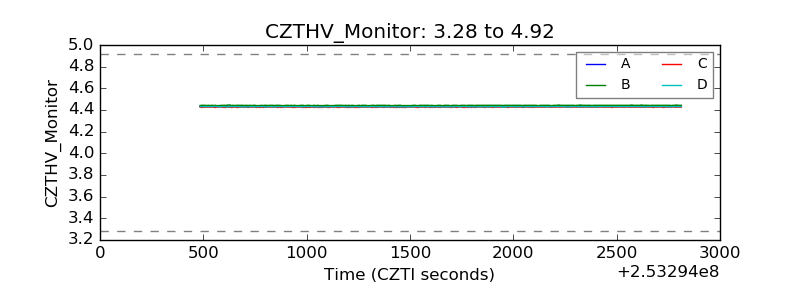 |
| D_VDD | 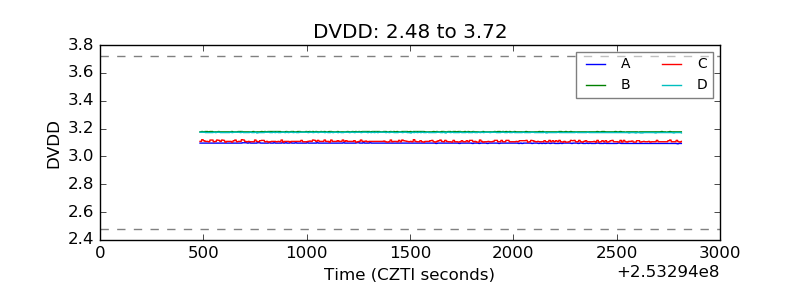 |
| Temperature 1 | 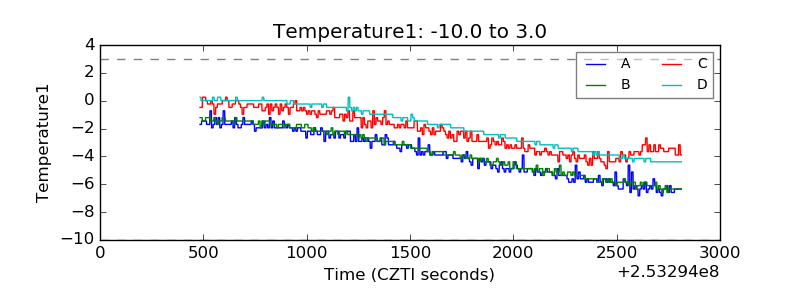 |
| Veto HV Monitor | 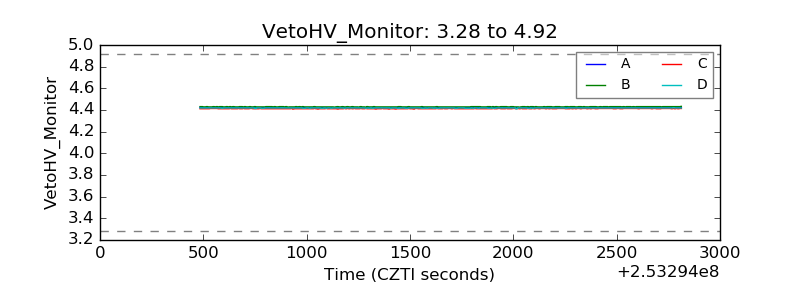 |
| Veto LLD | 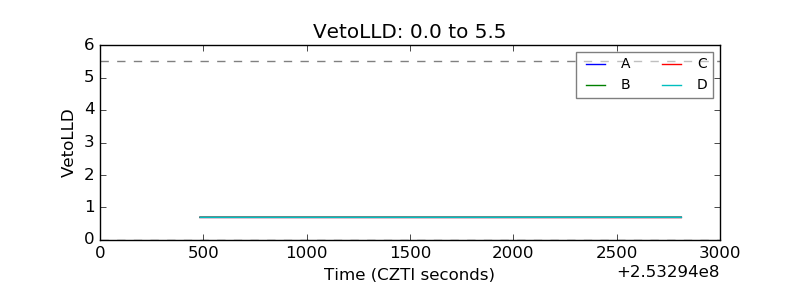 |
| Alpha Counter | 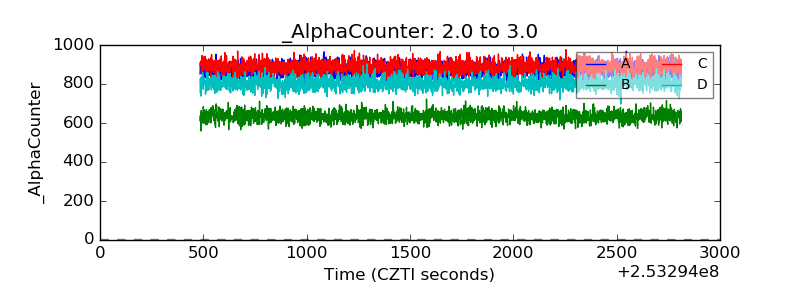 |
| _CPM_Rate | 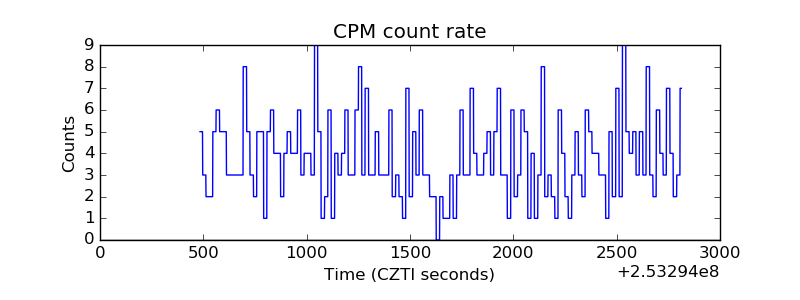 |
| CZT Counter | 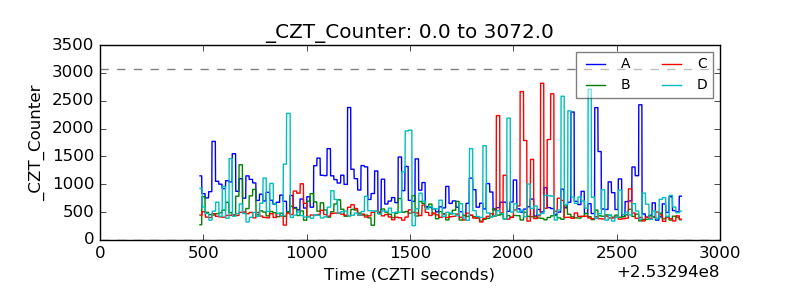 |
| +2.5 Volts monitor |  |
| +5 Volts monitor |  |
| _ROLL_ROT | 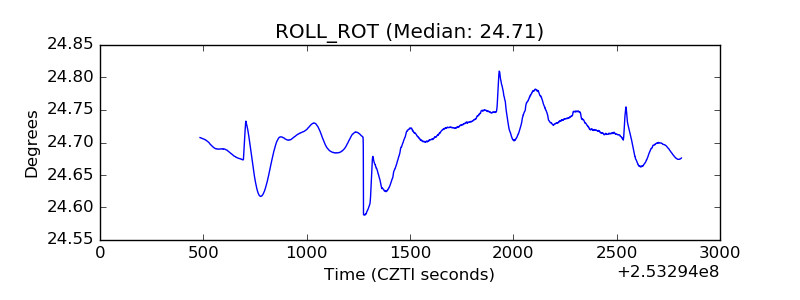 |
| _Roll_DEC | 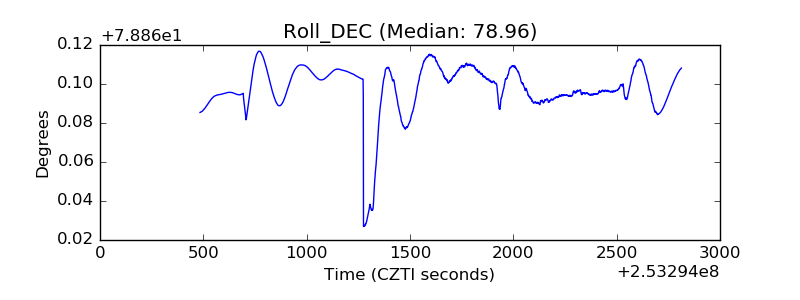 |
| _Roll_RA | 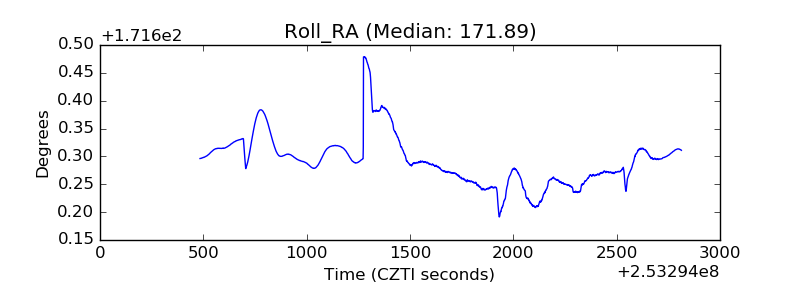 |
| Veto Counter | 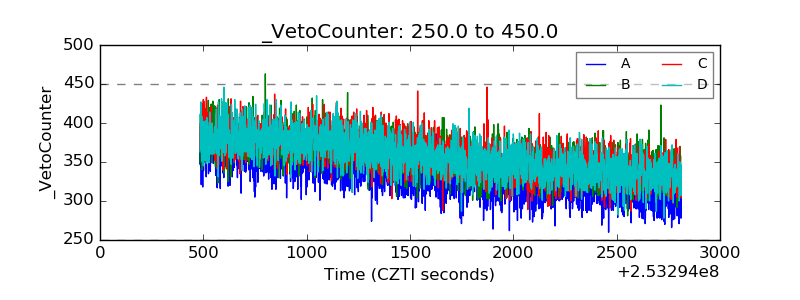 |