| Param | Original file | Final file |
|---|---|---|
| Filename | modeM0/AS1G08_072T03_9000001836_12370cztM0_level2.evt | modeM0/AS1G08_072T03_9000001836_12370cztM0_level2_quad_clean.evt |
| Size (bytes) | 518,964,480 | 87,321,600 |
| Size | 494.9 MB | 83.3 MB |
| Events in quadrant A | 4,123,511 | 552,906 |
| Events in quadrant B | 3,709,071 | 559,893 |
| Events in quadrant C | 3,422,049 | 551,591 |
| Events in quadrant D | 4,009,592 | 514,659 |
| Mode SS | |||
|---|---|---|---|
| Quadrant | BADHDUFLAG | Total packets | Discarded packets |
| A | 0 | 136 | 0 |
| B | 0 | 136 | 0 |
| C | 0 | 136 | 0 |
| D | 0 | 136 | 0 |
| Mode M0 | |||
|---|---|---|---|
| Quadrant | BADHDUFLAG | Total packets | Discarded packets |
| A | 0 | 16867 | 3 |
| B | 0 | 15442 | 2 |
| C | 0 | 14761 | 2 |
| D | 0 | 16554 | 2 |
| Mode M9 | |||
|---|---|---|---|
| Quadrant | BADHDUFLAG | Total packets | Discarded packets |
| A | 0 | 18 | 0 |
| B | 0 | 18 | 0 |
| C | 0 | 18 | 0 |
| D | 0 | 18 | 0 |
| Quadrant | Total seconds | Saturated seconds | Saturation percentage |
|---|---|---|---|
| A | 6677 | 120 | 1.797214% |
| B | 6677 | 126 | 1.887075% |
| C | 6677 | 65 | 0.973491% |
| D | 6677 | 241 | 3.609405% |
Noise dominated data is calculated using 1-second bins in cleaned event files. If a bin has >2000 counts, and if more than 50% of those come from <1% of pixels, then it is considered to be noise-dominated and hence unusable.
| Quadrant | # 1 sec bins | Bins with >0 counts | Bins with >2000 counts | High rate bins dominated by noise | Noise dominated (total time) | Noise dominated (detector-on time) | Marked lightcurve |
|---|---|---|---|---|---|---|---|
| A | 8468 | 6678 | 21 | 21 | 0.25% | 0.31% | 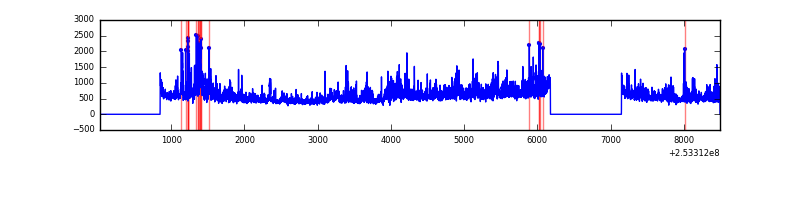 |
| B | 8467 | 6677 | 70 | 70 | 0.83% | 1.05% | 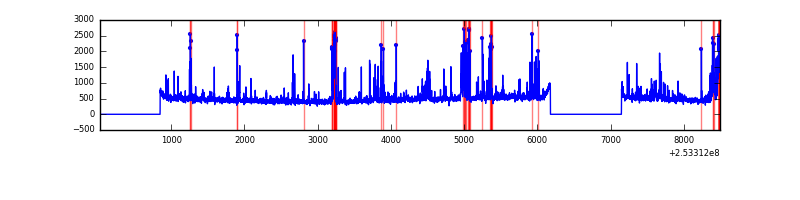 |
| C | 8468 | 6679 | 43 | 43 | 0.51% | 0.64% | 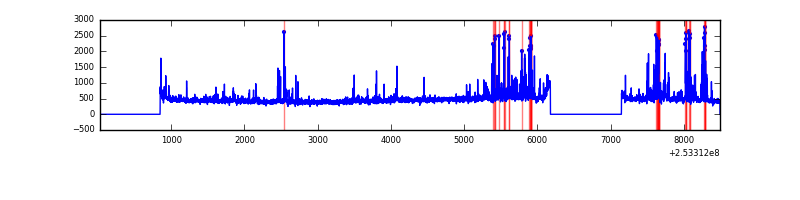 |
| D | 8467 | 6677 | 218 | 218 | 2.57% | 3.26% | 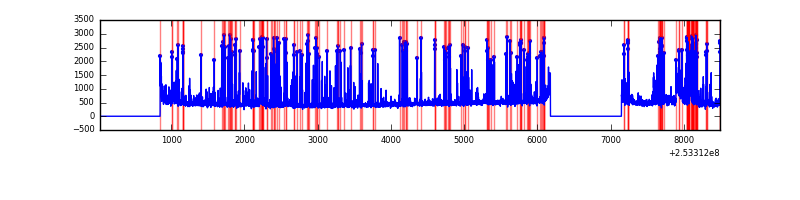 |
Top three noisy pixels from each quadrant. If the there are fewer than three noisy pixels in the level2.evt file, extra rows are filled as -1
| Pixel properties | Quadrant properties | ||||||
|---|---|---|---|---|---|---|---|
| Quadrant | DetID | PixID | Counts | Sigma | Mean | Median | Sigma |
| A | 8 | 15 | 258717 | 1617.76 | 776 | 759 | 159.5 |
| A | 1 | 162 | 218640 | 1366.42 | 776 | 759 | 159.5 |
| A | 13 | 251 | 202743 | 1266.72 | 776 | 759 | 159.5 |
| B | 4 | 239 | 320039 | 2127.05 | 782 | 762 | 150.1 |
| B | 10 | 245 | 230349 | 1529.53 | 782 | 762 | 150.1 |
| B | 2 | 32 | 58936 | 387.56 | 782 | 762 | 150.1 |
| C | 15 | 208 | 472154 | 2670.79 | 756 | 762 | 176.5 |
| C | 13 | 61 | 5480 | 26.73 | 756 | 762 | 176.5 |
| C | 12 | 4 | 3226 | 13.96 | 756 | 762 | 176.5 |
| D | 1 | 52 | 1132449 | 6339.25 | 737 | 715 | 178.5 |
| D | 10 | 199 | 28095 | 153.37 | 737 | 715 | 178.5 |
| D | 2 | 234 | 23005 | 124.85 | 737 | 715 | 178.5 |
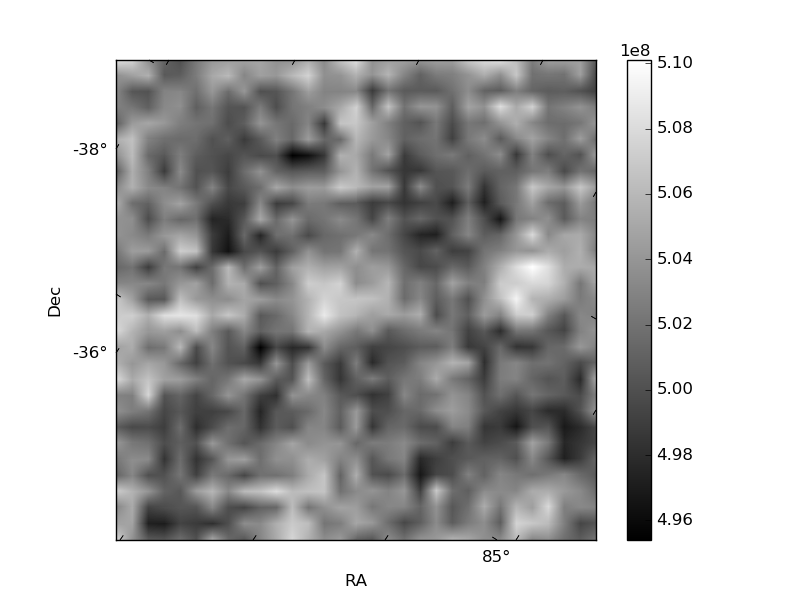
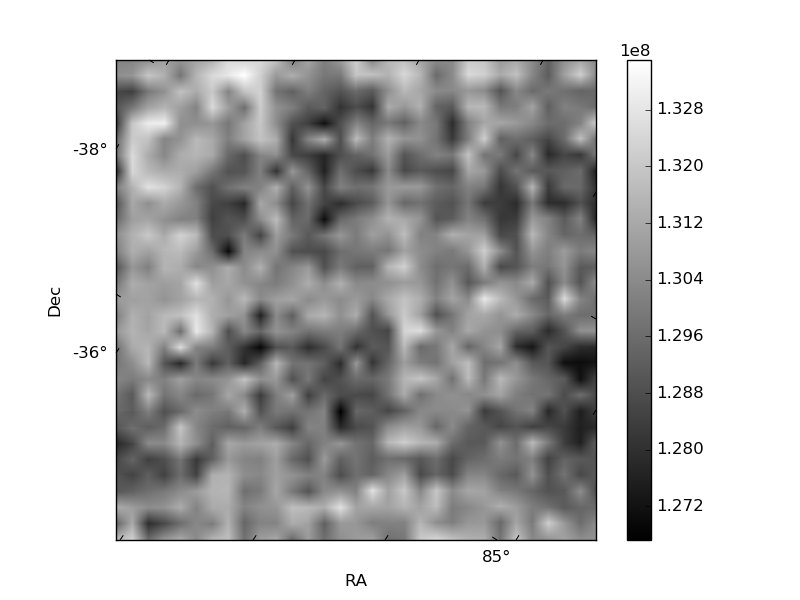
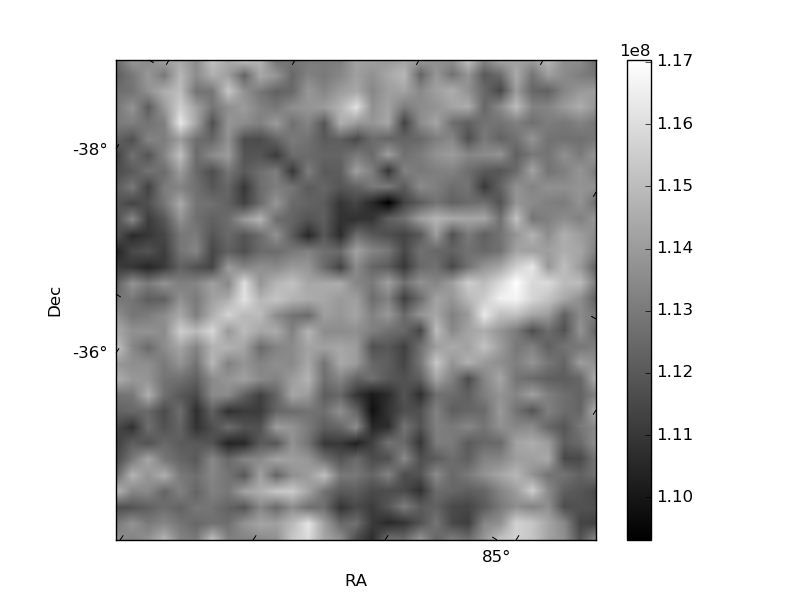
Histogram calculated using DETX and DETY for each event in the final _common_clean file
| Quadrant A | 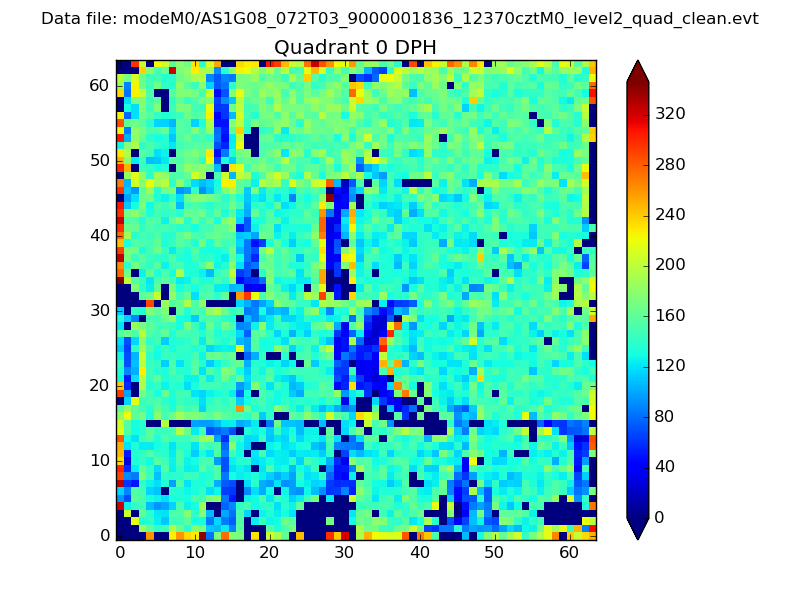 |
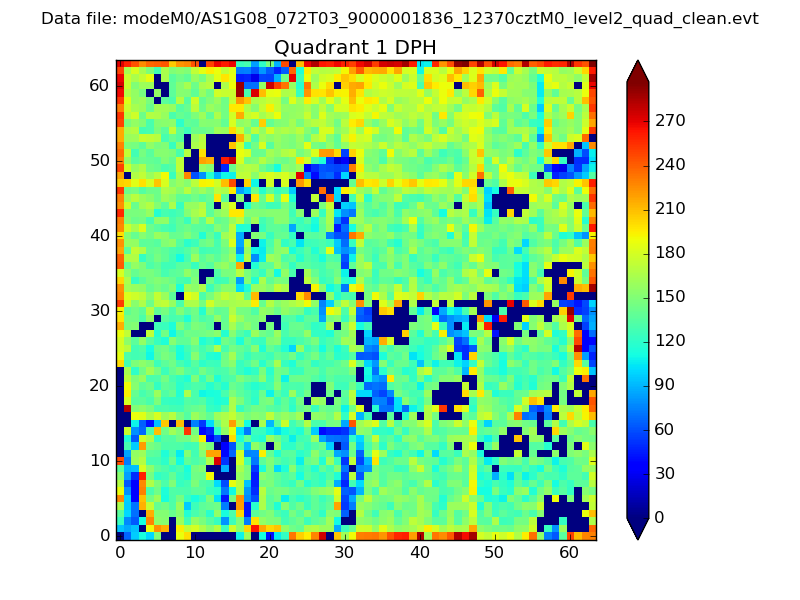 |
Quadrant B |
|---|---|---|---|
| Quadrant D | 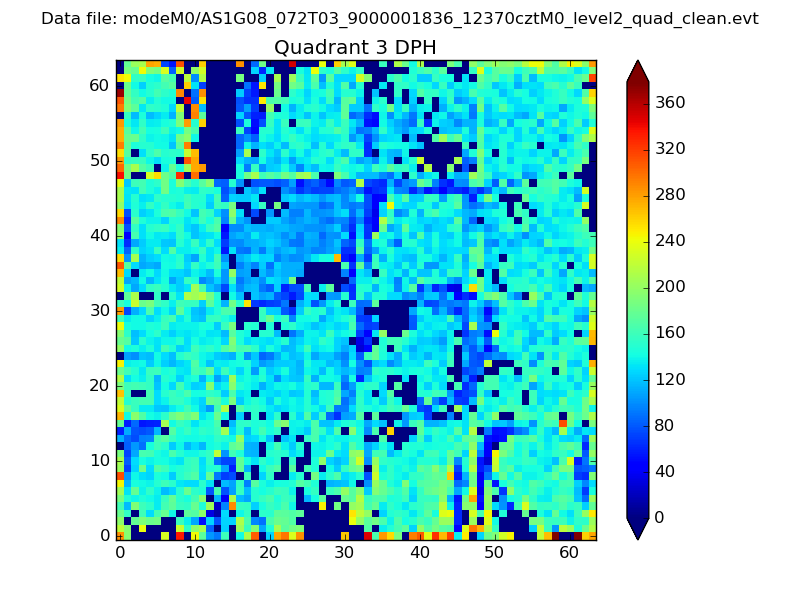 |
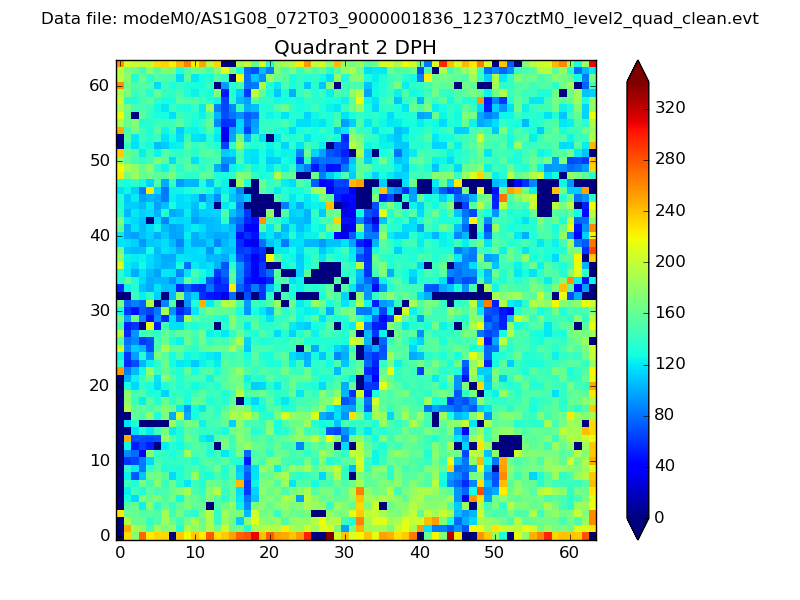 |
Quadrant C |
| Plot type | Count rate plots | Images |
|---|---|---|
| Comparison with Poisson distribution Blue bars denote a histogram of data divided into 1 sec bins. Red curve is a Poisson curve with rate = median count rate of data. |
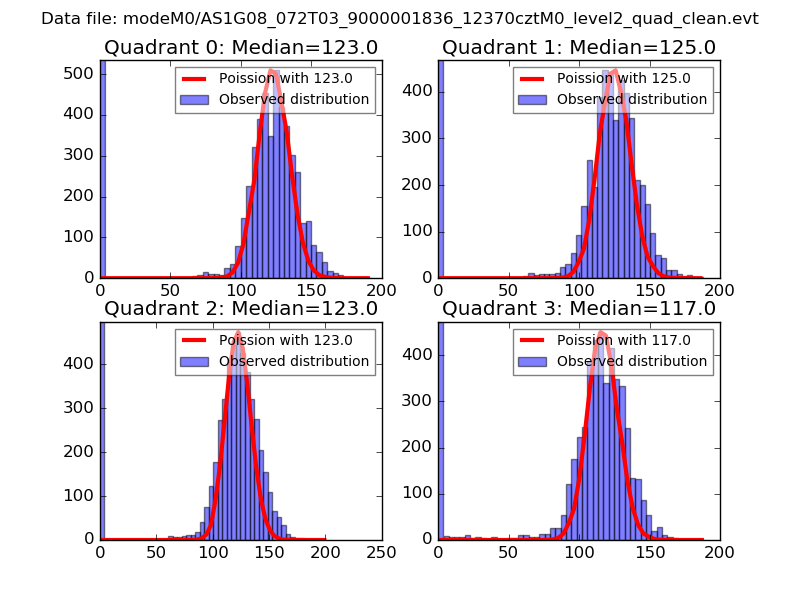 |
 |
| Quadrant-wise count rates Data is divided into 100 sec bins |
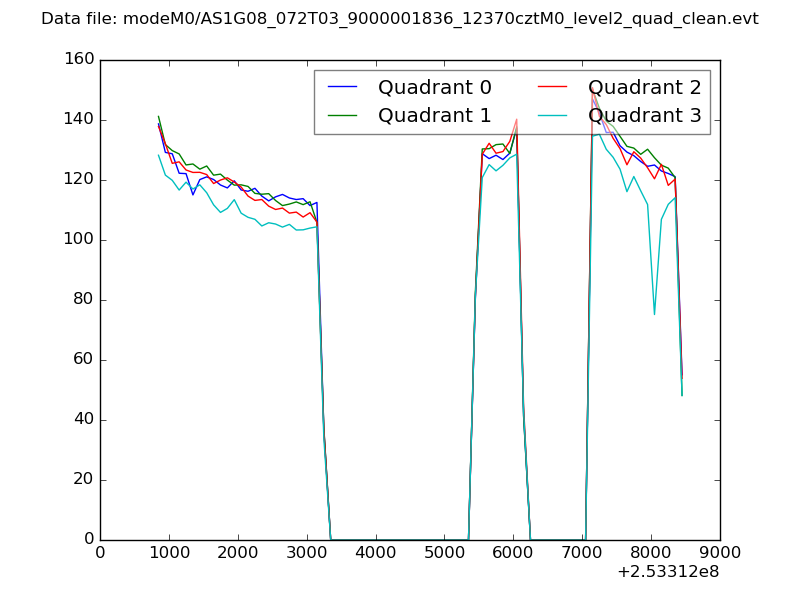 |
|
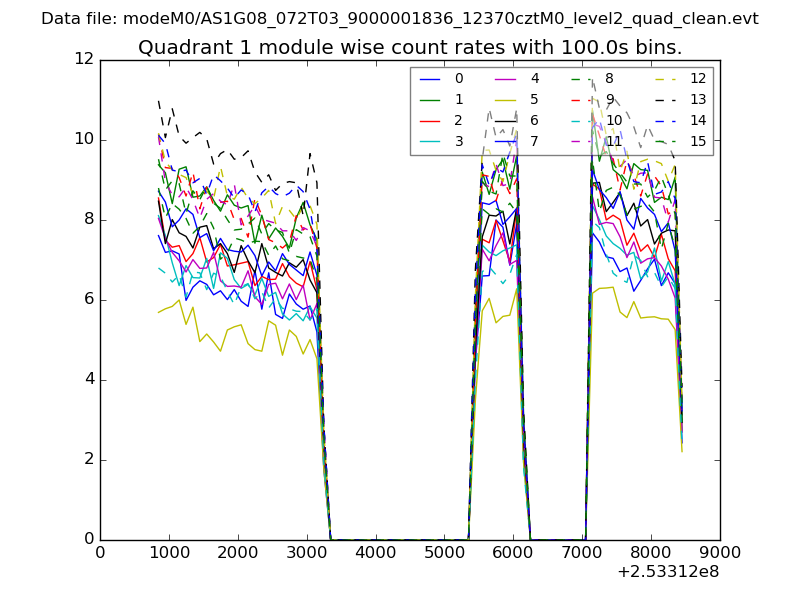
| Module-wise count rates for Quadrant A Data is divided into 100 sec bins |
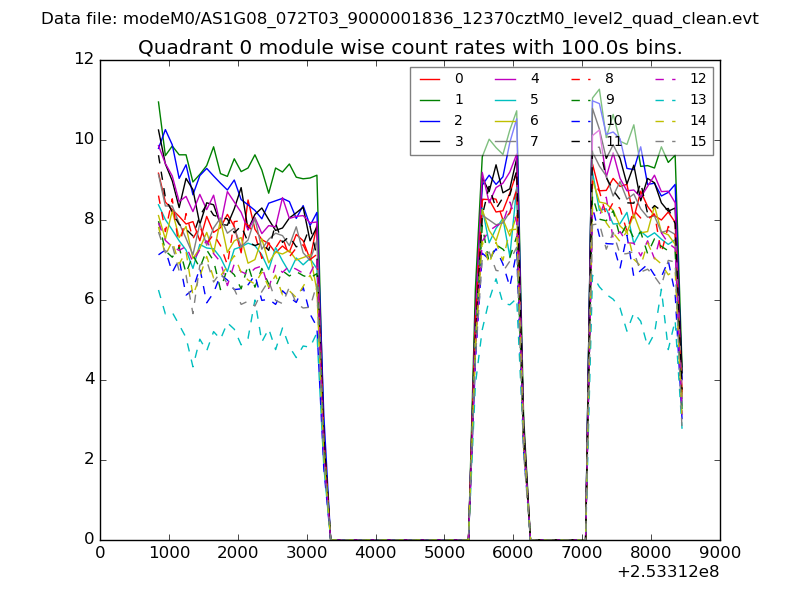 |
 |
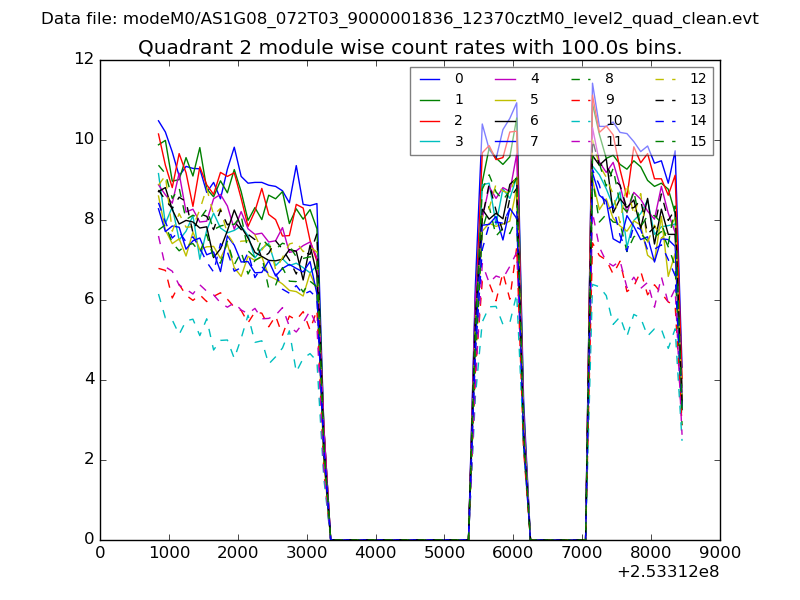
| Module-wise count rates for Quadrant B Data is divided into 100 sec bins |
 |
 |
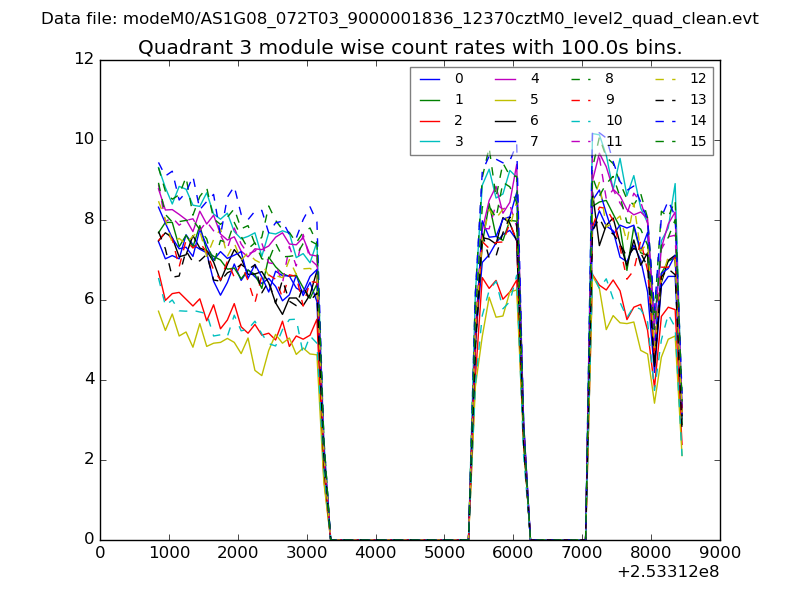
| Module-wise count rates for Quadrant C Data is divided into 100 sec bins |
 |
 |
| Module-wise count rates for Quadrant D Data is divided into 100 sec bins |
 |
 |
| Parameter | Plot |
|---|---|
| CZT HV Monitor | 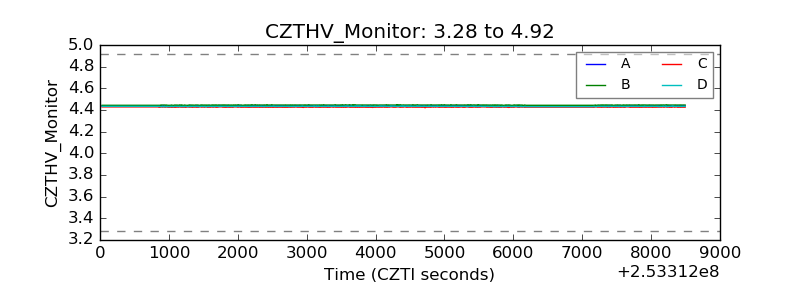 |
| D_VDD | 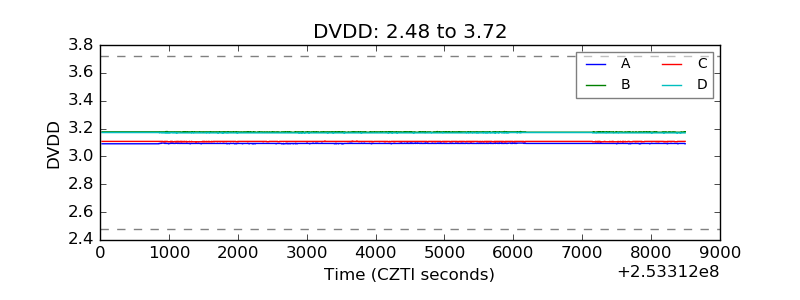 |
| Temperature 1 | 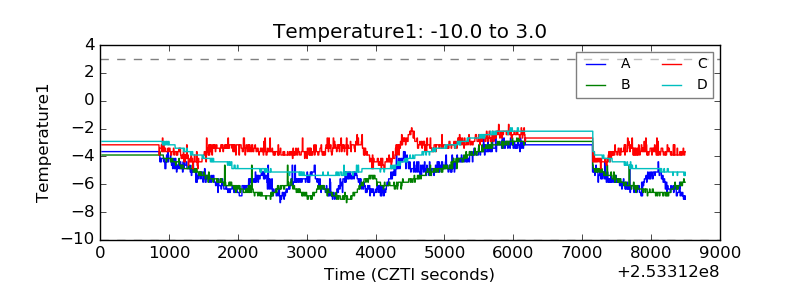 |
| Veto HV Monitor | 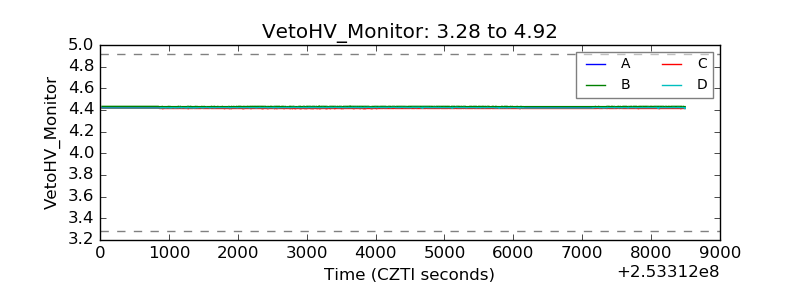 |
| Veto LLD | 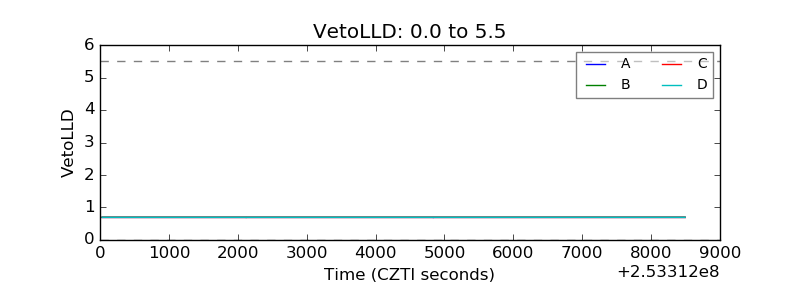 |
| Alpha Counter | 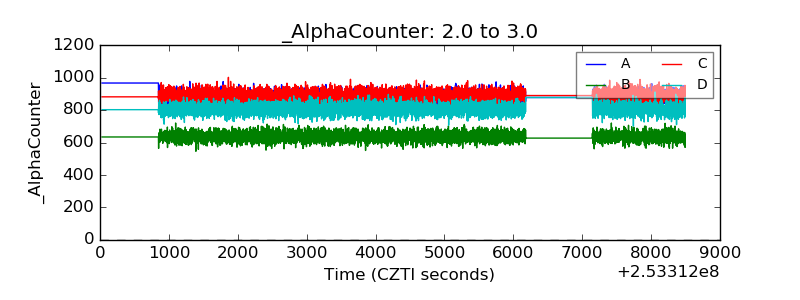 |
| _CPM_Rate | 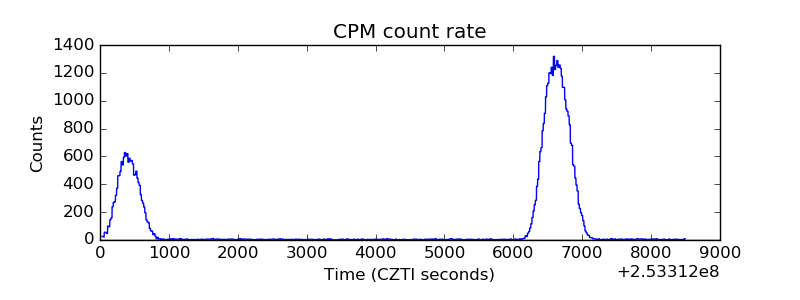 |
| CZT Counter | 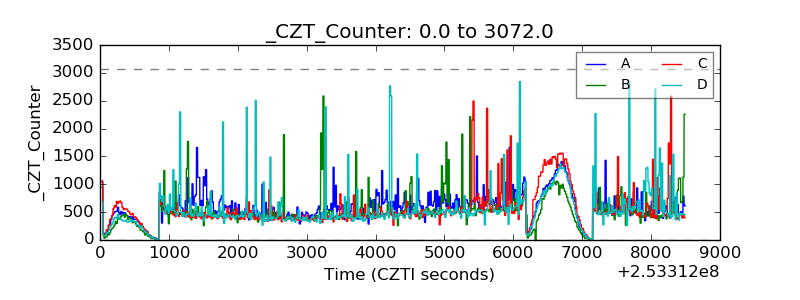 |
| +2.5 Volts monitor |  |
| +5 Volts monitor | 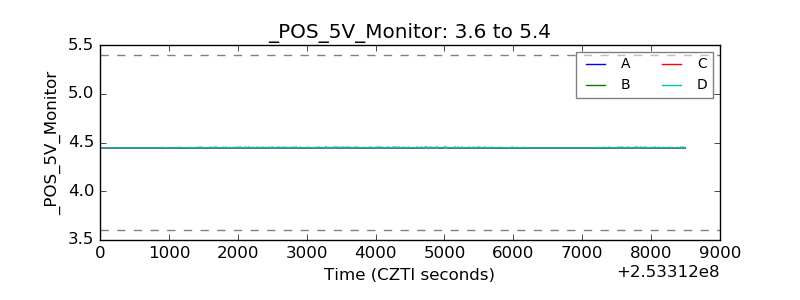 |
| _ROLL_ROT | 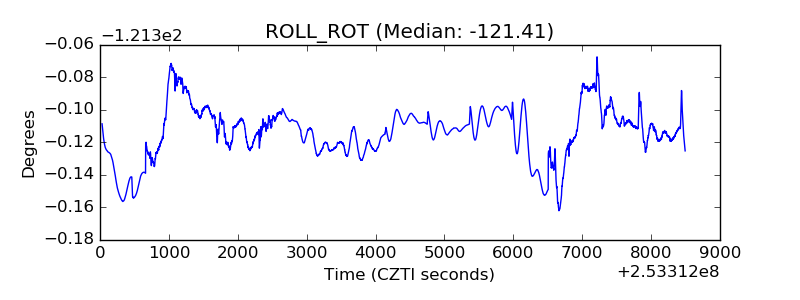 |
| _Roll_DEC | 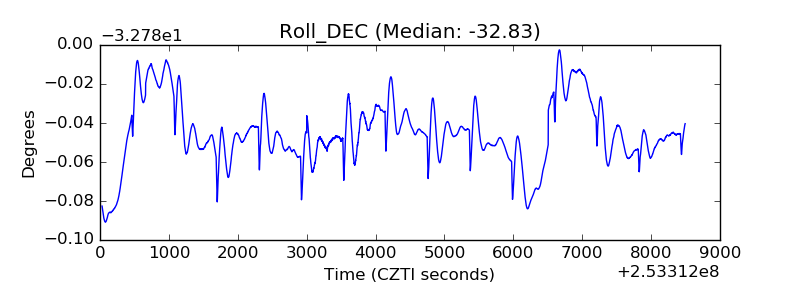 |
| _Roll_RA | 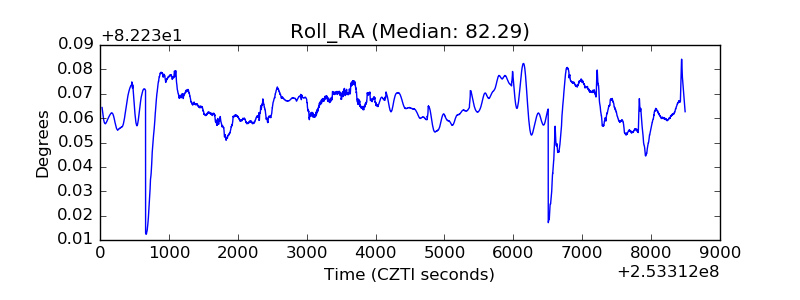 |
| Veto Counter | 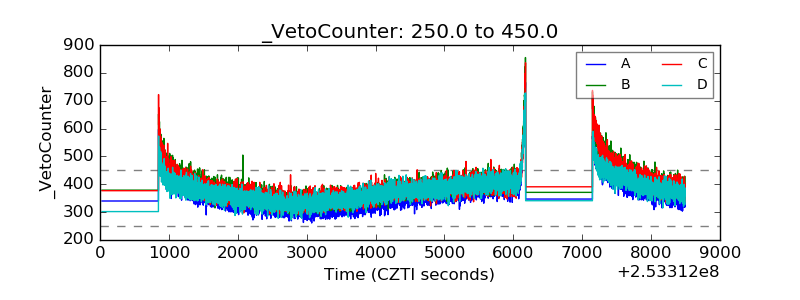 |