| Param | Original file | Final file |
|---|---|---|
| Filename | modeM0/AS1G08_072T03_9000001836_12372cztM0_level2.evt | modeM0/AS1G08_072T03_9000001836_12372cztM0_level2_quad_clean.evt |
| Size (bytes) | 575,602,560 | 87,612,480 |
| Size | 548.9 MB | 83.6 MB |
| Events in quadrant A | 3,568,671 | 562,445 |
| Events in quadrant B | 5,407,555 | 553,191 |
| Events in quadrant C | 3,815,141 | 557,145 |
| Events in quadrant D | 4,200,407 | 526,651 |
| Mode SS | |||
|---|---|---|---|
| Quadrant | BADHDUFLAG | Total packets | Discarded packets |
| A | 0 | 132 | 0 |
| B | 0 | 132 | 0 |
| C | 0 | 132 | 0 |
| D | 0 | 132 | 0 |
| Mode M0 | |||
|---|---|---|---|
| Quadrant | BADHDUFLAG | Total packets | Discarded packets |
| A | 0 | 14786 | 3 |
| B | 0 | 20399 | 2 |
| C | 0 | 15579 | 2 |
| D | 0 | 16831 | 2 |
| Mode M9 | |||
|---|---|---|---|
| Quadrant | BADHDUFLAG | Total packets | Discarded packets |
| A | 0 | 14 | 0 |
| B | 0 | 14 | 0 |
| C | 0 | 14 | 0 |
| D | 0 | 15 | 0 |
| Quadrant | Total seconds | Saturated seconds | Saturation percentage |
|---|---|---|---|
| A | 6502 | 41 | 0.630575% |
| B | 6502 | 444 | 6.828668% |
| C | 6502 | 116 | 1.784066% |
| D | 6502 | 304 | 4.675484% |
Noise dominated data is calculated using 1-second bins in cleaned event files. If a bin has >2000 counts, and if more than 50% of those come from <1% of pixels, then it is considered to be noise-dominated and hence unusable.
| Quadrant | # 1 sec bins | Bins with >0 counts | Bins with >2000 counts | High rate bins dominated by noise | Noise dominated (total time) | Noise dominated (detector-on time) | Marked lightcurve |
|---|---|---|---|---|---|---|---|
| A | 7637 | 6502 | 5 | 5 | 0.07% | 0.08% | 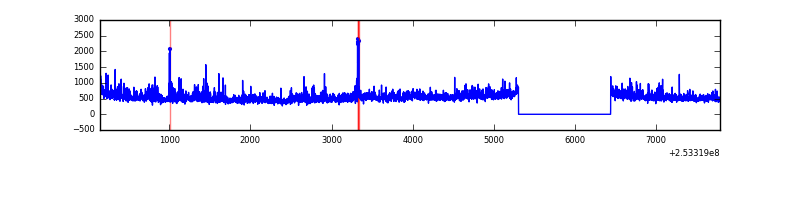 |
| B | 7638 | 6504 | 386 | 386 | 5.05% | 5.93% | 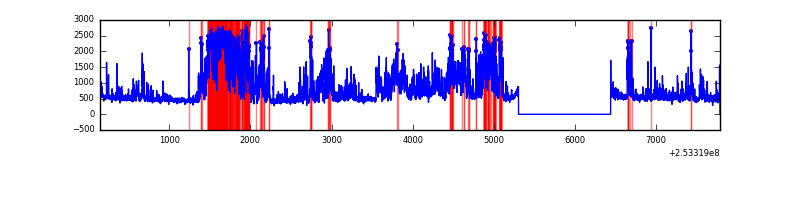 |
| C | 7637 | 6503 | 119 | 119 | 1.56% | 1.83% | 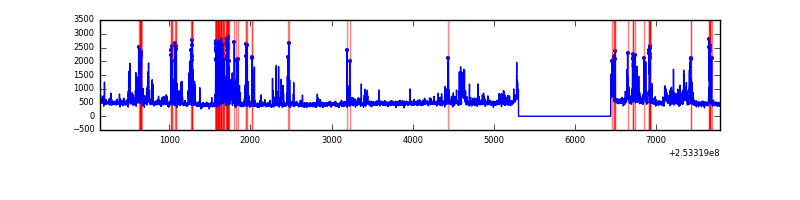 |
| D | 7637 | 6503 | 283 | 283 | 3.71% | 4.35% | 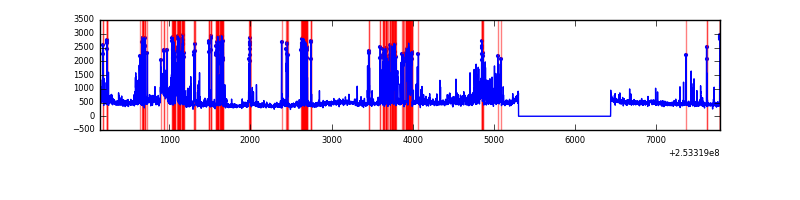 |
Top three noisy pixels from each quadrant. If the there are fewer than three noisy pixels in the level2.evt file, extra rows are filled as -1
| Pixel properties | Quadrant properties | ||||||
|---|---|---|---|---|---|---|---|
| Quadrant | DetID | PixID | Counts | Sigma | Mean | Median | Sigma |
| A | 1 | 162 | 163370 | 1035.47 | 766 | 751 | 157.0 |
| A | 1 | 178 | 90654 | 572.46 | 766 | 751 | 157.0 |
| A | 1 | 161 | 77838 | 490.85 | 766 | 751 | 157.0 |
| B | 2 | 32 | 1537659 | 10662.13 | 763 | 743 | 144.1 |
| B | 2 | 48 | 533597 | 3696.6 | 763 | 743 | 144.1 |
| B | 4 | 239 | 228123 | 1577.42 | 763 | 743 | 144.1 |
| C | 15 | 208 | 883742 | 5063.23 | 750 | 756 | 174.4 |
| C | 14 | 234 | 6785 | 34.57 | 750 | 756 | 174.4 |
| C | 13 | 61 | 5486 | 27.12 | 750 | 756 | 174.4 |
| D | 1 | 52 | 1300853 | 7365.22 | 731 | 711 | 176.5 |
| D | 10 | 199 | 52725 | 294.66 | 731 | 711 | 176.5 |
| D | 13 | 104 | 35722 | 198.34 | 731 | 711 | 176.5 |
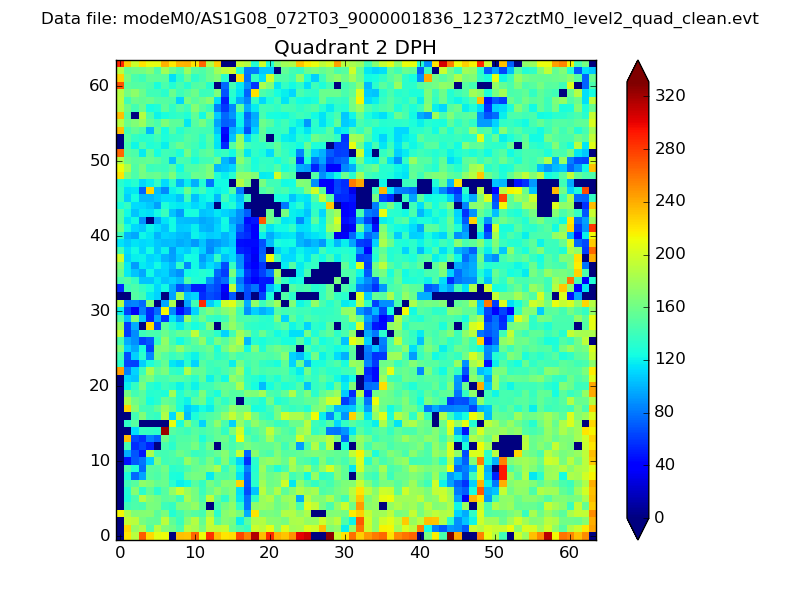
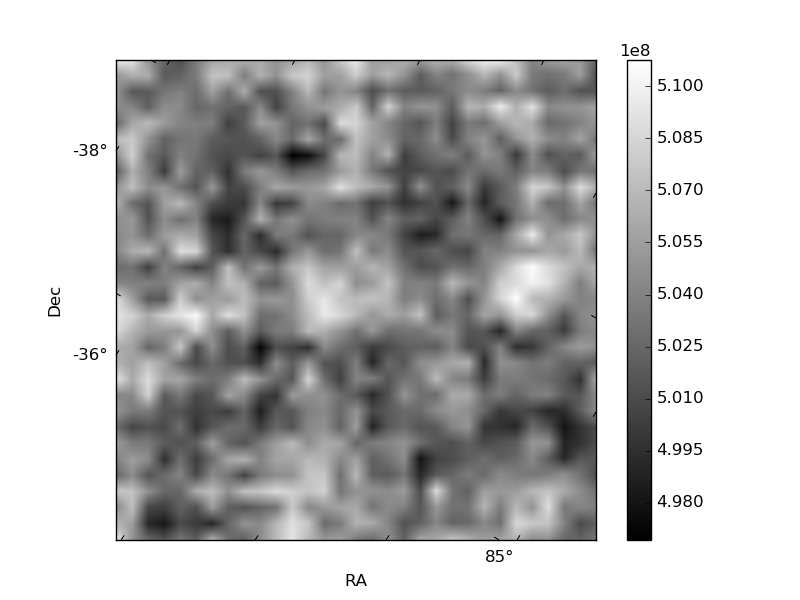
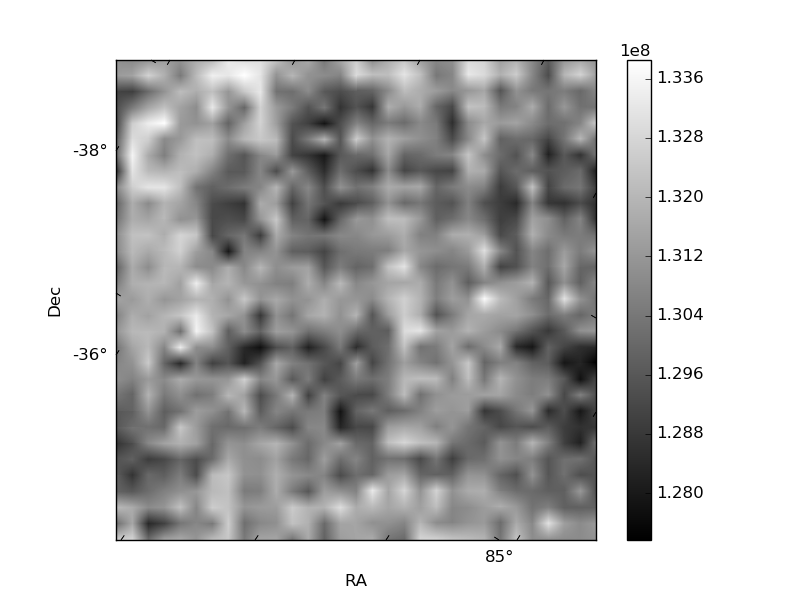
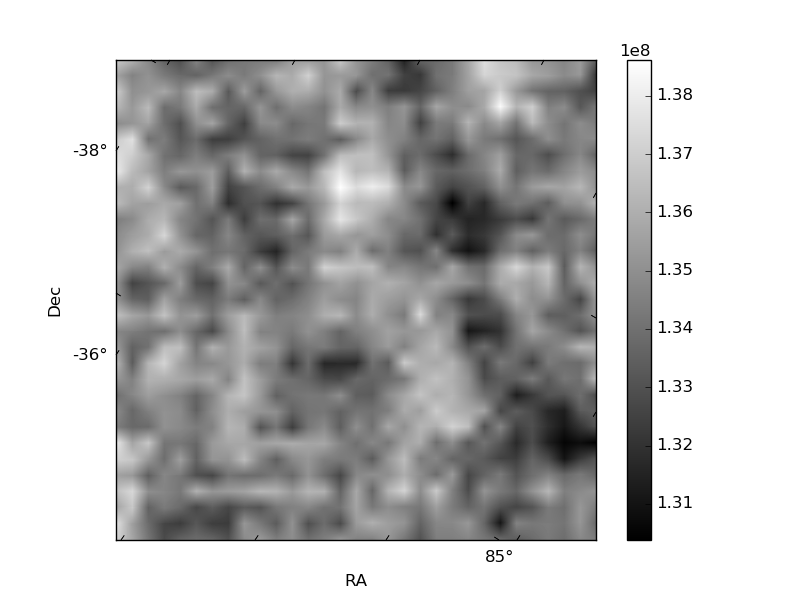
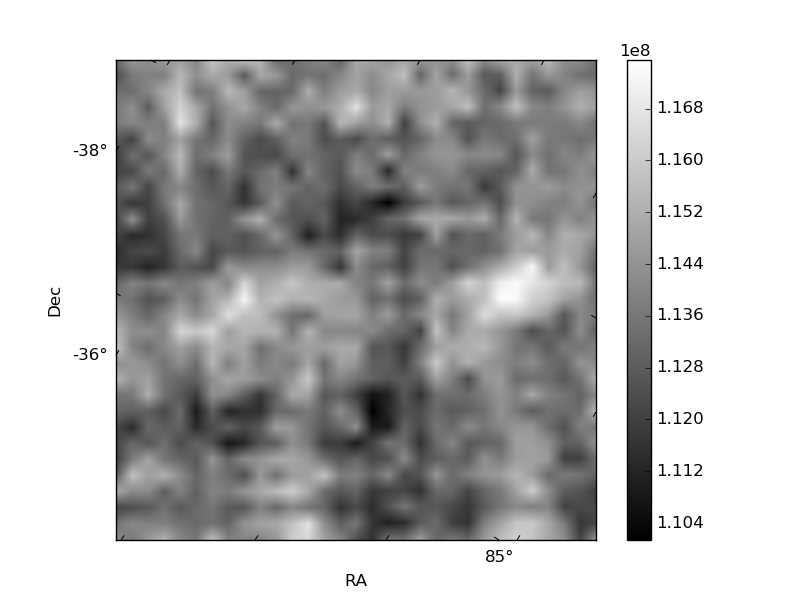
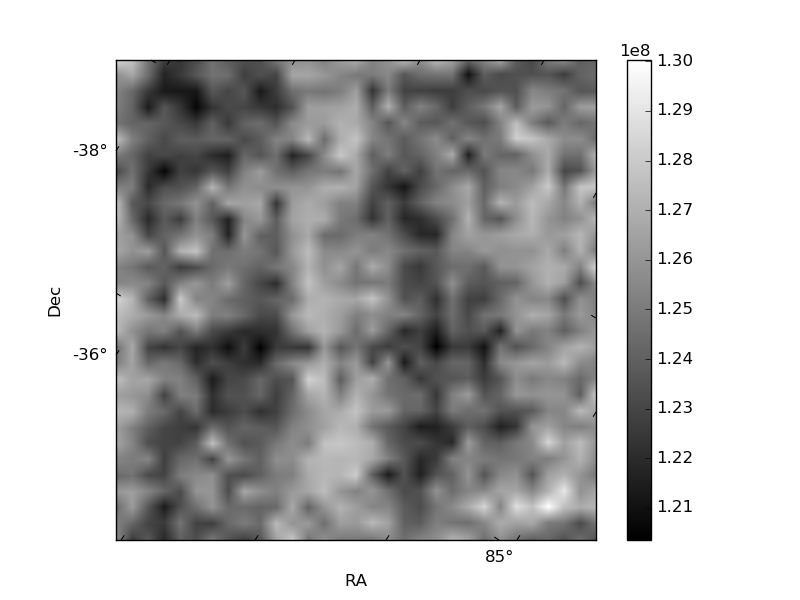
Histogram calculated using DETX and DETY for each event in the final _common_clean file
| Quadrant A | 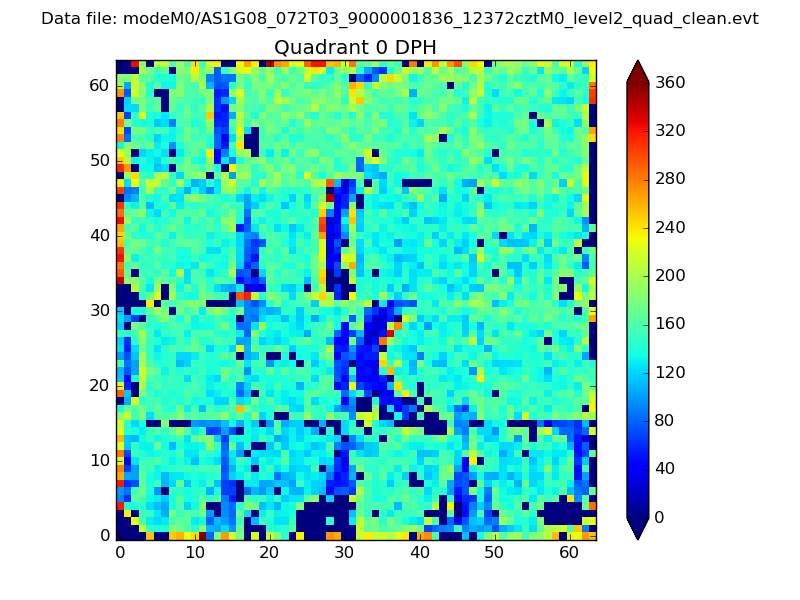 |
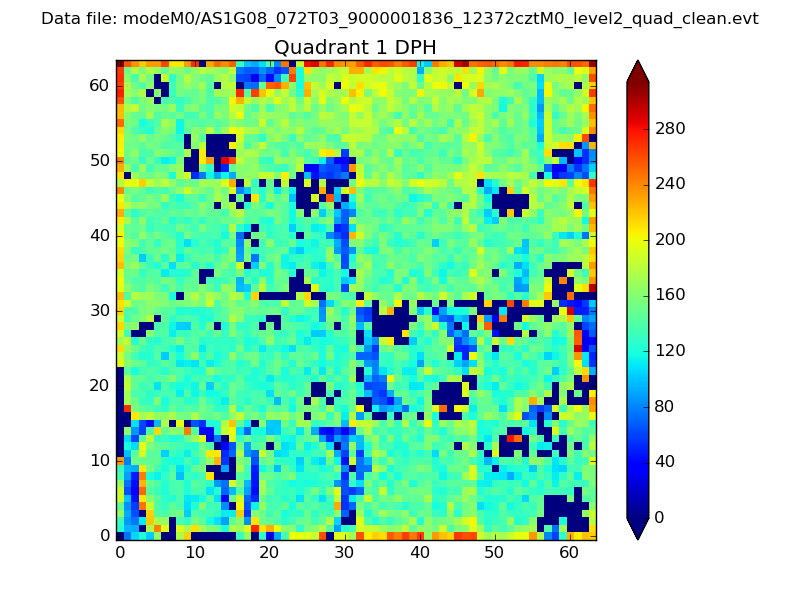 |
Quadrant B |
|---|---|---|---|
| Quadrant D | 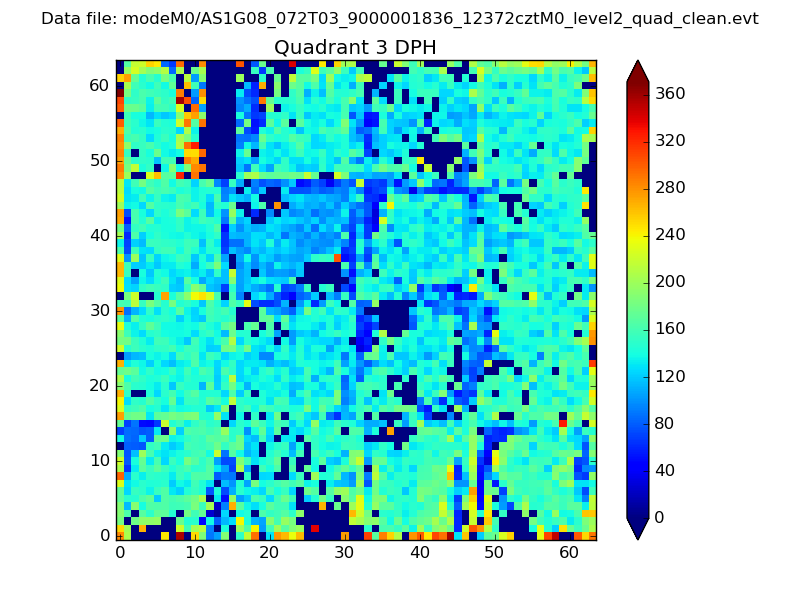 |
 |
Quadrant C |
| Plot type | Count rate plots | Images |
|---|---|---|
| Comparison with Poisson distribution Blue bars denote a histogram of data divided into 1 sec bins. Red curve is a Poisson curve with rate = median count rate of data. |
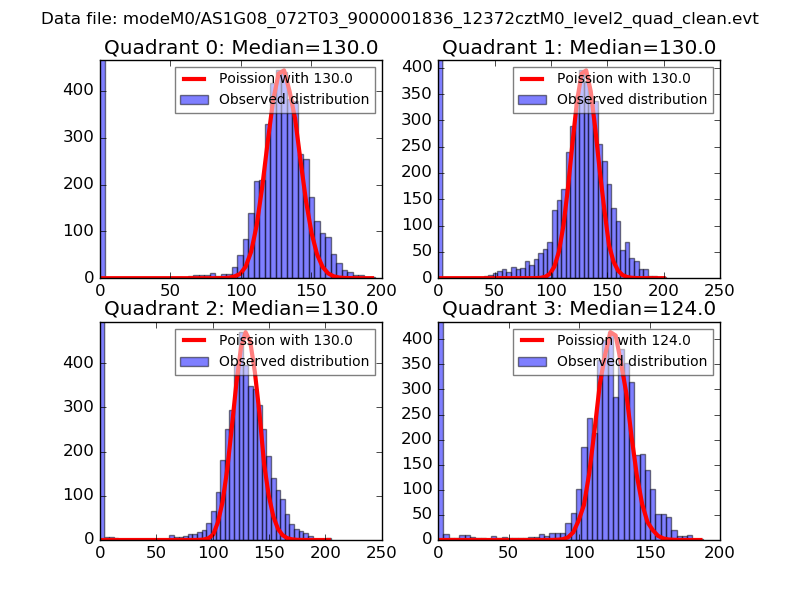 |
 |
| Quadrant-wise count rates Data is divided into 100 sec bins |
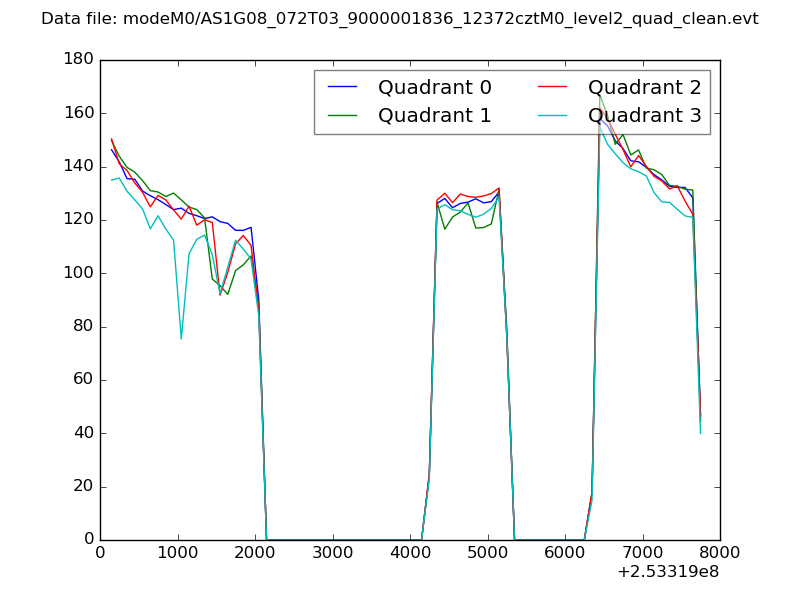 |
|
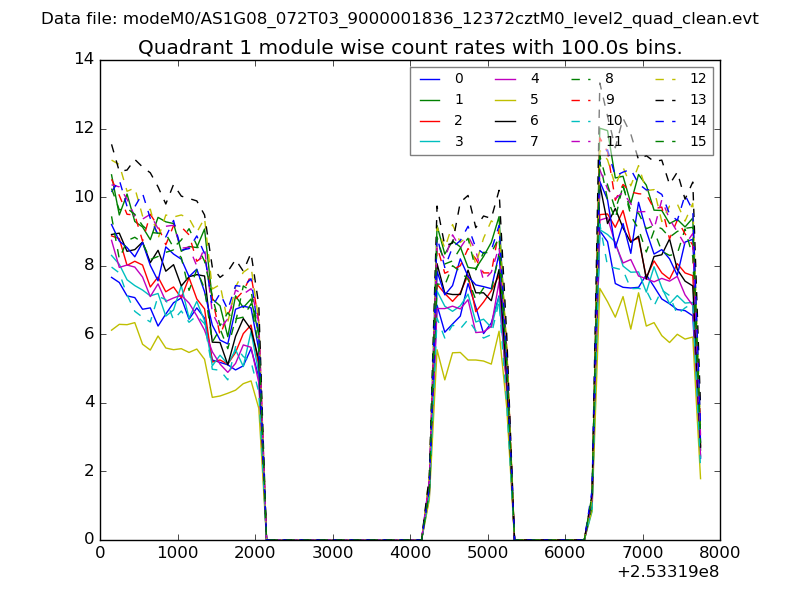
| Module-wise count rates for Quadrant A Data is divided into 100 sec bins |
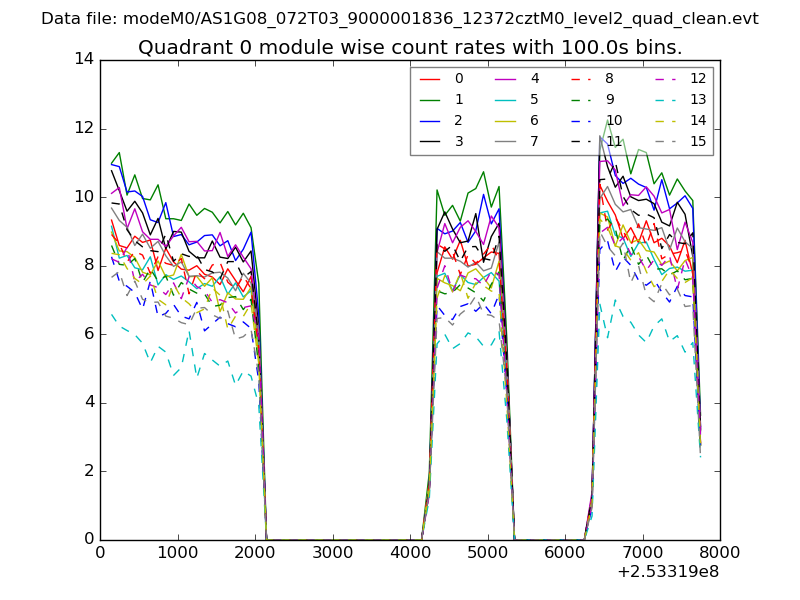 |
 |
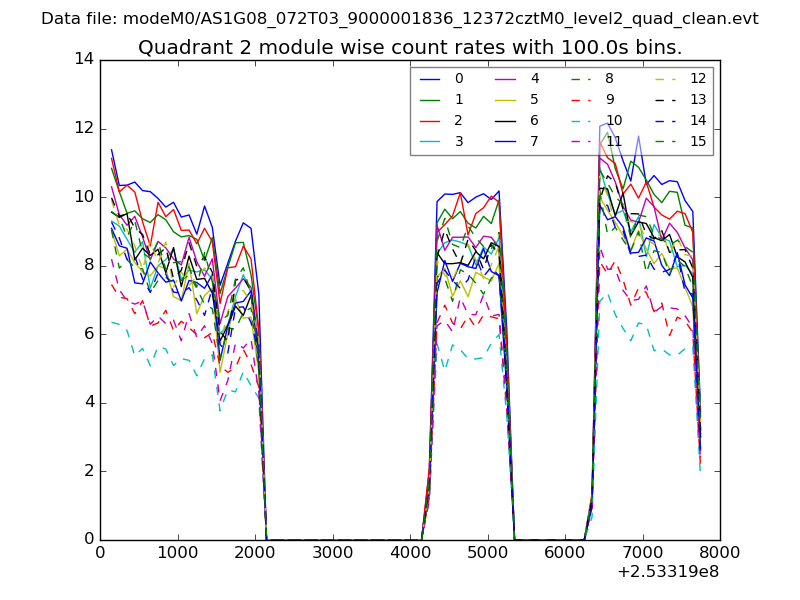
| Module-wise count rates for Quadrant B Data is divided into 100 sec bins |
 |
 |
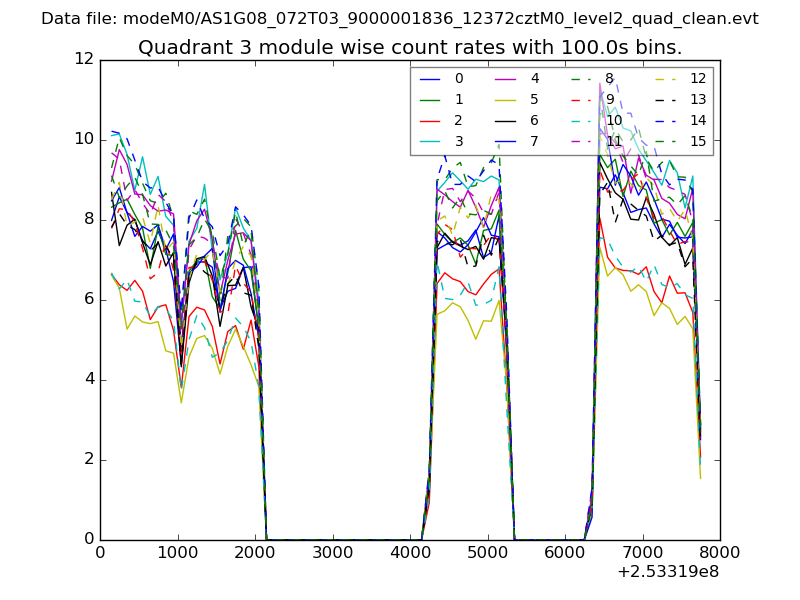
| Module-wise count rates for Quadrant C Data is divided into 100 sec bins |
 |
 |
| Module-wise count rates for Quadrant D Data is divided into 100 sec bins |
 |
 |
| Parameter | Plot |
|---|---|
| CZT HV Monitor | 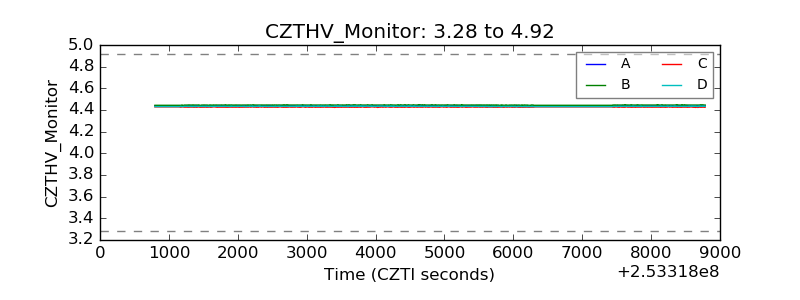 |
| D_VDD | 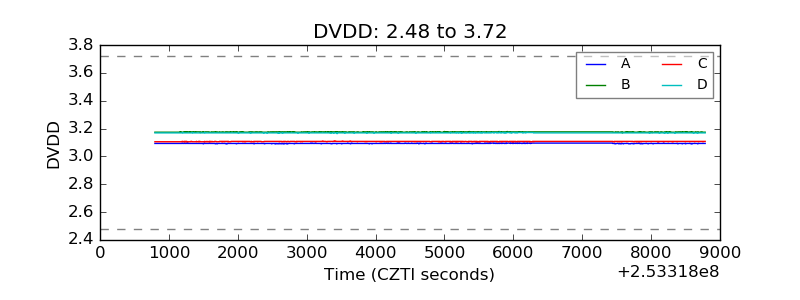 |
| Temperature 1 | 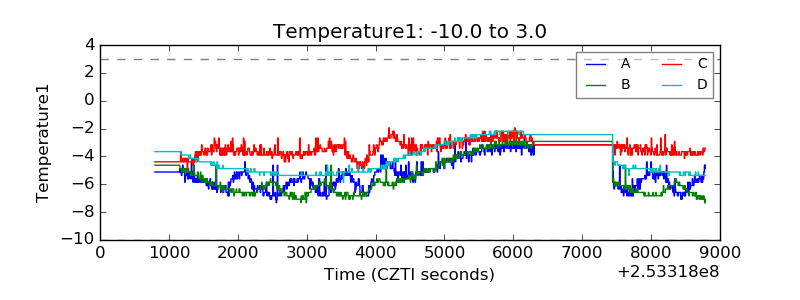 |
| Veto HV Monitor |  |
| Veto LLD | 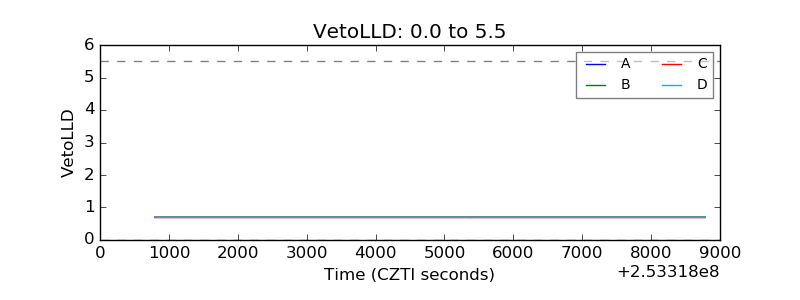 |
| Alpha Counter | 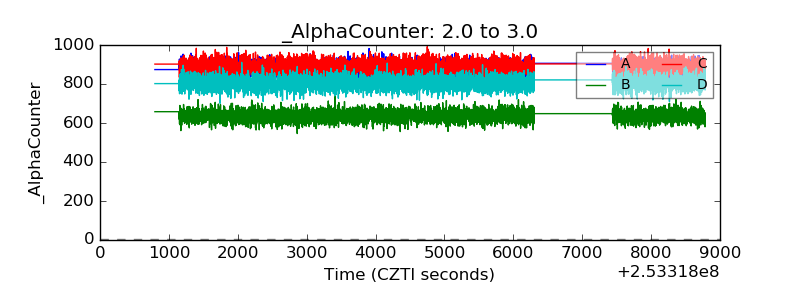 |
| _CPM_Rate | 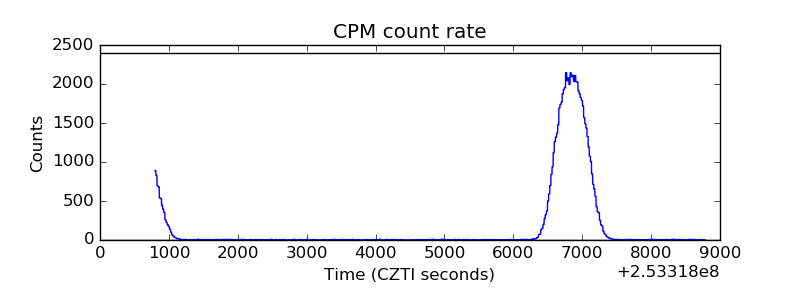 |
| CZT Counter | 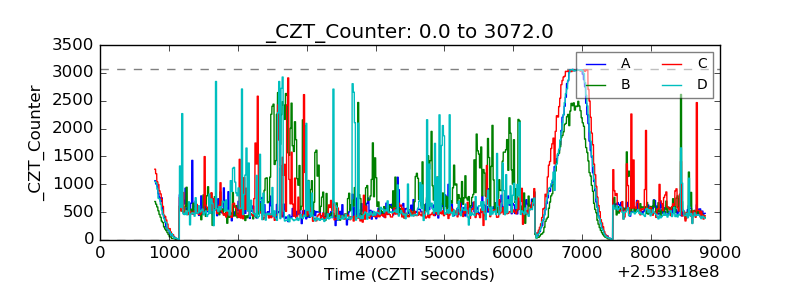 |
| +2.5 Volts monitor |  |
| +5 Volts monitor | 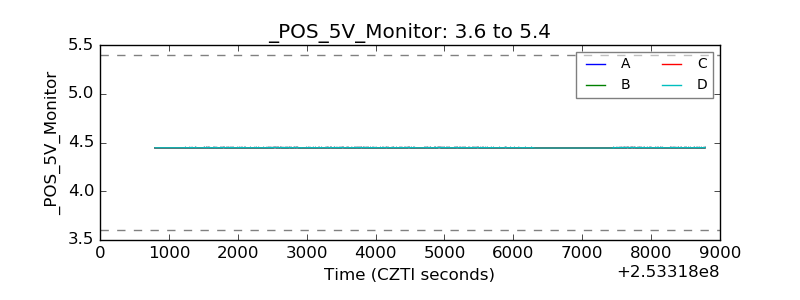 |
| _ROLL_ROT | 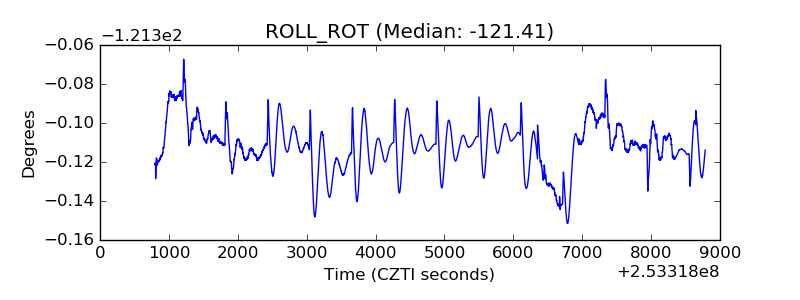 |
| _Roll_DEC | 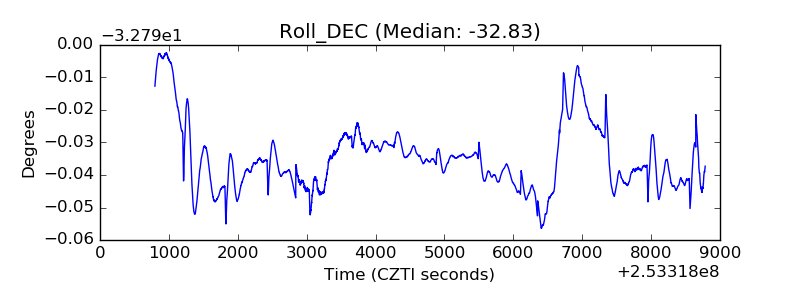 |
| _Roll_RA | 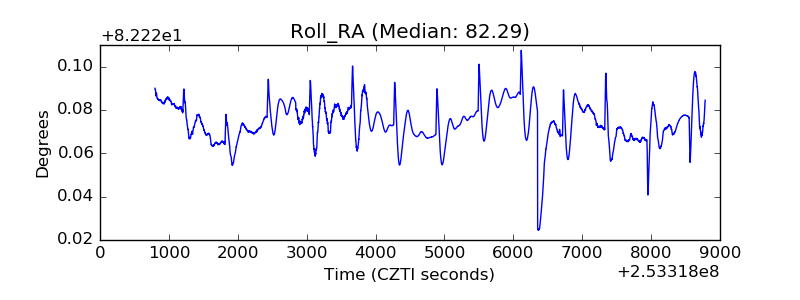 |
| Veto Counter | 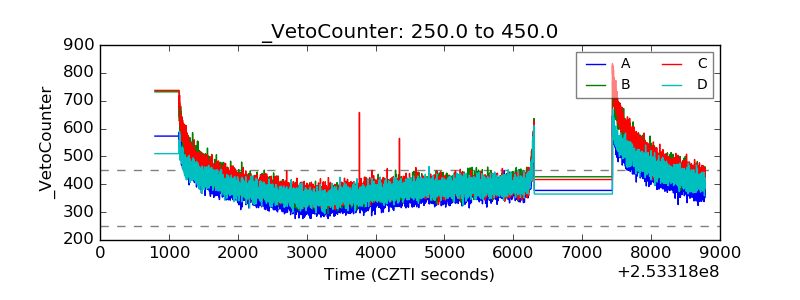 |