| Param | Original file | Final file |
|---|---|---|
| Filename | modeM0/AS1G08_072T03_9000001836_12375cztM0_level2.evt | modeM0/AS1G08_072T03_9000001836_12375cztM0_level2_quad_clean.evt |
| Size (bytes) | 755,893,440 | 63,509,760 |
| Size | 720.9 MB | 60.6 MB |
| Events in quadrant A | 3,730,985 | 408,899 |
| Events in quadrant B | 12,145,216 | 277,593 |
| Events in quadrant C | 3,377,757 | 420,477 |
| Events in quadrant D | 3,232,141 | 395,883 |
| Mode SS | |||
|---|---|---|---|
| Quadrant | BADHDUFLAG | Total packets | Discarded packets |
| A | 0 | 122 | 0 |
| B | 0 | 122 | 0 |
| C | 0 | 122 | 0 |
| D | 0 | 122 | 0 |
| Mode M0 | |||
|---|---|---|---|
| Quadrant | BADHDUFLAG | Total packets | Discarded packets |
| A | 0 | 15132 | 2 |
| B | 0 | 40095 | 1 |
| C | 0 | 13552 | 1 |
| D | 0 | 13204 | 1 |
| Mode M9 | |||
|---|---|---|---|
| Quadrant | BADHDUFLAG | Total packets | Discarded packets |
| A | 0 | 13 | 0 |
| B | 0 | 13 | 0 |
| C | 0 | 13 | 0 |
| D | 0 | 13 | 0 |
| Quadrant | Total seconds | Saturated seconds | Saturation percentage |
|---|---|---|---|
| A | 6003 | 66 | 1.099450% |
| B | 6003 | 4329 | 72.113943% |
| C | 6003 | 156 | 2.598701% |
| D | 6003 | 78 | 1.299350% |
Noise dominated data is calculated using 1-second bins in cleaned event files. If a bin has >2000 counts, and if more than 50% of those come from <1% of pixels, then it is considered to be noise-dominated and hence unusable.
| Quadrant | # 1 sec bins | Bins with >0 counts | Bins with >2000 counts | High rate bins dominated by noise | Noise dominated (total time) | Noise dominated (detector-on time) | Marked lightcurve |
|---|---|---|---|---|---|---|---|
| A | 7324 | 6004 | 5 | 5 | 0.07% | 0.08% | 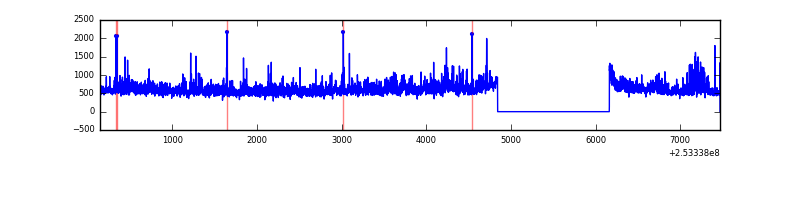 |
| B | 7323 | 6003 | 4125 | 4125 | 56.33% | 68.72% | 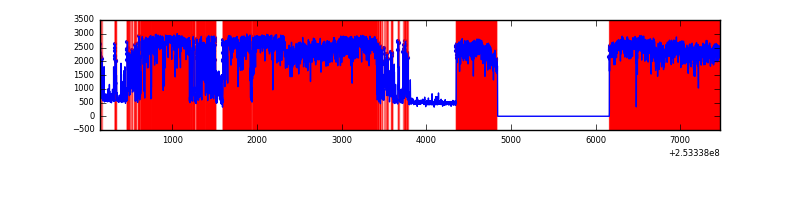 |
| C | 7324 | 6004 | 129 | 129 | 1.76% | 2.15% | 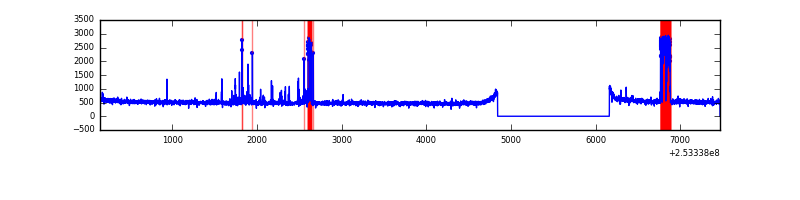 |
| D | 7323 | 6003 | 47 | 47 | 0.64% | 0.78% | 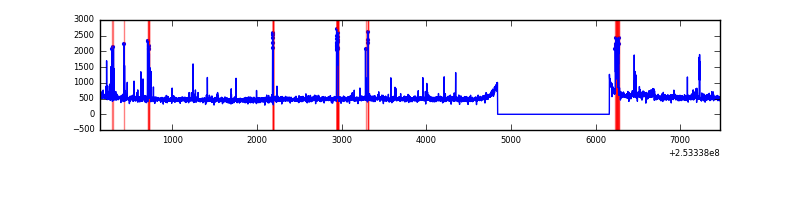 |
Top three noisy pixels from each quadrant. If the there are fewer than three noisy pixels in the level2.evt file, extra rows are filled as -1
| Pixel properties | Quadrant properties | ||||||
|---|---|---|---|---|---|---|---|
| Quadrant | DetID | PixID | Counts | Sigma | Mean | Median | Sigma |
| A | 1 | 162 | 238013 | 1542.3 | 770 | 757 | 153.8 |
| A | 1 | 178 | 130920 | 846.13 | 770 | 757 | 153.8 |
| A | 1 | 161 | 112227 | 724.62 | 770 | 757 | 153.8 |
| B | 2 | 32 | 6090507 | 65806.43 | 494 | 485 | 92.5 |
| B | 2 | 48 | 3809905 | 41163.12 | 494 | 485 | 92.5 |
| B | 4 | 239 | 263571 | 2842.81 | 494 | 485 | 92.5 |
| C | 15 | 208 | 333677 | 1906.72 | 761 | 769 | 174.6 |
| C | 12 | 4 | 75330 | 427.05 | 761 | 769 | 174.6 |
| C | 13 | 61 | 5609 | 27.72 | 761 | 769 | 174.6 |
| D | 1 | 52 | 274820 | 1548.23 | 752 | 734 | 177.0 |
| D | 10 | 199 | 107332 | 602.14 | 752 | 734 | 177.0 |
| D | 2 | 234 | 19799 | 107.69 | 752 | 734 | 177.0 |
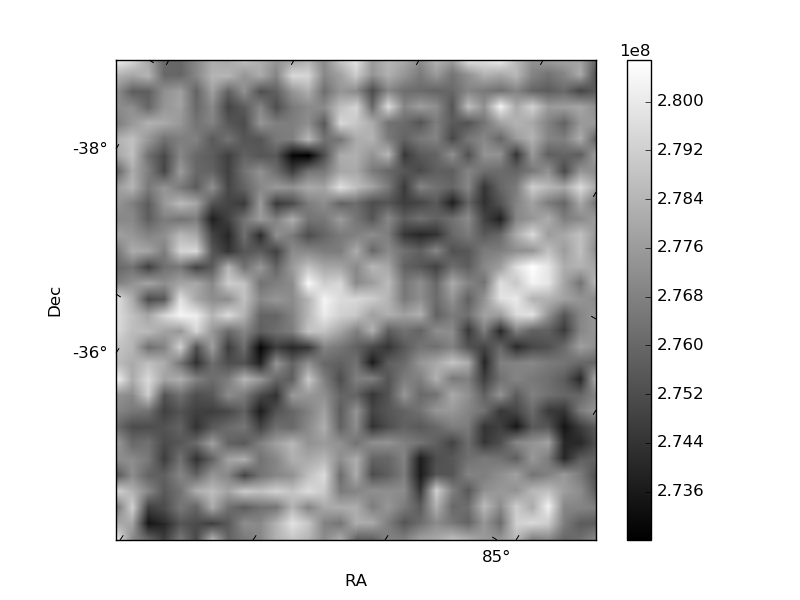
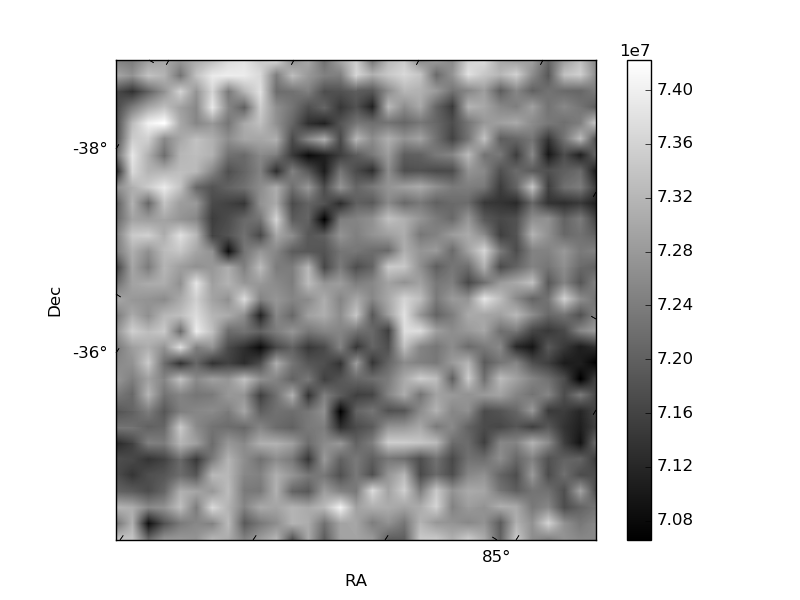
Histogram calculated using DETX and DETY for each event in the final _common_clean file
| Quadrant A | 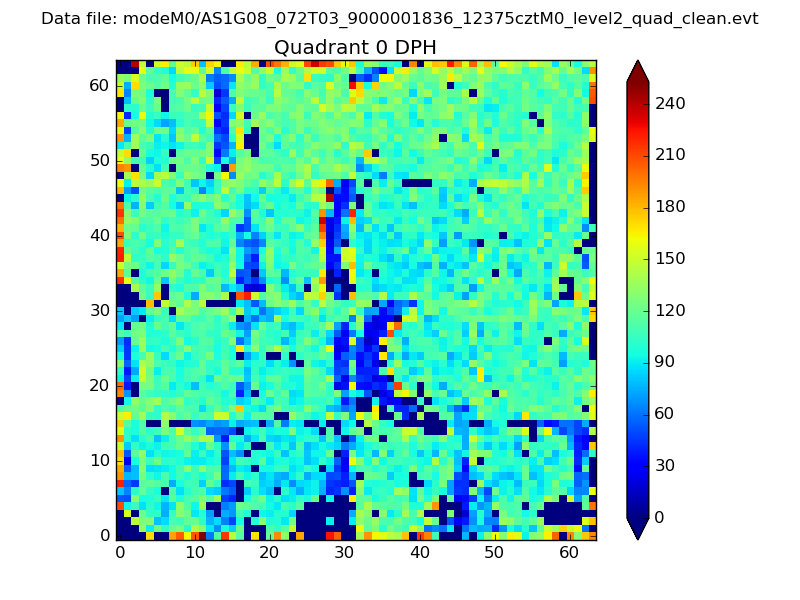 |
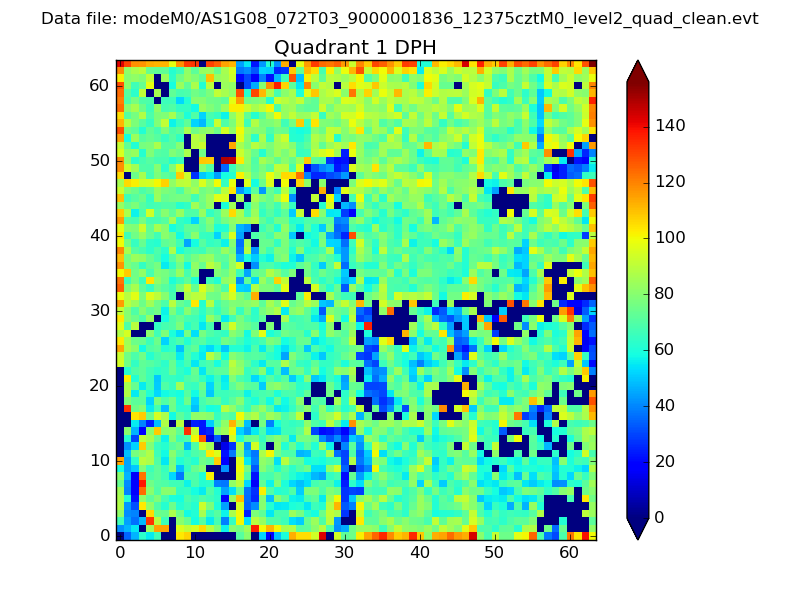 |
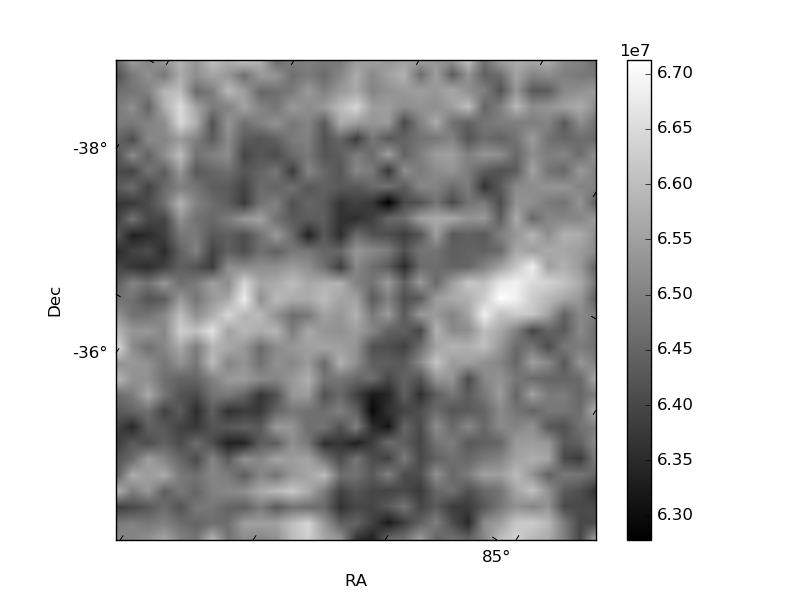
Quadrant B |
|---|---|---|---|
| Quadrant D | 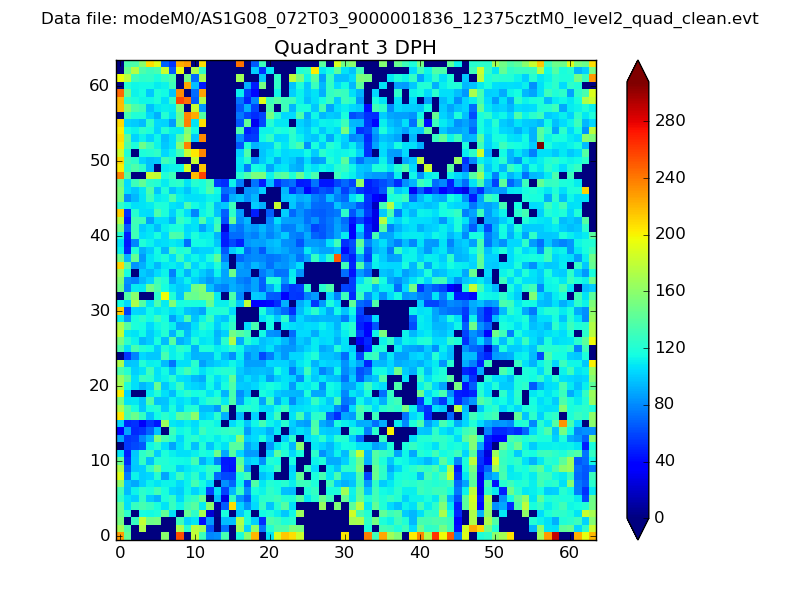 |
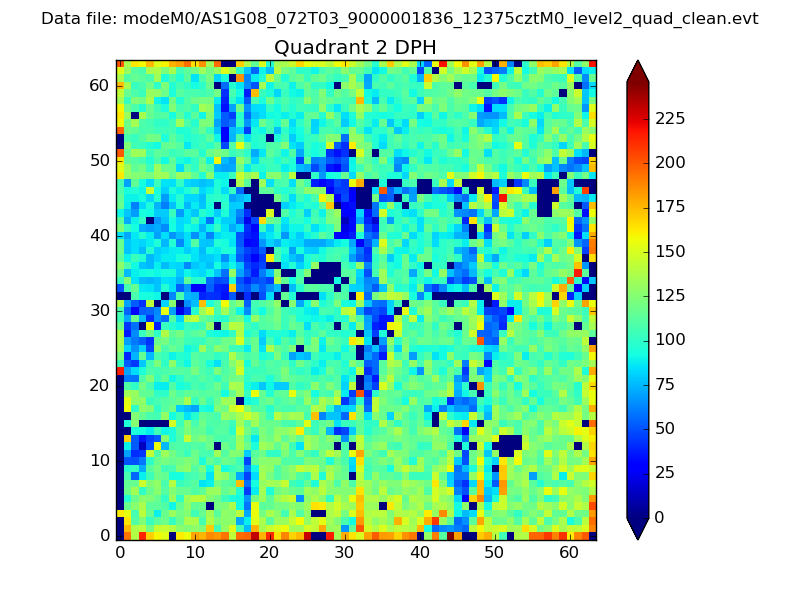 |
Quadrant C |
| Plot type | Count rate plots | Images |
|---|---|---|
| Comparison with Poisson distribution Blue bars denote a histogram of data divided into 1 sec bins. Red curve is a Poisson curve with rate = median count rate of data. |
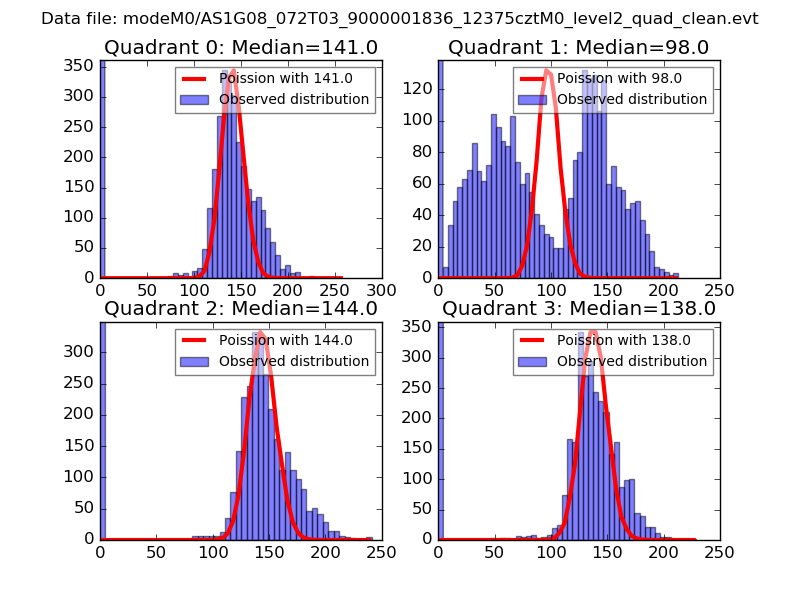 |
 |
| Quadrant-wise count rates Data is divided into 100 sec bins |
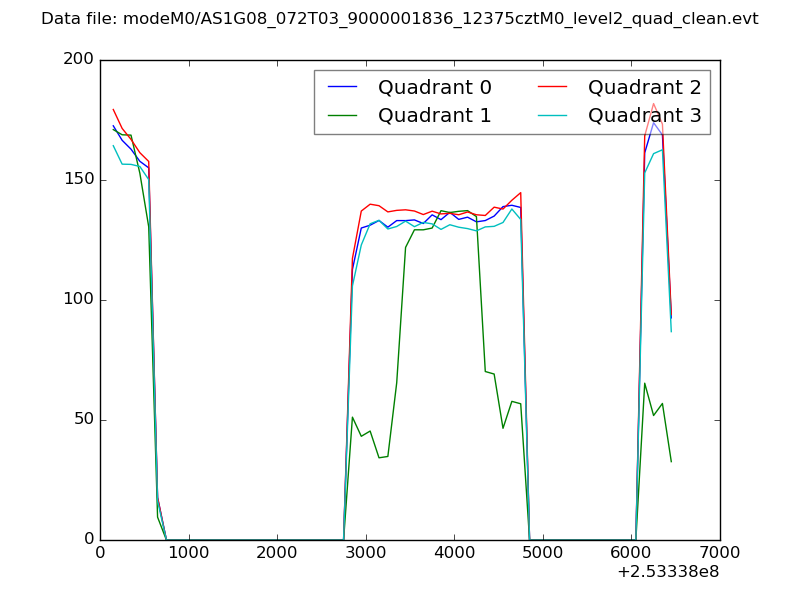 |
|
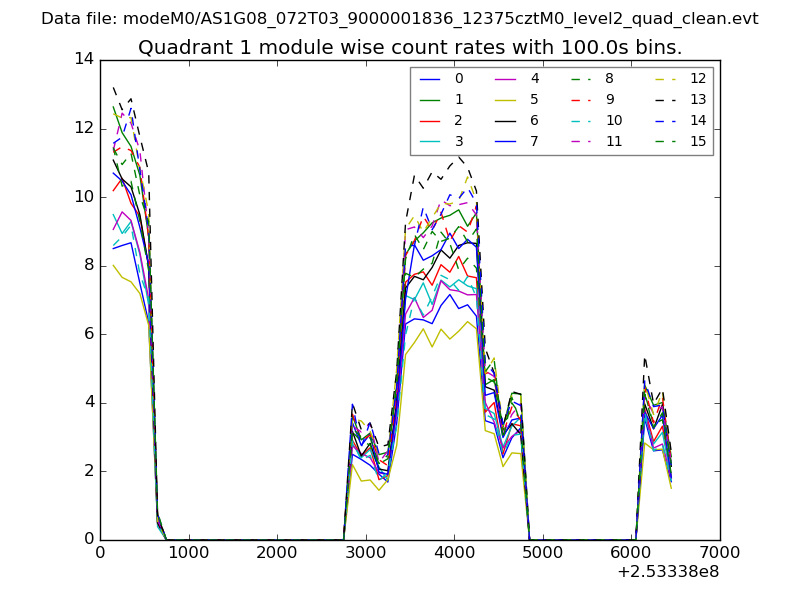
| Module-wise count rates for Quadrant A Data is divided into 100 sec bins |
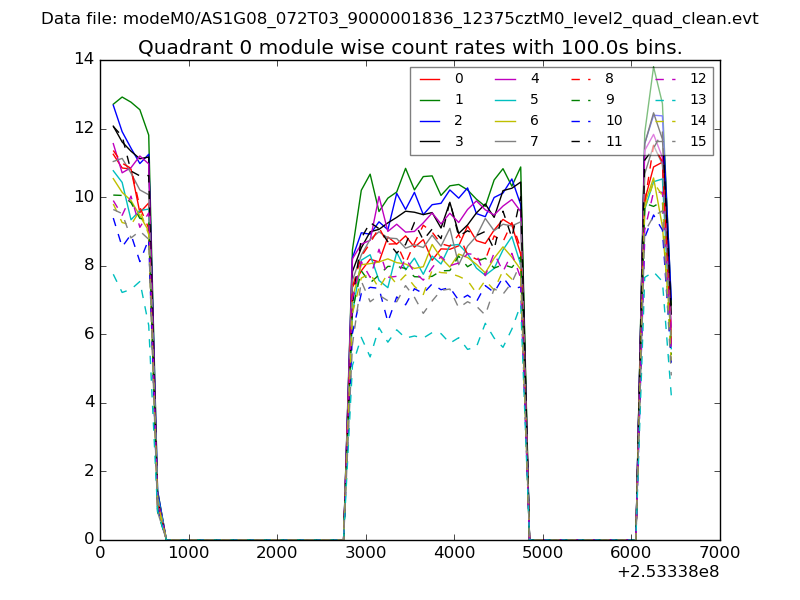 |
 |
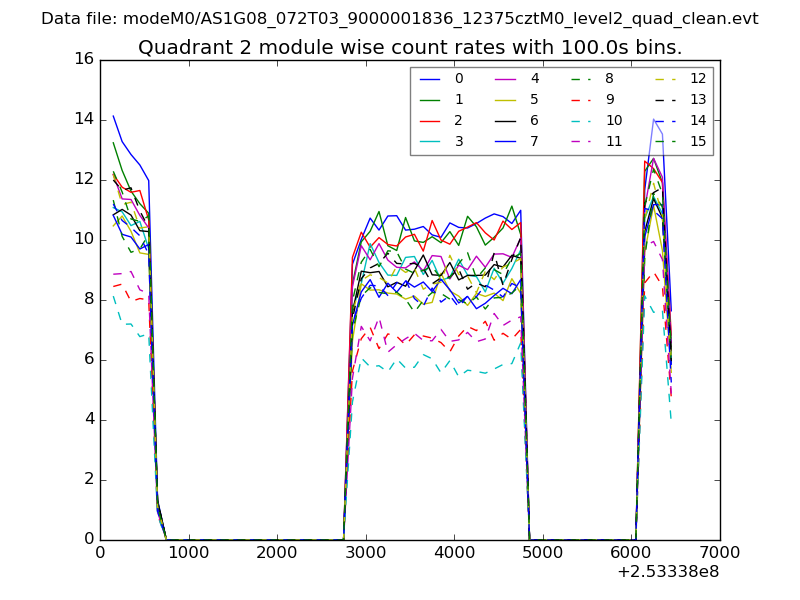
| Module-wise count rates for Quadrant B Data is divided into 100 sec bins |
 |
 |
| Module-wise count rates for Quadrant C Data is divided into 100 sec bins |
 |
 |
| Module-wise count rates for Quadrant D Data is divided into 100 sec bins |
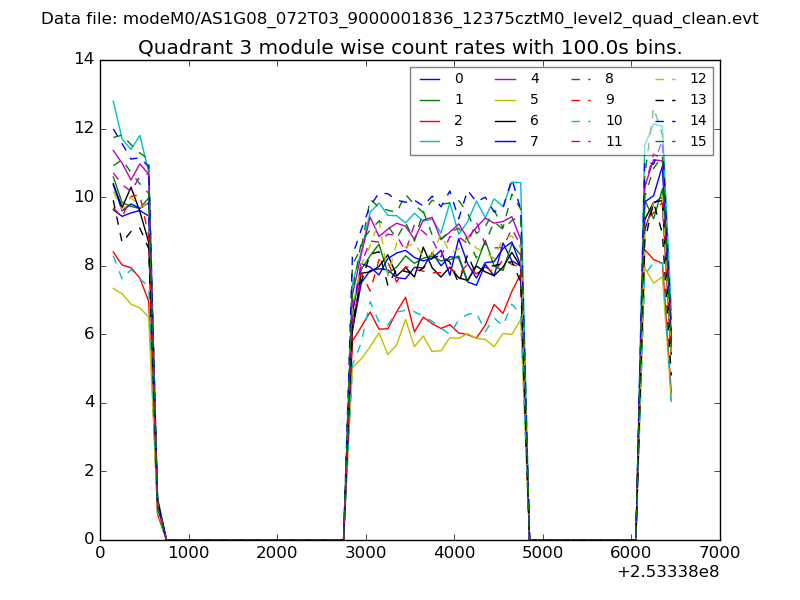 |
 |
| Parameter | Plot |
|---|---|
| CZT HV Monitor | 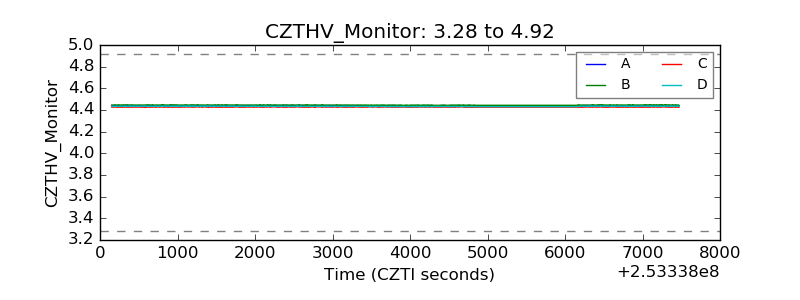 |
| D_VDD | 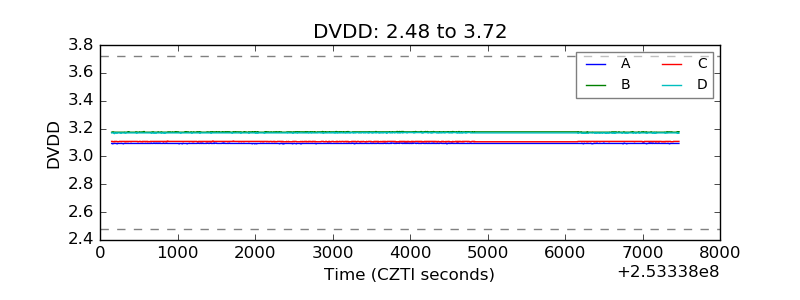 |
| Temperature 1 | 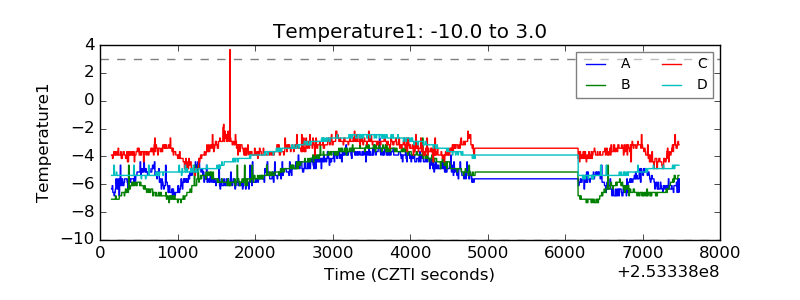 |
| Veto HV Monitor | 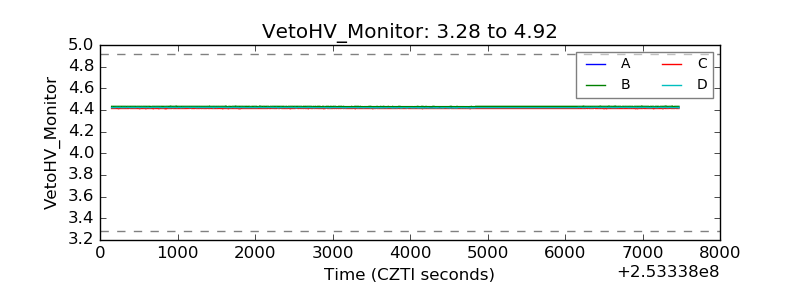 |
| Veto LLD | 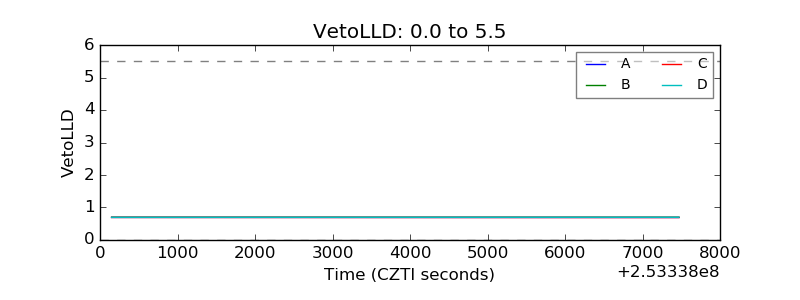 |
| Alpha Counter | 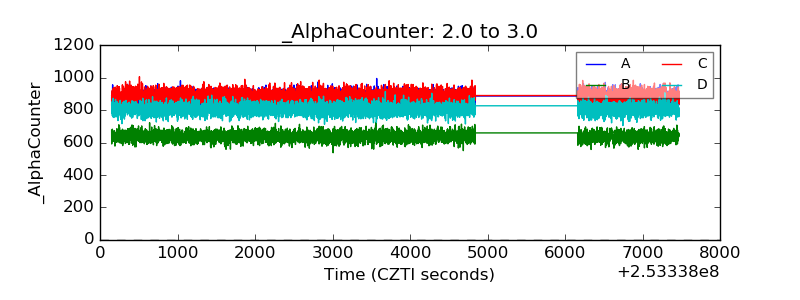 |
| _CPM_Rate | 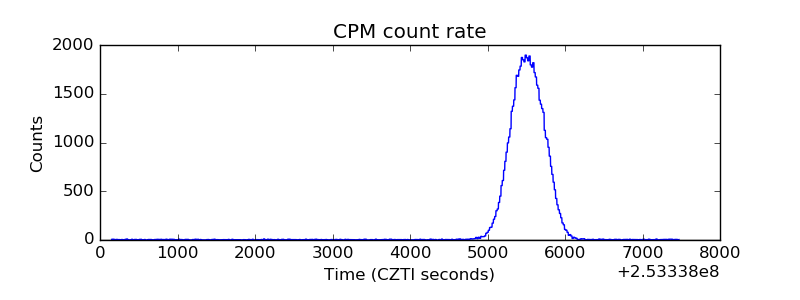 |
| CZT Counter | 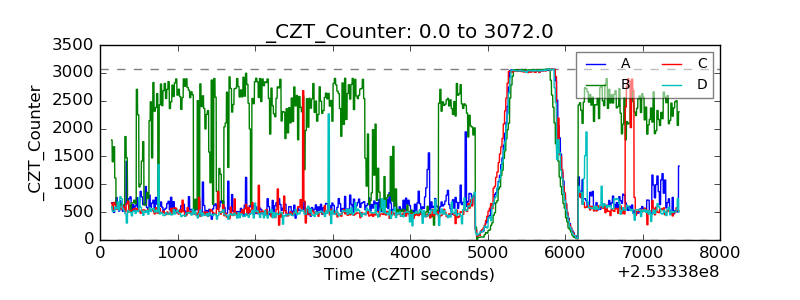 |
| +2.5 Volts monitor | 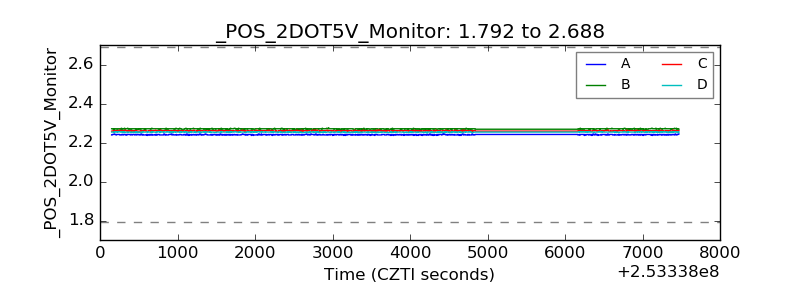 |
| +5 Volts monitor |  |
| _ROLL_ROT | 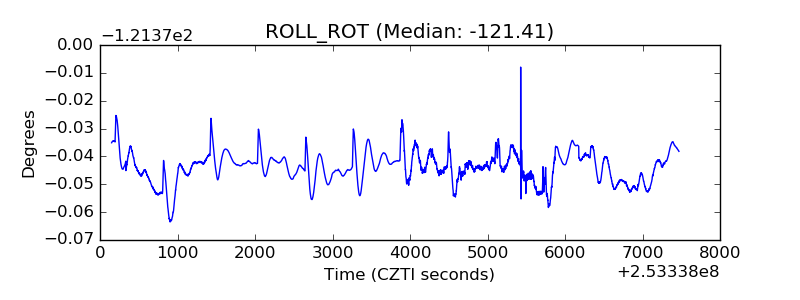 |
| _Roll_DEC | 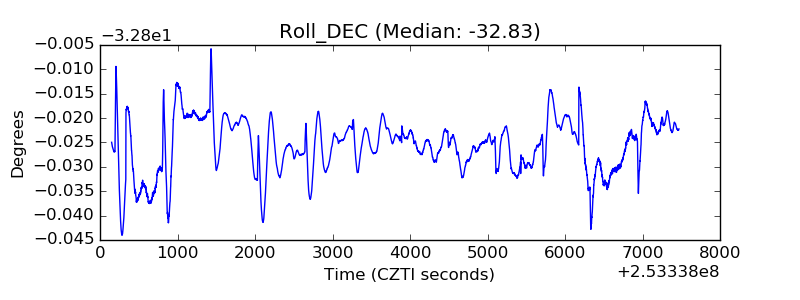 |
| _Roll_RA | 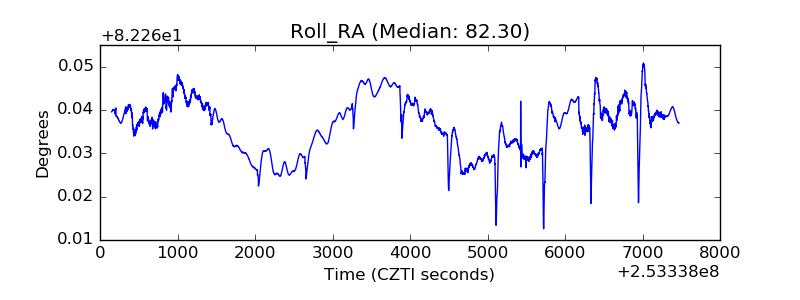 |
| Veto Counter | 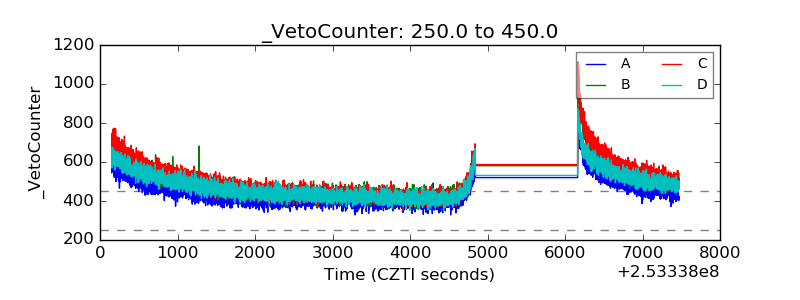 |