| Param | Original file | Final file |
|---|---|---|
| Filename | modeM0/AS1G08_072T03_9000001836_12376cztM0_level2.evt | modeM0/AS1G08_072T03_9000001836_12376cztM0_level2_quad_clean.evt |
| Size (bytes) | 875,125,440 | 57,795,840 |
| Size | 834.6 MB | 55.1 MB |
| Events in quadrant A | 3,883,699 | 387,831 |
| Events in quadrant B | 15,047,194 | 150,283 |
| Events in quadrant C | 3,517,811 | 396,794 |
| Events in quadrant D | 3,630,936 | 376,609 |
| Mode SS | |||
|---|---|---|---|
| Quadrant | BADHDUFLAG | Total packets | Discarded packets |
| A | 0 | 126 | 0 |
| B | 0 | 126 | 0 |
| C | 0 | 126 | 0 |
| D | 0 | 126 | 0 |
| Mode M0 | |||
|---|---|---|---|
| Quadrant | BADHDUFLAG | Total packets | Discarded packets |
| A | 0 | 15620 | 3 |
| B | 0 | 48951 | 2 |
| C | 0 | 14342 | 2 |
| D | 0 | 14768 | 2 |
| Mode M9 | |||
|---|---|---|---|
| Quadrant | BADHDUFLAG | Total packets | Discarded packets |
| A | 0 | 15 | 0 |
| B | 0 | 15 | 0 |
| C | 0 | 15 | 0 |
| D | 0 | 16 | 0 |
| Quadrant | Total seconds | Saturated seconds | Saturation percentage |
|---|---|---|---|
| A | 6266 | 135 | 2.154485% |
| B | 6266 | 5957 | 95.068624% |
| C | 6266 | 200 | 3.191829% |
| D | 6266 | 202 | 3.223747% |
Noise dominated data is calculated using 1-second bins in cleaned event files. If a bin has >2000 counts, and if more than 50% of those come from <1% of pixels, then it is considered to be noise-dominated and hence unusable.
| Quadrant | # 1 sec bins | Bins with >0 counts | Bins with >2000 counts | High rate bins dominated by noise | Noise dominated (total time) | Noise dominated (detector-on time) | Marked lightcurve |
|---|---|---|---|---|---|---|---|
| A | 7501 | 6266 | 0 | 0 | 0.00% | 0.00% | 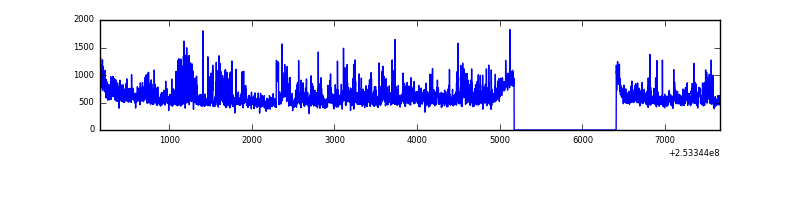 |
| B | 7501 | 6266 | 5738 | 5738 | 76.50% | 91.57% | 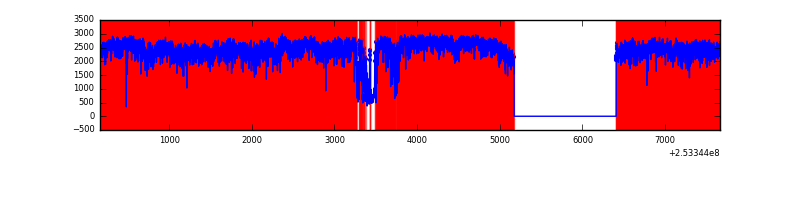 |
| C | 7501 | 6266 | 104 | 104 | 1.39% | 1.66% | 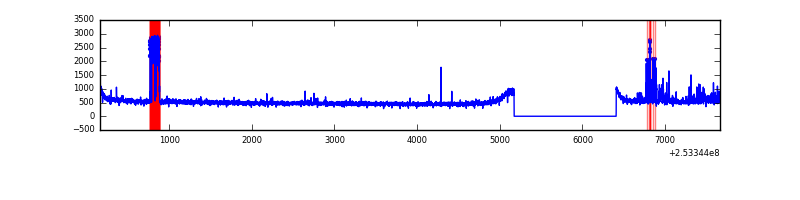 |
| D | 7501 | 6266 | 105 | 105 | 1.40% | 1.68% | 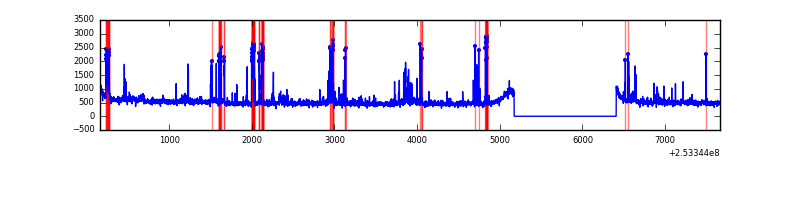 |
Top three noisy pixels from each quadrant. If the there are fewer than three noisy pixels in the level2.evt file, extra rows are filled as -1
| Pixel properties | Quadrant properties | ||||||
|---|---|---|---|---|---|---|---|
| Quadrant | DetID | PixID | Counts | Sigma | Mean | Median | Sigma |
| A | 1 | 162 | 171360 | 1061.74 | 809 | 795 | 160.6 |
| A | 13 | 251 | 117126 | 724.14 | 809 | 795 | 160.6 |
| A | 8 | 15 | 100588 | 621.2 | 809 | 795 | 160.6 |
| B | 2 | 48 | 7217978 | 89282.98 | 437 | 428 | 80.8 |
| B | 2 | 32 | 5799369 | 71734.42 | 437 | 428 | 80.8 |
| B | 4 | 239 | 312606 | 3861.72 | 437 | 428 | 80.8 |
| C | 15 | 208 | 392965 | 2134.42 | 798 | 803 | 183.7 |
| C | 6 | 96 | 12206 | 62.06 | 798 | 803 | 183.7 |
| C | 13 | 61 | 5798 | 27.19 | 798 | 803 | 183.7 |
| D | 1 | 52 | 441525 | 2331.22 | 791 | 769 | 189.1 |
| D | 10 | 199 | 116800 | 613.7 | 791 | 769 | 189.1 |
| D | 7 | 71 | 43616 | 226.62 | 791 | 769 | 189.1 |
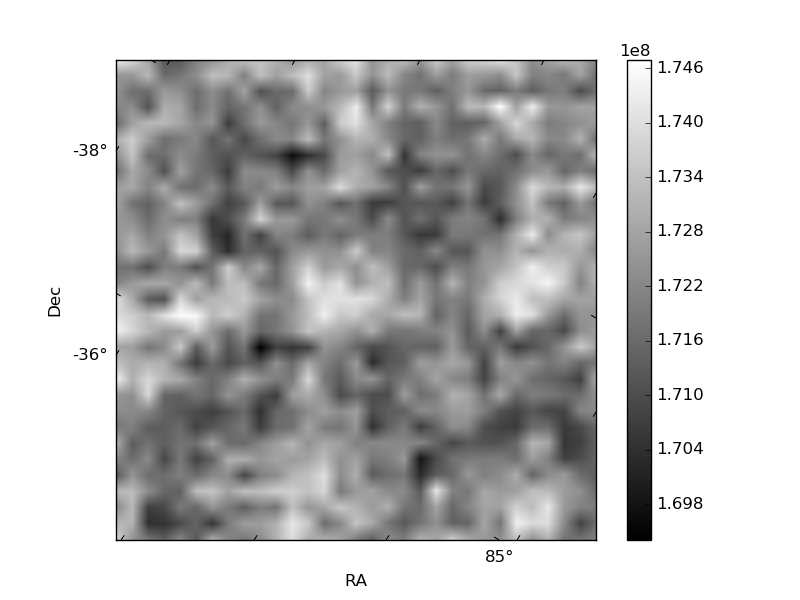
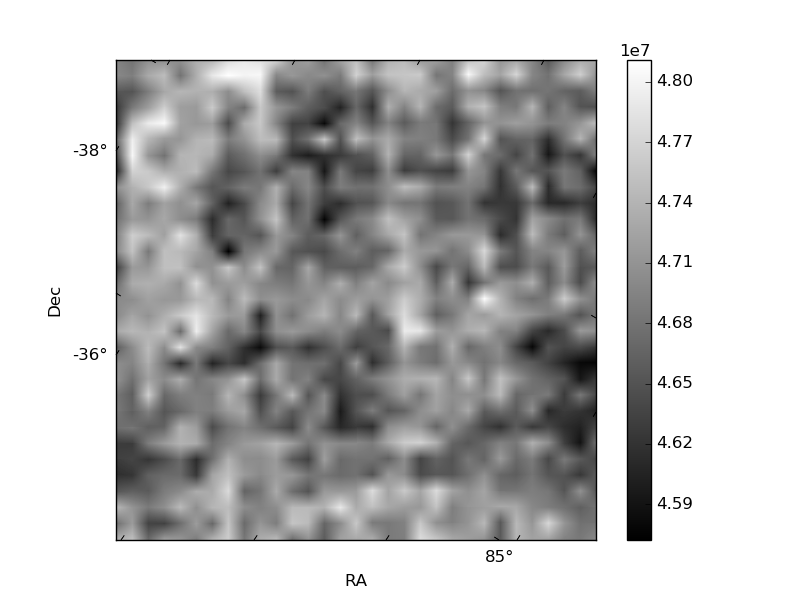
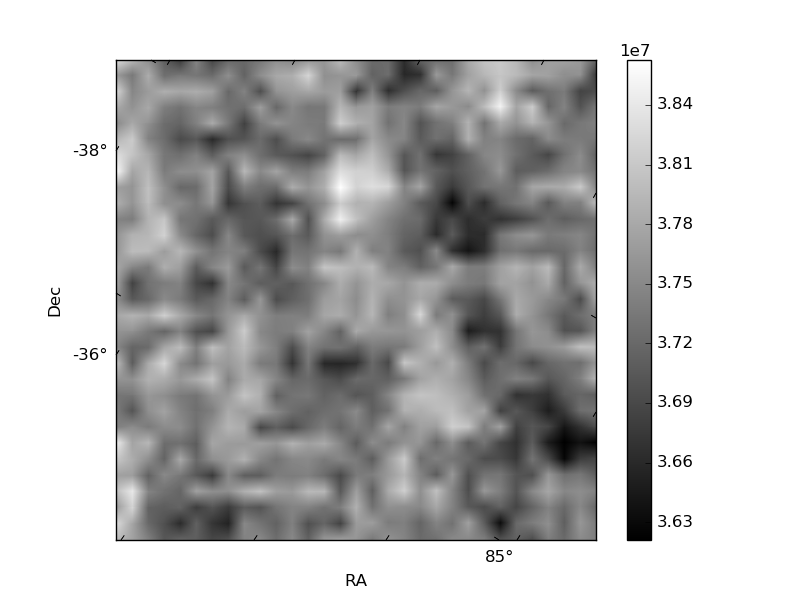
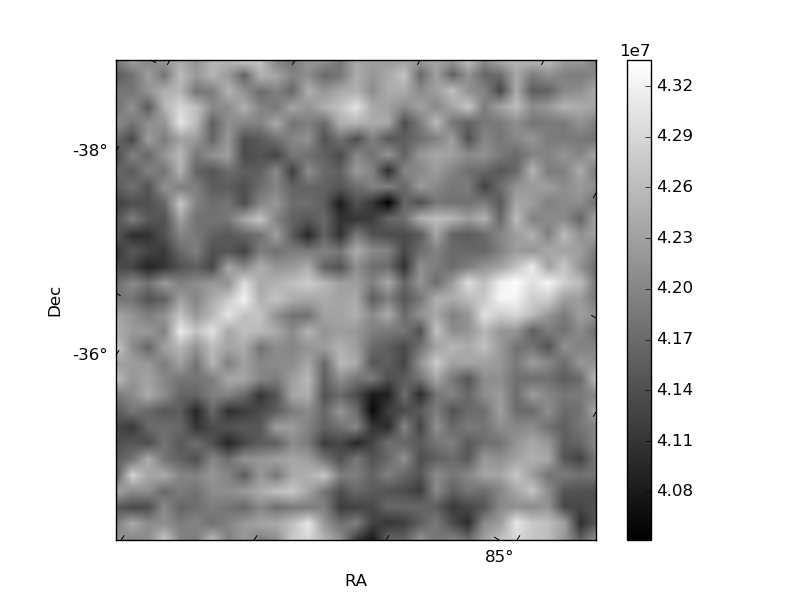
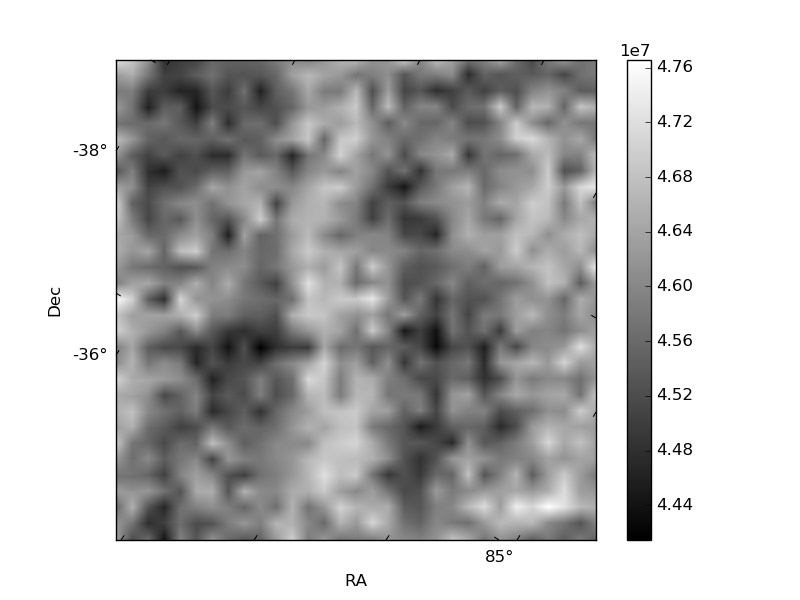
Histogram calculated using DETX and DETY for each event in the final _common_clean file
| Quadrant A | 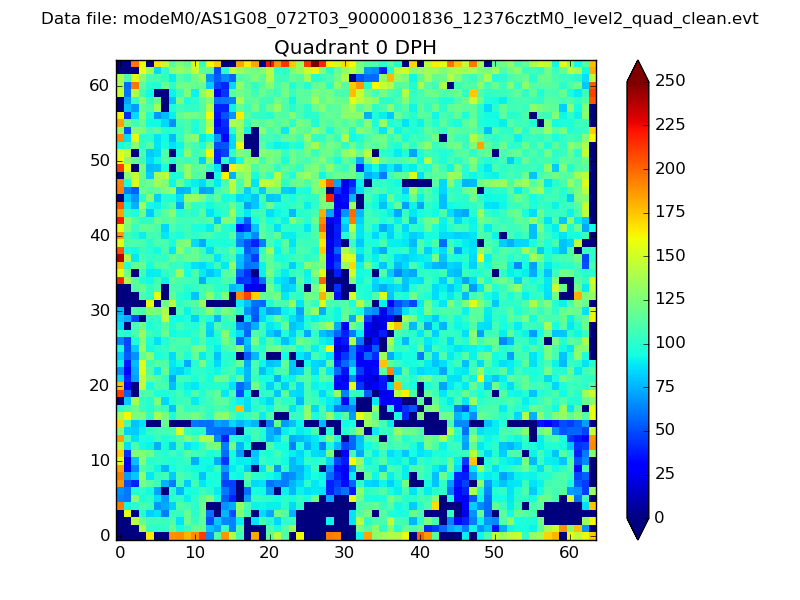 |
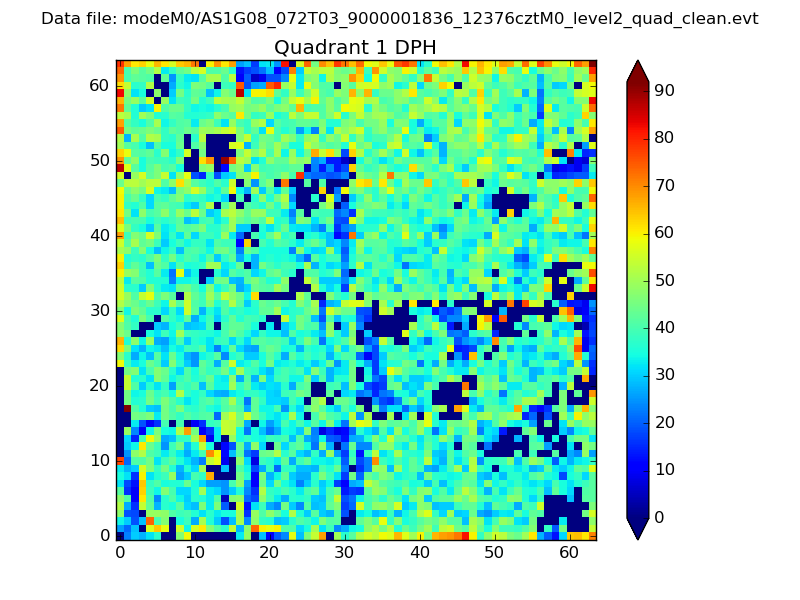 |
Quadrant B |
|---|---|---|---|
| Quadrant D | 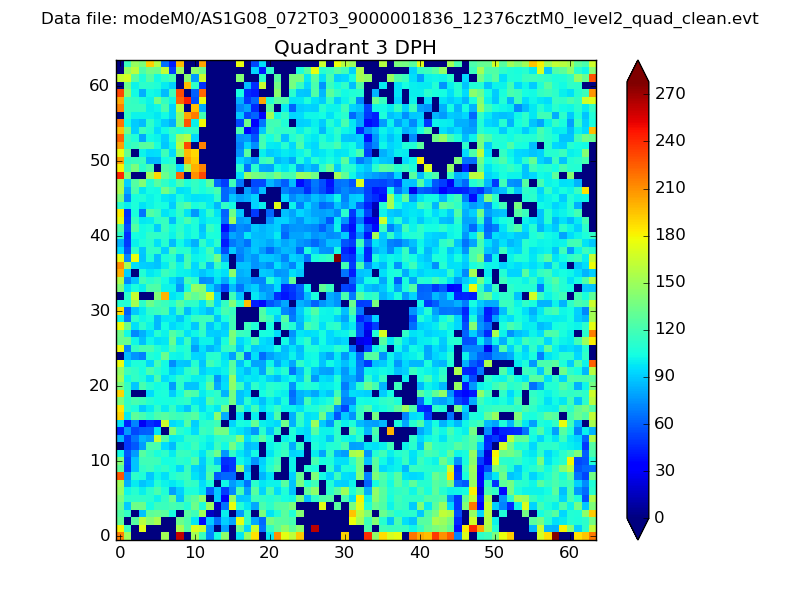 |
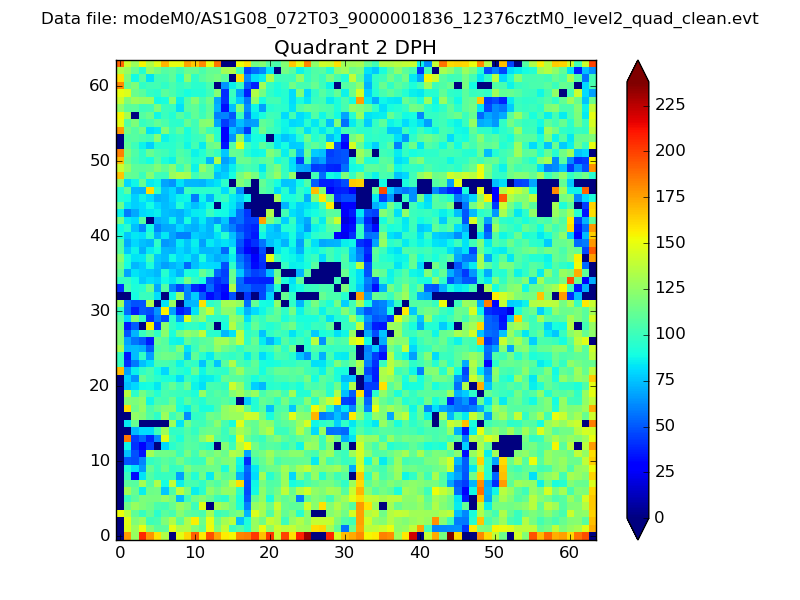 |
Quadrant C |
| Plot type | Count rate plots | Images |
|---|---|---|
| Comparison with Poisson distribution Blue bars denote a histogram of data divided into 1 sec bins. Red curve is a Poisson curve with rate = median count rate of data. |
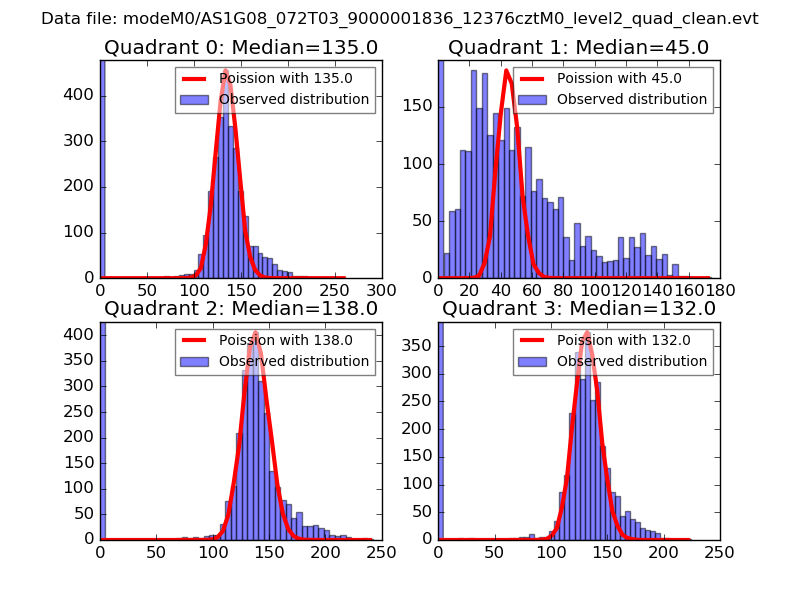 |
 |
| Quadrant-wise count rates Data is divided into 100 sec bins |
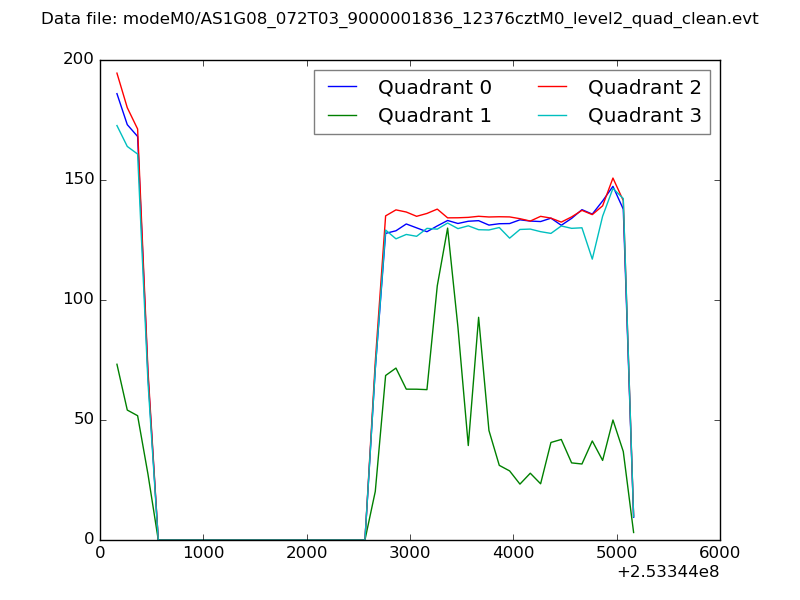 |
|
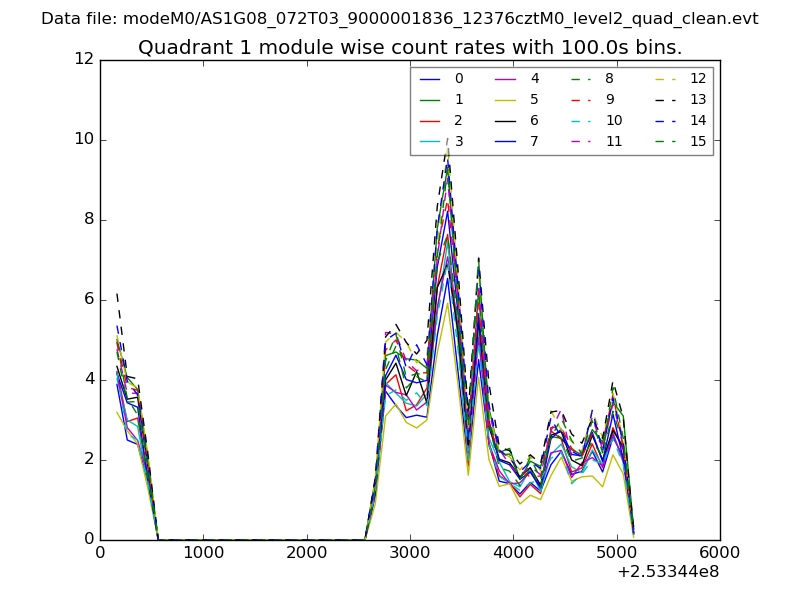
| Module-wise count rates for Quadrant A Data is divided into 100 sec bins |
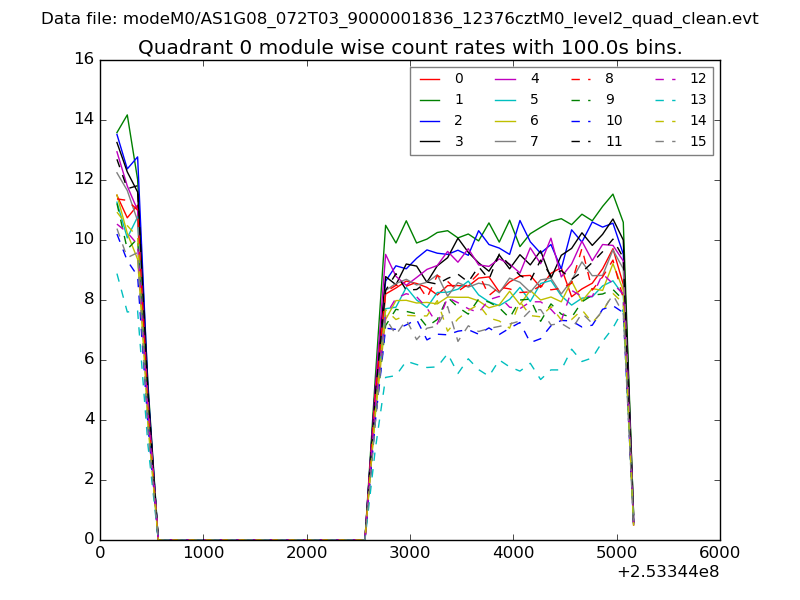 |
 |
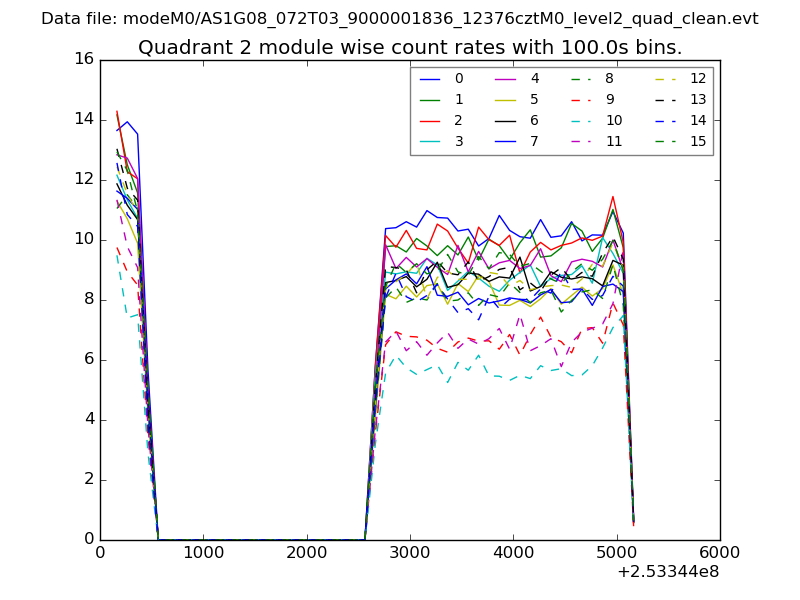
| Module-wise count rates for Quadrant B Data is divided into 100 sec bins |
 |
 |
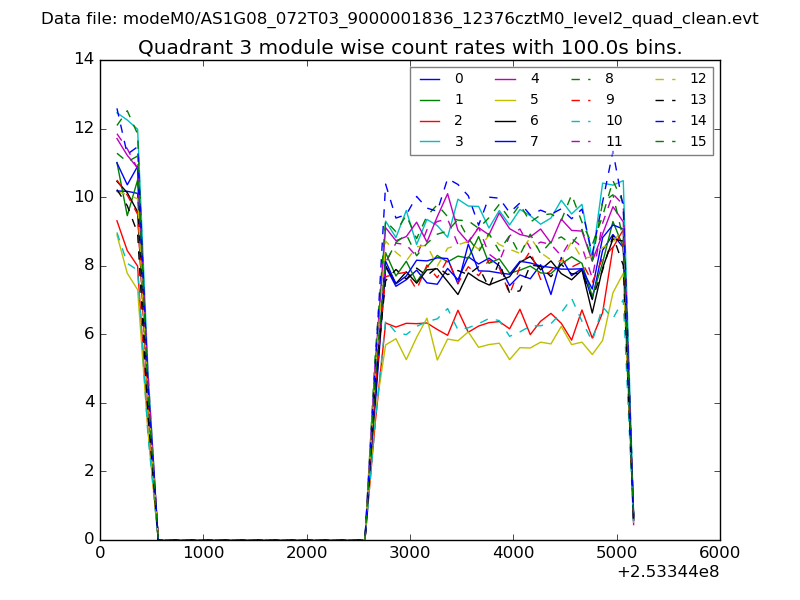
| Module-wise count rates for Quadrant C Data is divided into 100 sec bins |
 |
 |
| Module-wise count rates for Quadrant D Data is divided into 100 sec bins |
 |
 |
| Parameter | Plot |
|---|---|
| CZT HV Monitor | 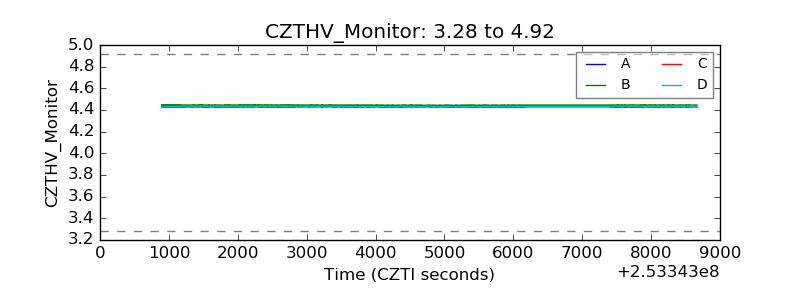 |
| D_VDD | 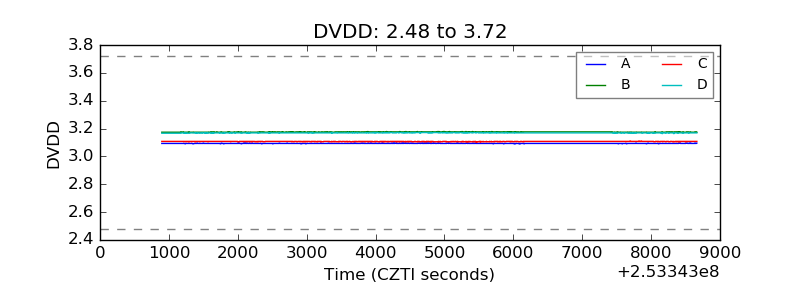 |
| Temperature 1 | 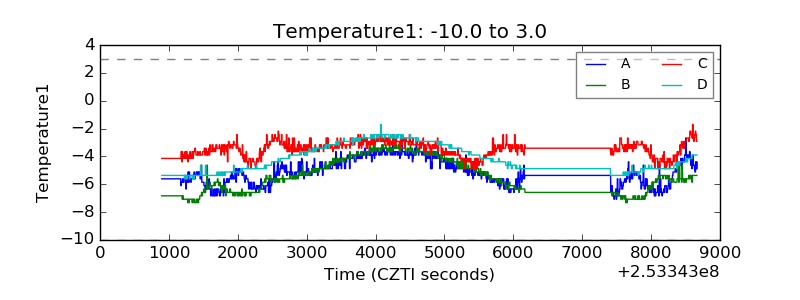 |
| Veto HV Monitor |  |
| Veto LLD | 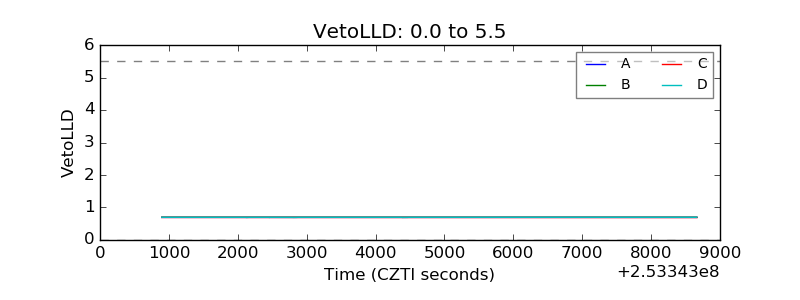 |
| Alpha Counter | 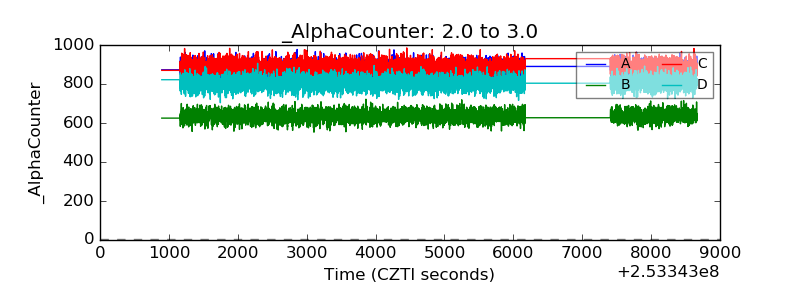 |
| _CPM_Rate | 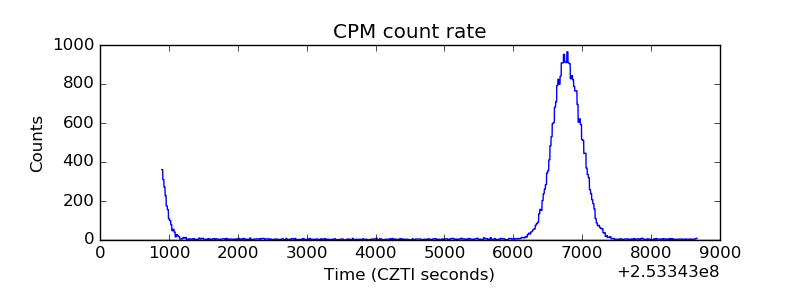 |
| CZT Counter | 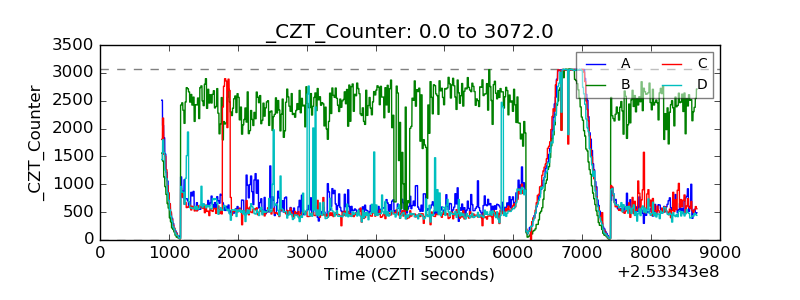 |
| +2.5 Volts monitor | 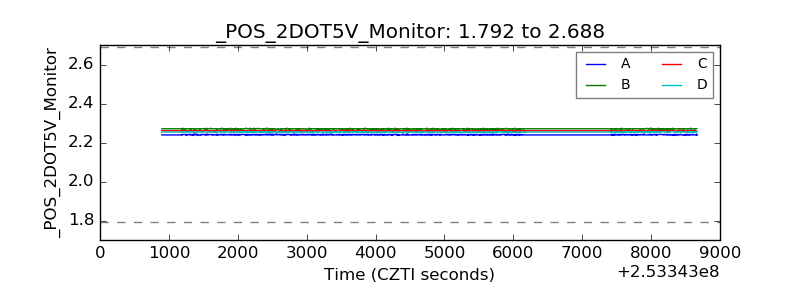 |
| +5 Volts monitor |  |
| _ROLL_ROT | 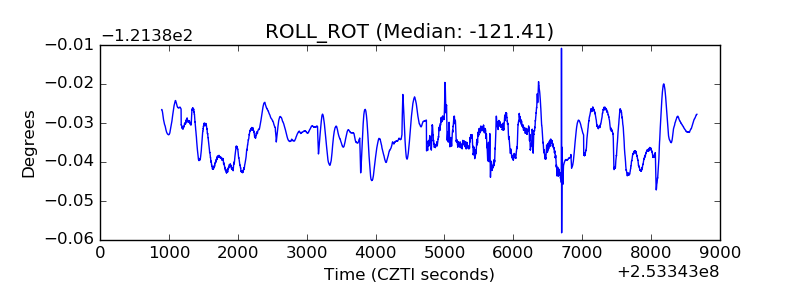 |
| _Roll_DEC | 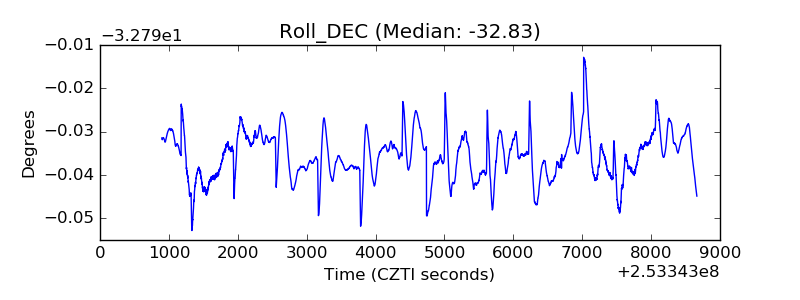 |
| _Roll_RA | 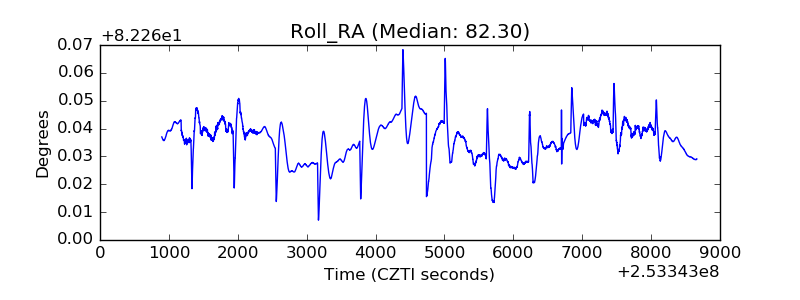 |
| Veto Counter | 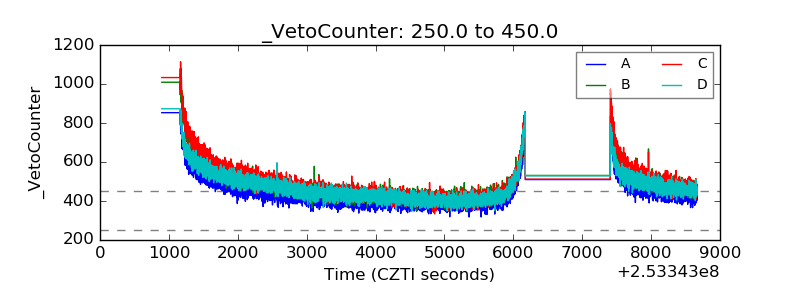 |