| Param | Original file | Final file |
|---|---|---|
| Filename | modeM0/AS1G08_072T03_9000001836_12378cztM0_level2.evt | modeM0/AS1G08_072T03_9000001836_12378cztM0_level2_quad_clean.evt |
| Size (bytes) | 933,534,720 | 79,824,960 |
| Size | 890.3 MB | 76.1 MB |
| Events in quadrant A | 4,367,428 | 512,153 |
| Events in quadrant B | 13,281,426 | 387,424 |
| Events in quadrant C | 5,444,942 | 508,167 |
| Events in quadrant D | 4,681,514 | 496,545 |
| Mode SS | |||
|---|---|---|---|
| Quadrant | BADHDUFLAG | Total packets | Discarded packets |
| A | 0 | 150 | 0 |
| B | 0 | 150 | 0 |
| C | 0 | 150 | 0 |
| D | 0 | 150 | 0 |
| Mode M0 | |||
|---|---|---|---|
| Quadrant | BADHDUFLAG | Total packets | Discarded packets |
| A | 0 | 17716 | 3 |
| B | 0 | 44485 | 2 |
| C | 0 | 21193 | 2 |
| D | 0 | 18886 | 2 |
| Mode M9 | |||
|---|---|---|---|
| Quadrant | BADHDUFLAG | Total packets | Discarded packets |
| A | 0 | 18 | 0 |
| B | 0 | 18 | 0 |
| C | 0 | 18 | 0 |
| D | 0 | 18 | 0 |
| Quadrant | Total seconds | Saturated seconds | Saturation percentage |
|---|---|---|---|
| A | 7358 | 308 | 4.185920% |
| B | 7358 | 4753 | 64.596358% |
| C | 7358 | 546 | 7.420495% |
| D | 7358 | 369 | 5.014950% |
Noise dominated data is calculated using 1-second bins in cleaned event files. If a bin has >2000 counts, and if more than 50% of those come from <1% of pixels, then it is considered to be noise-dominated and hence unusable.
| Quadrant | # 1 sec bins | Bins with >0 counts | Bins with >2000 counts | High rate bins dominated by noise | Noise dominated (total time) | Noise dominated (detector-on time) | Marked lightcurve |
|---|---|---|---|---|---|---|---|
| A | 9109 | 7359 | 5 | 5 | 0.05% | 0.07% | 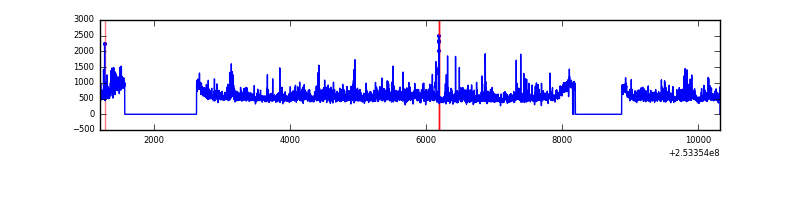 |
| B | 9108 | 7358 | 4434 | 4434 | 48.68% | 60.26% | 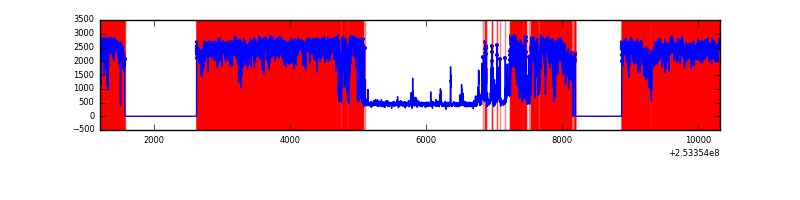 |
| C | 9109 | 7359 | 287 | 287 | 3.15% | 3.90% | 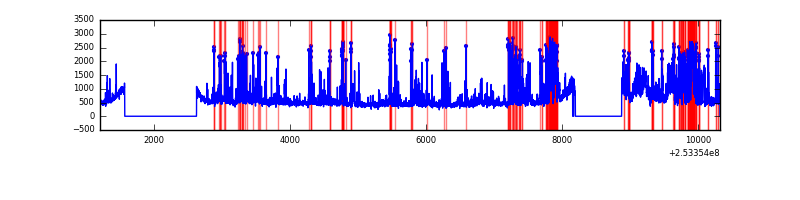 |
| D | 9109 | 7359 | 159 | 159 | 1.75% | 2.16% | 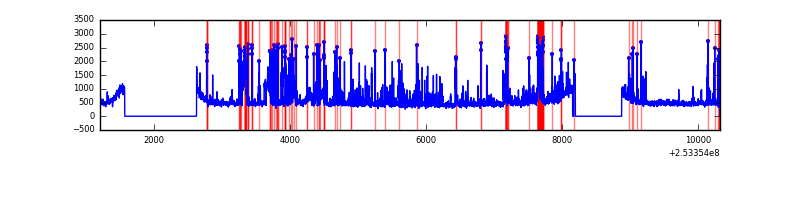 |
Top three noisy pixels from each quadrant. If the there are fewer than three noisy pixels in the level2.evt file, extra rows are filled as -1
| Pixel properties | Quadrant properties | ||||||
|---|---|---|---|---|---|---|---|
| Quadrant | DetID | PixID | Counts | Sigma | Mean | Median | Sigma |
| A | 1 | 162 | 243350 | 1298.71 | 915 | 896 | 186.7 |
| A | 13 | 251 | 172735 | 920.46 | 915 | 896 | 186.7 |
| A | 1 | 178 | 122241 | 649.99 | 915 | 896 | 186.7 |
| B | 2 | 32 | 5941662 | 53202.04 | 584 | 571 | 111.7 |
| B | 2 | 48 | 4516719 | 40441.78 | 584 | 571 | 111.7 |
| B | 4 | 239 | 253950 | 2268.99 | 584 | 571 | 111.7 |
| C | 15 | 208 | 1869411 | 9050.57 | 887 | 895 | 206.5 |
| C | 14 | 234 | 108364 | 520.55 | 887 | 895 | 206.5 |
| C | 13 | 61 | 6571 | 27.49 | 887 | 895 | 206.5 |
| D | 1 | 52 | 1113790 | 5187.05 | 892 | 867 | 214.6 |
| D | 13 | 104 | 83421 | 384.76 | 892 | 867 | 214.6 |
| D | 8 | 195 | 46553 | 212.93 | 892 | 867 | 214.6 |
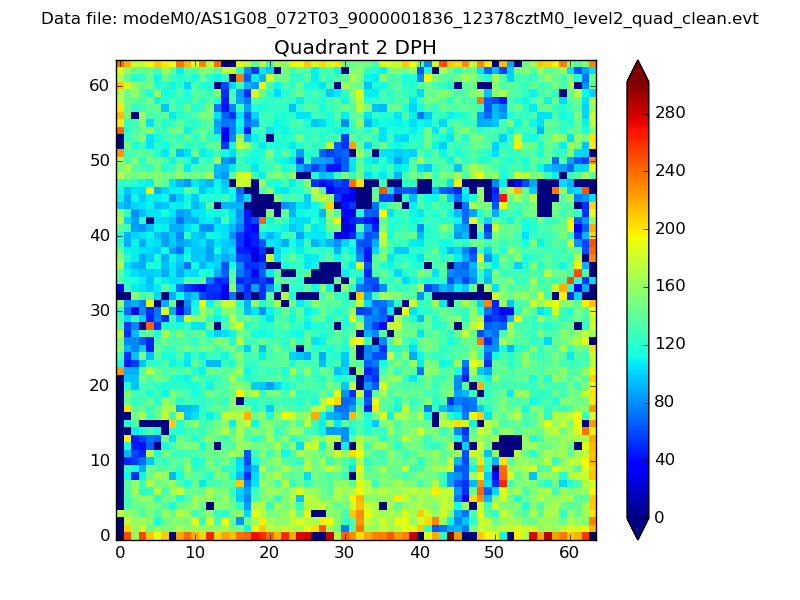
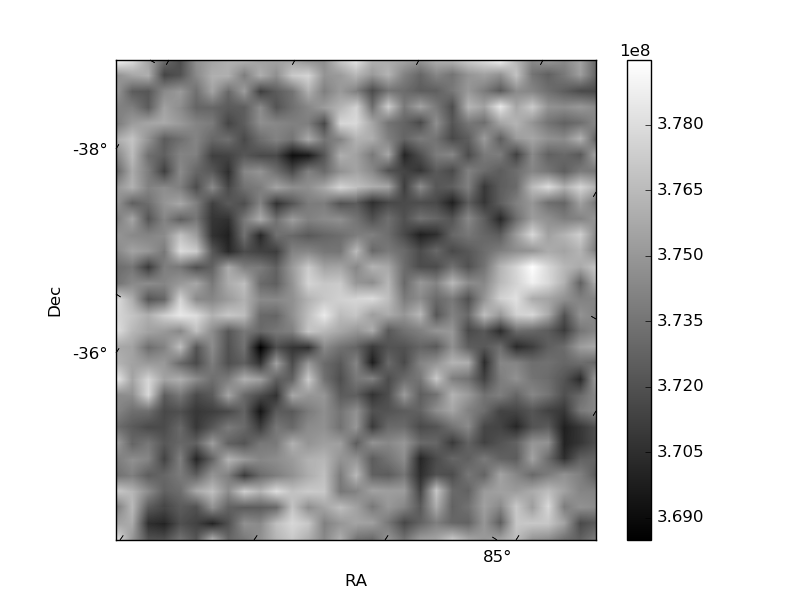
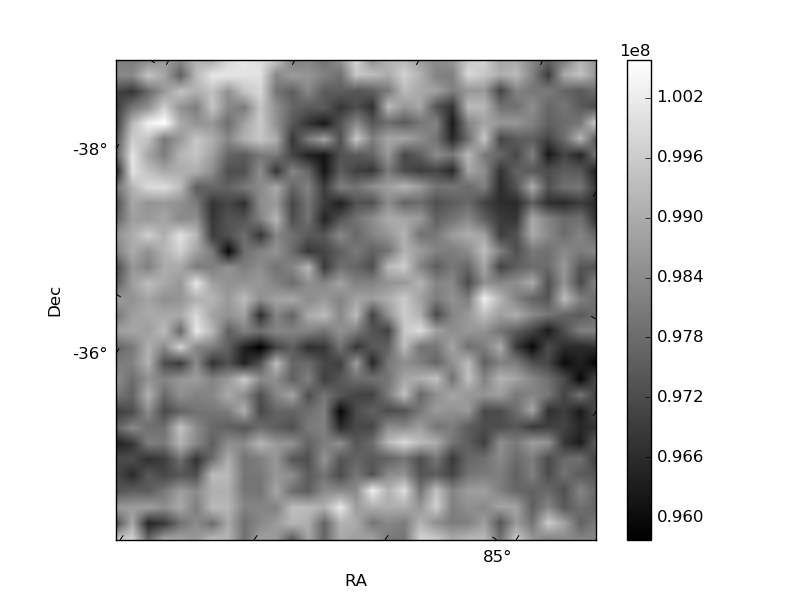
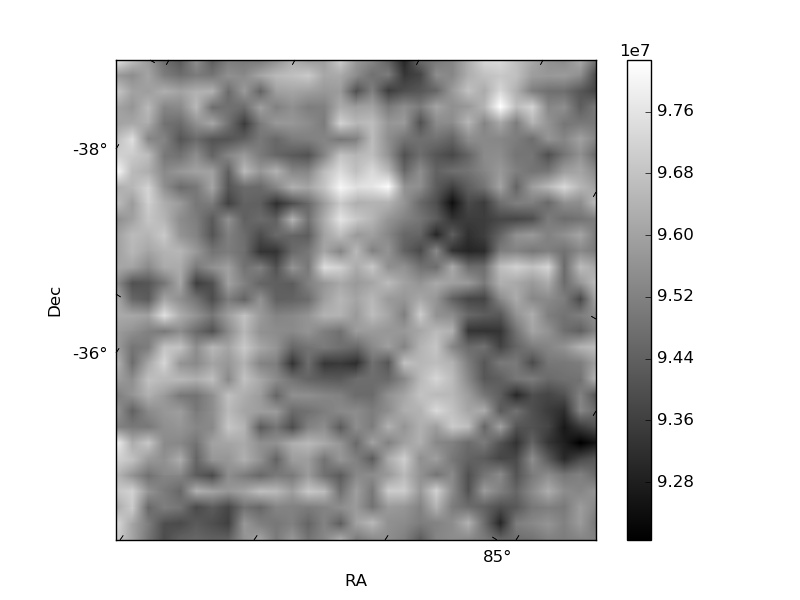
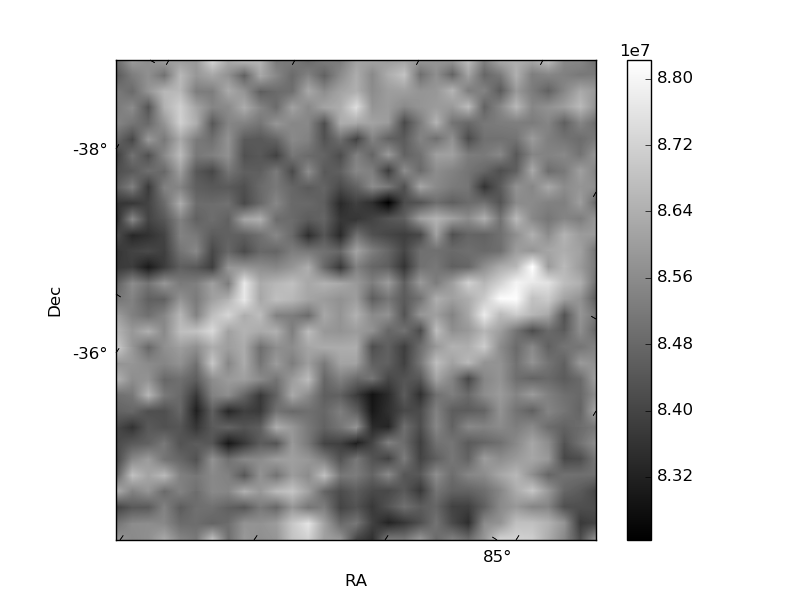
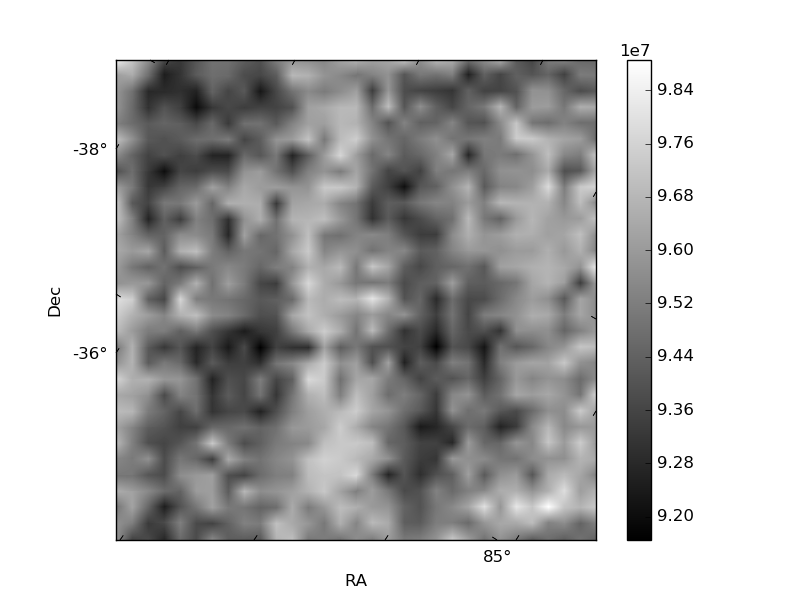
Histogram calculated using DETX and DETY for each event in the final _common_clean file
| Quadrant A | 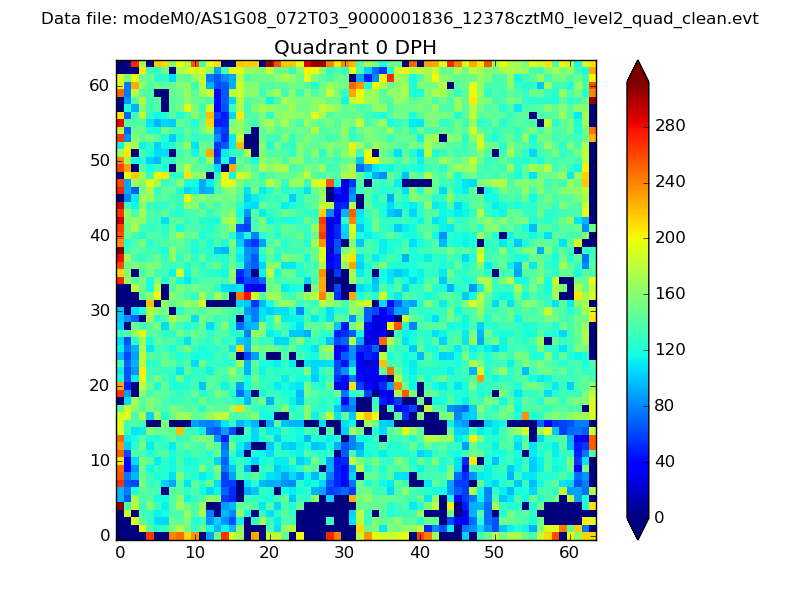 |
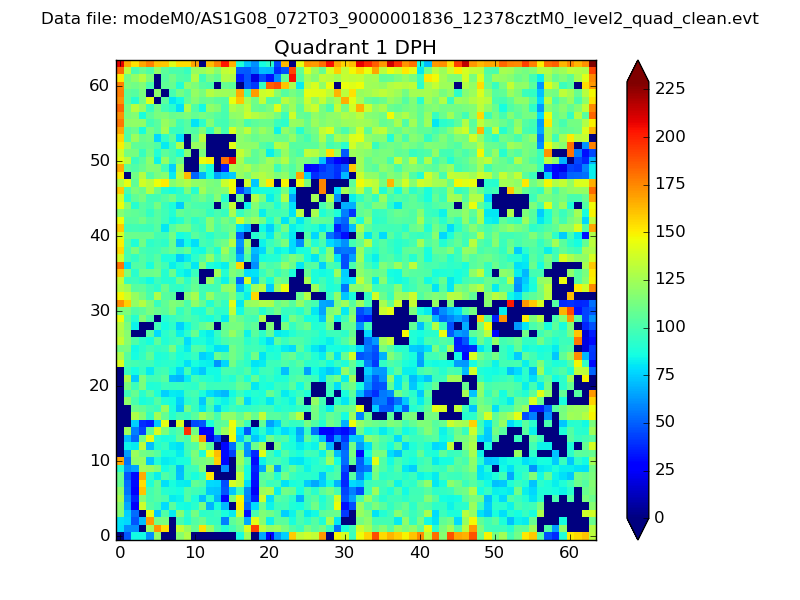 |
Quadrant B |
|---|---|---|---|
| Quadrant D | 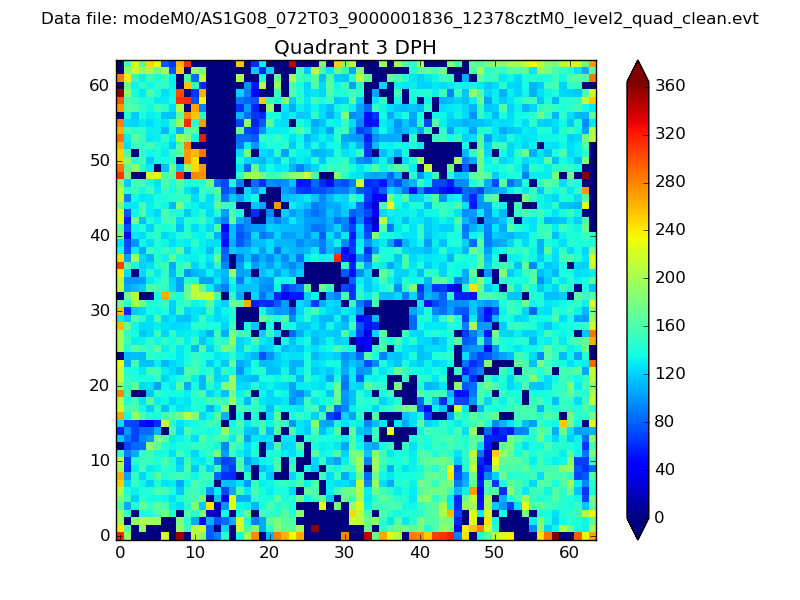 |
 |
Quadrant C |
| Plot type | Count rate plots | Images |
|---|---|---|
| Comparison with Poisson distribution Blue bars denote a histogram of data divided into 1 sec bins. Red curve is a Poisson curve with rate = median count rate of data. |
 |
 |
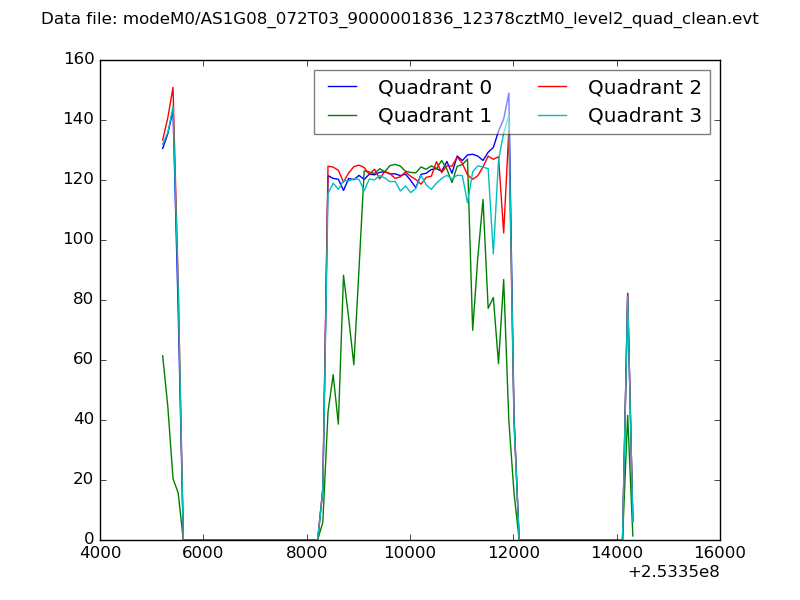
| Quadrant-wise count rates Data is divided into 100 sec bins |
 |
|
| Module-wise count rates for Quadrant A Data is divided into 100 sec bins |
 |
 |
| Module-wise count rates for Quadrant B Data is divided into 100 sec bins |
 |
 |
| Module-wise count rates for Quadrant C Data is divided into 100 sec bins |
 |
 |
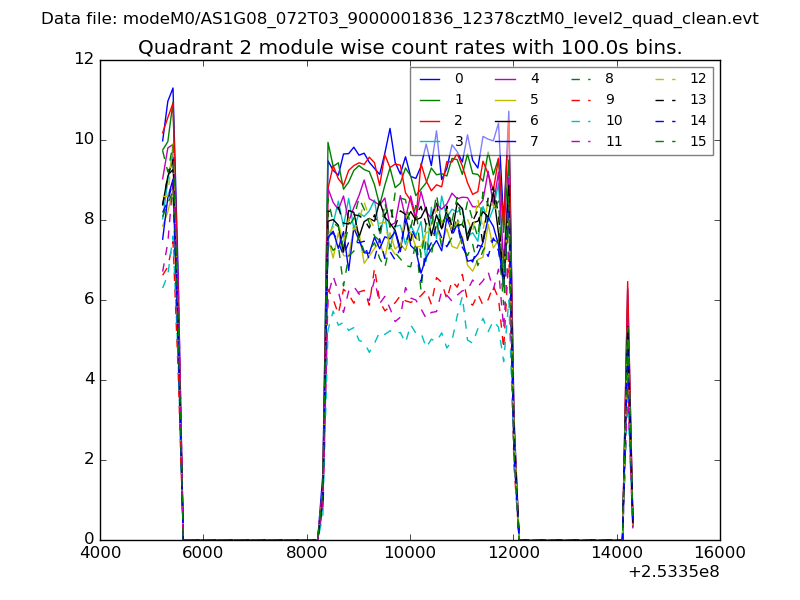
| Module-wise count rates for Quadrant D Data is divided into 100 sec bins |
 |
 |
| Parameter | Plot |
|---|---|
| CZT HV Monitor |  |
| D_VDD | 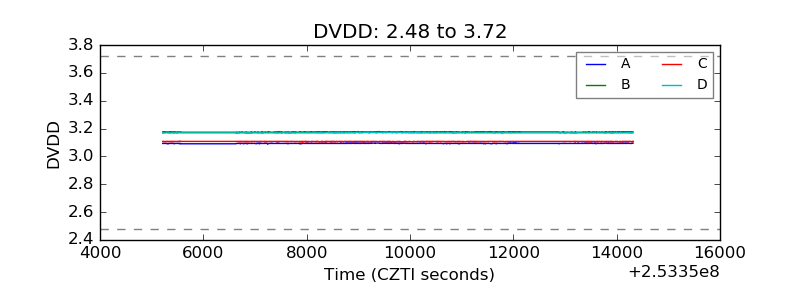 |
| Temperature 1 | 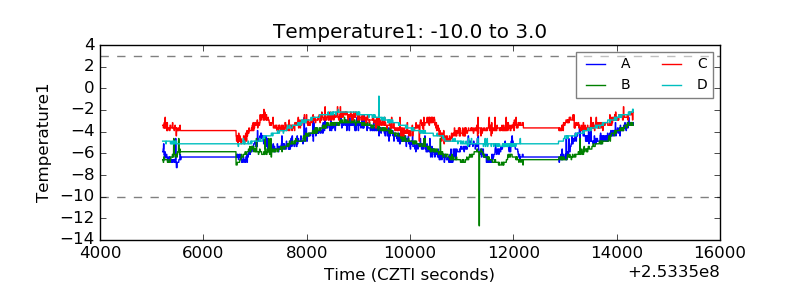 |
| Veto HV Monitor | 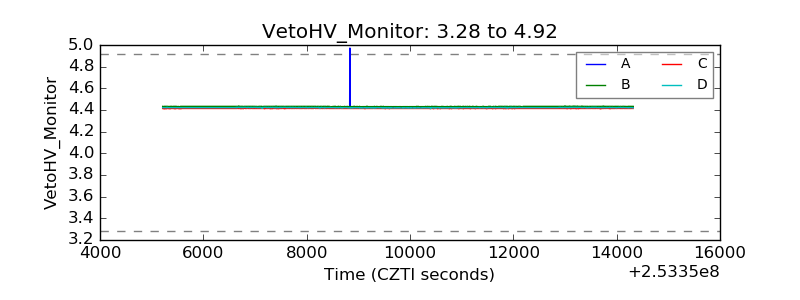 |
| Veto LLD |  |
| Alpha Counter | 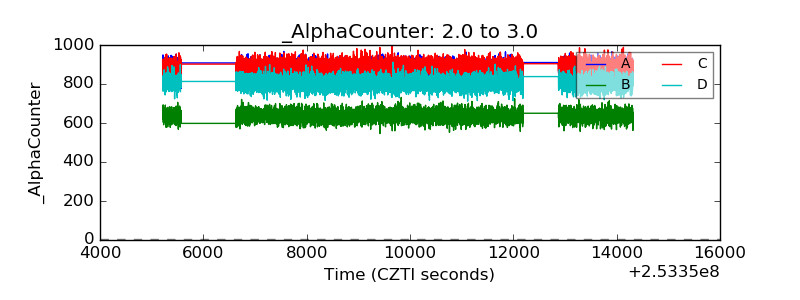 |
| _CPM_Rate | 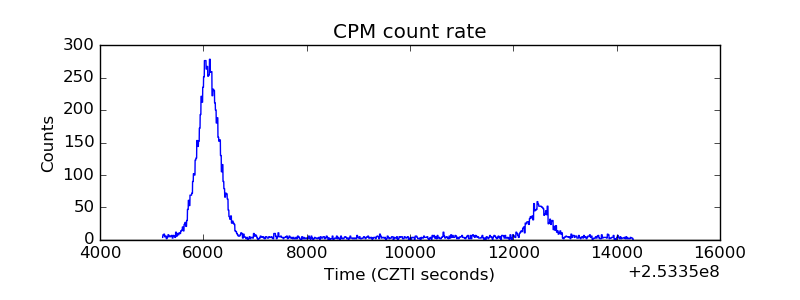 |
| CZT Counter | 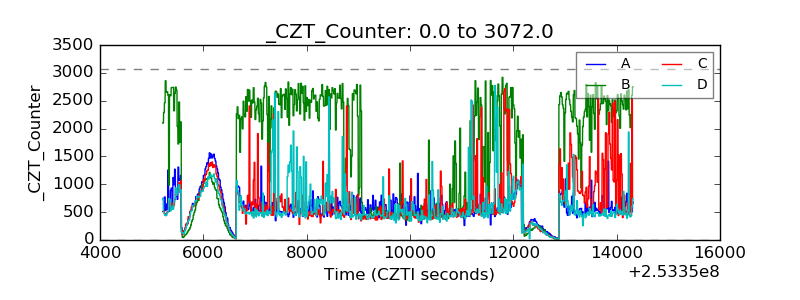 |
| +2.5 Volts monitor |  |
| +5 Volts monitor |  |
| _ROLL_ROT |  |
| _Roll_DEC | 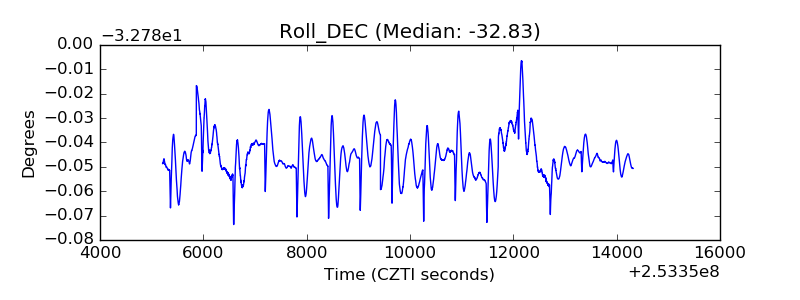 |
| _Roll_RA | 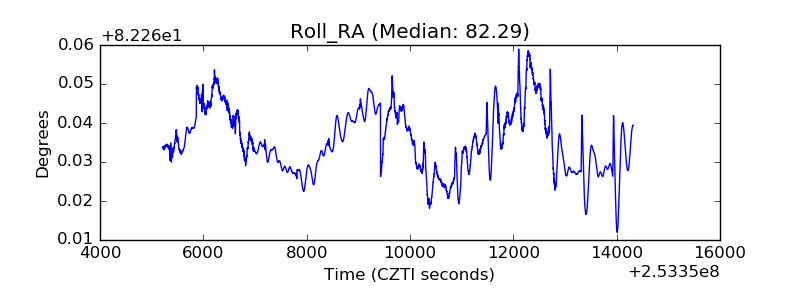 |
| Veto Counter |  |