| Param | Original file | Final file |
|---|---|---|
| Filename | modeM0/AS1G08_072T03_9000001836_12379cztM0_level2.evt | modeM0/AS1G08_072T03_9000001836_12379cztM0_level2_quad_clean.evt |
| Size (bytes) | 942,834,240 | 77,114,880 |
| Size | 899.2 MB | 73.5 MB |
| Events in quadrant A | 4,359,995 | 500,185 |
| Events in quadrant B | 14,119,100 | 345,528 |
| Events in quadrant C | 4,696,762 | 498,123 |
| Events in quadrant D | 4,874,719 | 472,082 |
| Mode SS | |||
|---|---|---|---|
| Quadrant | BADHDUFLAG | Total packets | Discarded packets |
| A | 0 | 152 | 0 |
| B | 0 | 152 | 0 |
| C | 0 | 152 | 0 |
| D | 0 | 152 | 0 |
| Mode M0 | |||
|---|---|---|---|
| Quadrant | BADHDUFLAG | Total packets | Discarded packets |
| A | 0 | 17786 | 2 |
| B | 0 | 47020 | 1 |
| C | 0 | 19088 | 1 |
| D | 0 | 19407 | 1 |
| Mode M9 | |||
|---|---|---|---|
| Quadrant | BADHDUFLAG | Total packets | Discarded packets |
| A | 0 | 2 | 0 |
| B | 0 | 2 | 0 |
| C | 0 | 2 | 0 |
| D | 0 | 2 | 0 |
| Quadrant | Total seconds | Saturated seconds | Saturation percentage |
|---|---|---|---|
| A | 7447 | 367 | 4.928159% |
| B | 7447 | 5015 | 67.342554% |
| C | 7447 | 474 | 6.364979% |
| D | 7447 | 543 | 7.291527% |
Noise dominated data is calculated using 1-second bins in cleaned event files. If a bin has >2000 counts, and if more than 50% of those come from <1% of pixels, then it is considered to be noise-dominated and hence unusable.
| Quadrant | # 1 sec bins | Bins with >0 counts | Bins with >2000 counts | High rate bins dominated by noise | Noise dominated (total time) | Noise dominated (detector-on time) | Marked lightcurve |
|---|---|---|---|---|---|---|---|
| A | 7597 | 7447 | 6 | 6 | 0.08% | 0.08% | 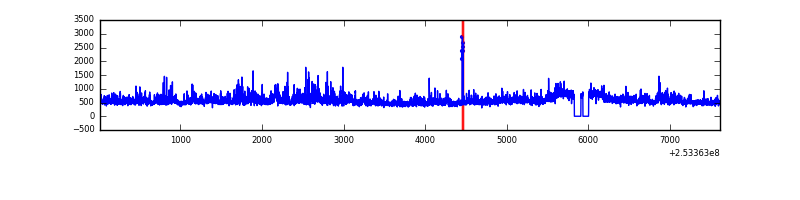 |
| B | 7598 | 7448 | 4768 | 4768 | 62.75% | 64.02% | 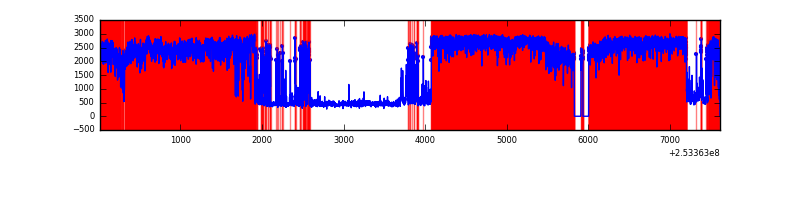 |
| C | 7598 | 7448 | 203 | 203 | 2.67% | 2.73% | 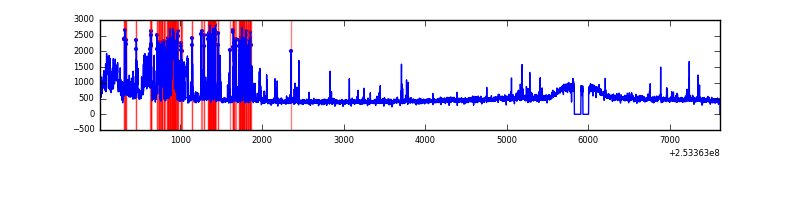 |
| D | 7598 | 7448 | 310 | 310 | 4.08% | 4.16% | 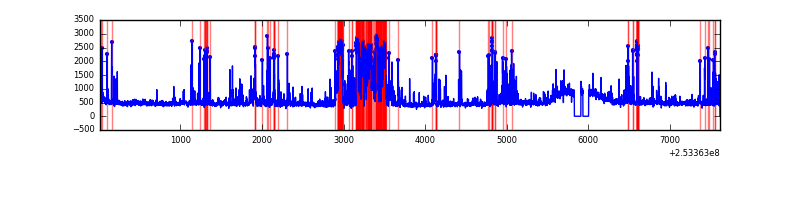 |
Top three noisy pixels from each quadrant. If the there are fewer than three noisy pixels in the level2.evt file, extra rows are filled as -1
| Pixel properties | Quadrant properties | ||||||
|---|---|---|---|---|---|---|---|
| Quadrant | DetID | PixID | Counts | Sigma | Mean | Median | Sigma |
| A | 13 | 251 | 247866 | 1337.2 | 901 | 880 | 184.7 |
| A | 1 | 162 | 217330 | 1171.87 | 901 | 880 | 184.7 |
| A | 1 | 178 | 110414 | 593.02 | 901 | 880 | 184.7 |
| B | 2 | 32 | 7041127 | 71877.49 | 509 | 496 | 98.0 |
| B | 2 | 48 | 4441914 | 45342.24 | 509 | 496 | 98.0 |
| B | 4 | 239 | 537847 | 5485.79 | 509 | 496 | 98.0 |
| C | 15 | 208 | 1159983 | 5629.37 | 882 | 888 | 205.9 |
| C | 14 | 234 | 91169 | 438.47 | 882 | 888 | 205.9 |
| C | 13 | 61 | 6378 | 26.66 | 882 | 888 | 205.9 |
| D | 13 | 104 | 691186 | 3270.87 | 877 | 853 | 211.1 |
| D | 1 | 52 | 655079 | 3099.8 | 877 | 853 | 211.1 |
| D | 8 | 195 | 84696 | 397.26 | 877 | 853 | 211.1 |
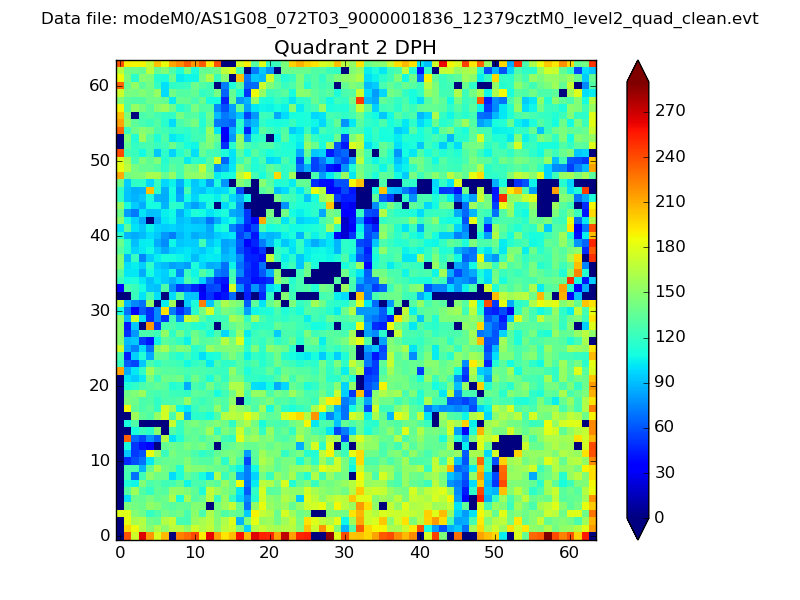
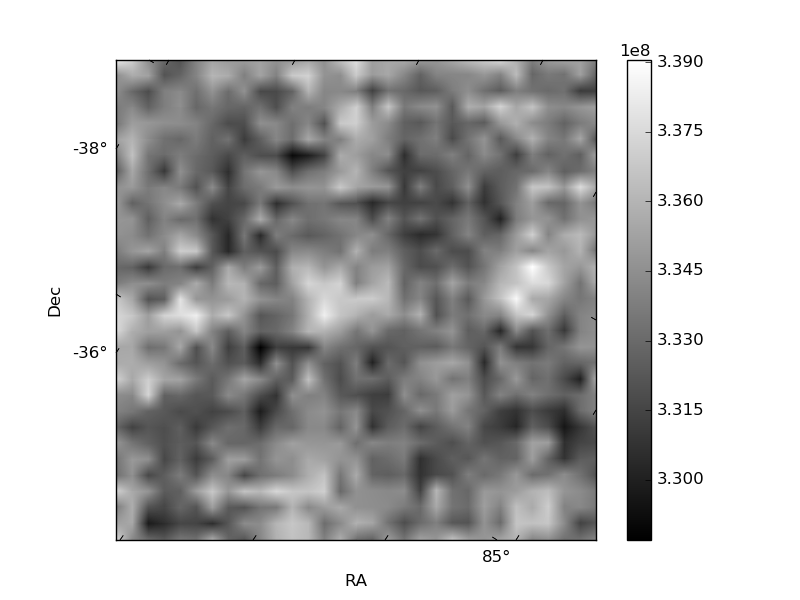
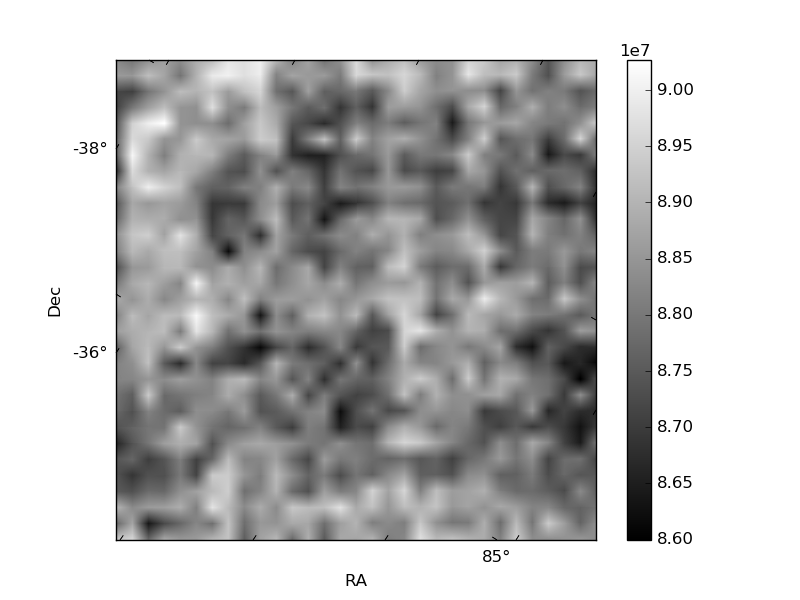
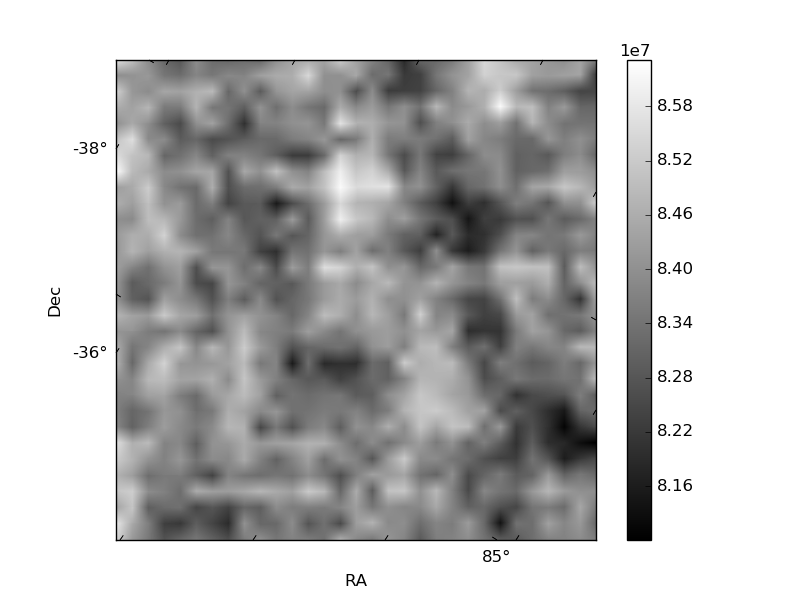
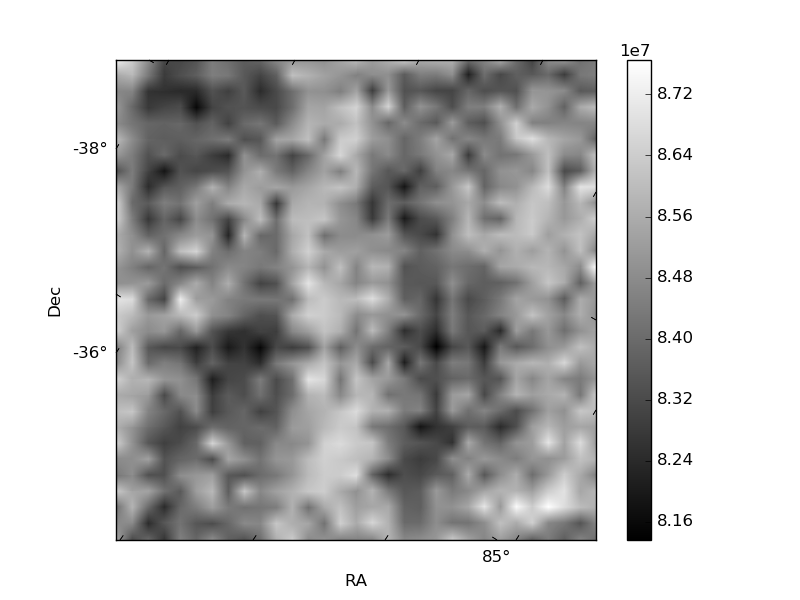
Histogram calculated using DETX and DETY for each event in the final _common_clean file
| Quadrant A | 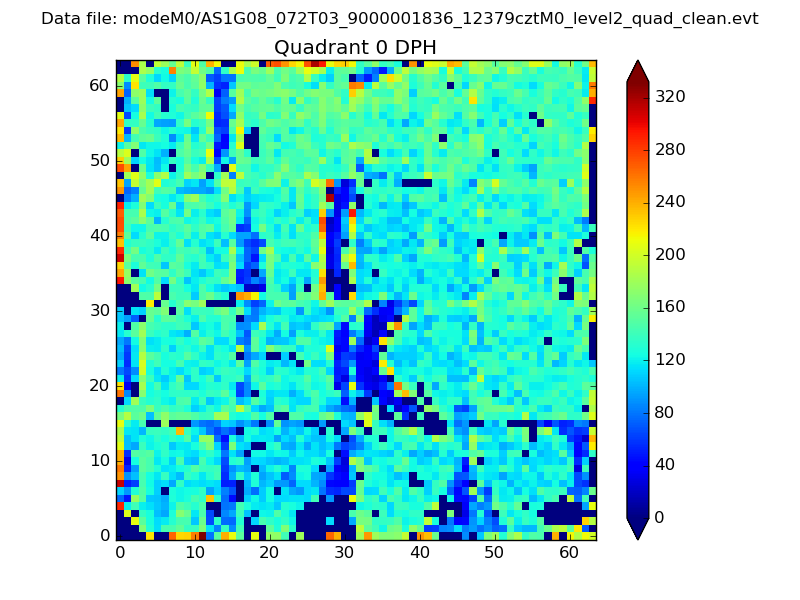 |
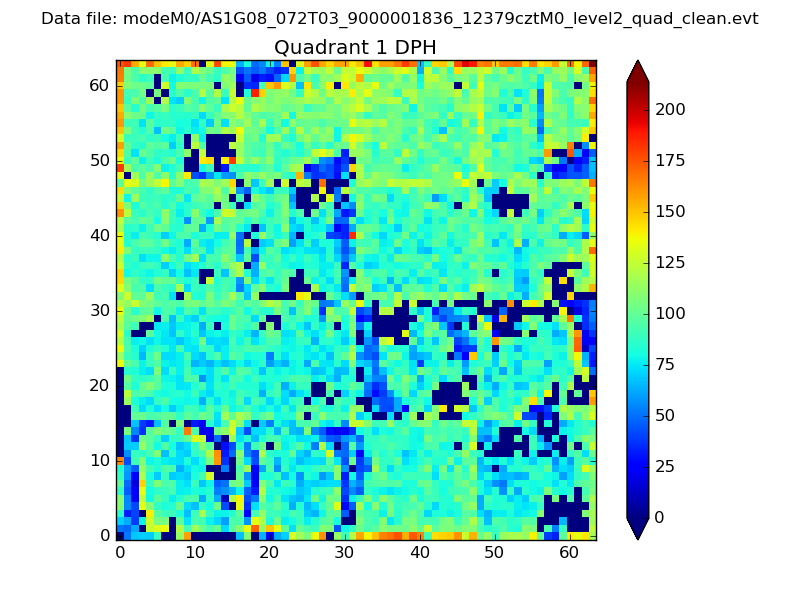 |
Quadrant B |
|---|---|---|---|
| Quadrant D | 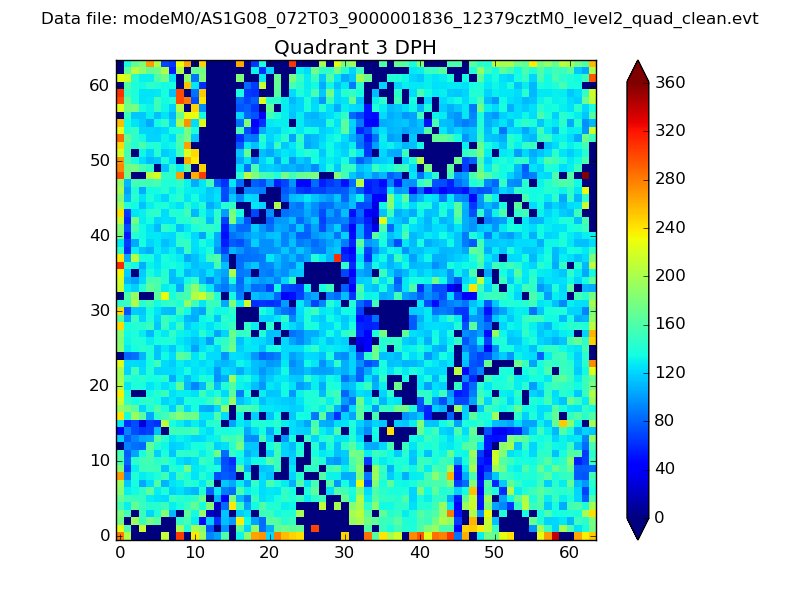 |
 |
Quadrant C |
| Plot type | Count rate plots | Images |
|---|---|---|
| Comparison with Poisson distribution Blue bars denote a histogram of data divided into 1 sec bins. Red curve is a Poisson curve with rate = median count rate of data. |
 |
 |
| Quadrant-wise count rates Data is divided into 100 sec bins |
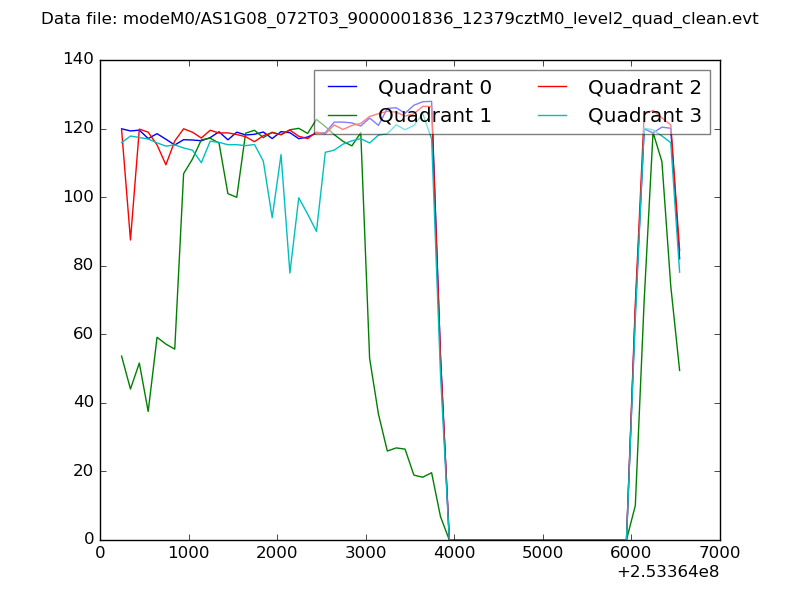 |
|
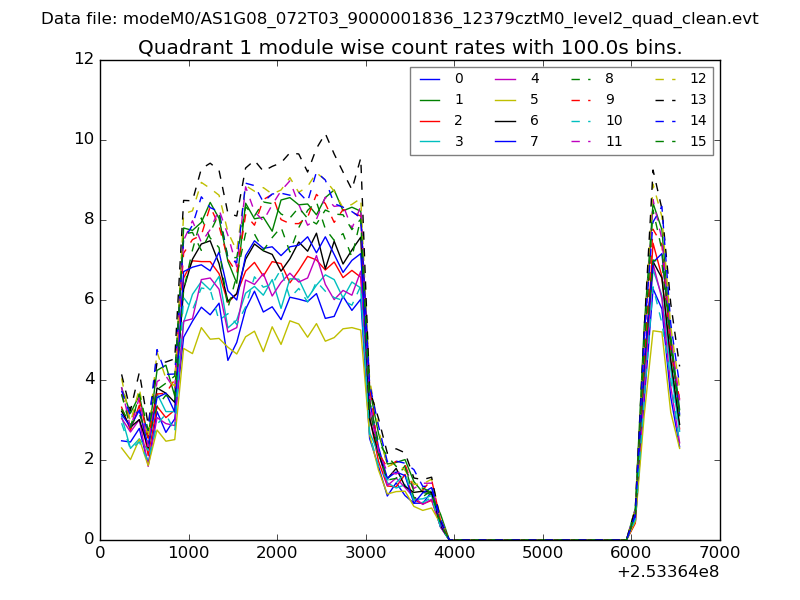
| Module-wise count rates for Quadrant A Data is divided into 100 sec bins |
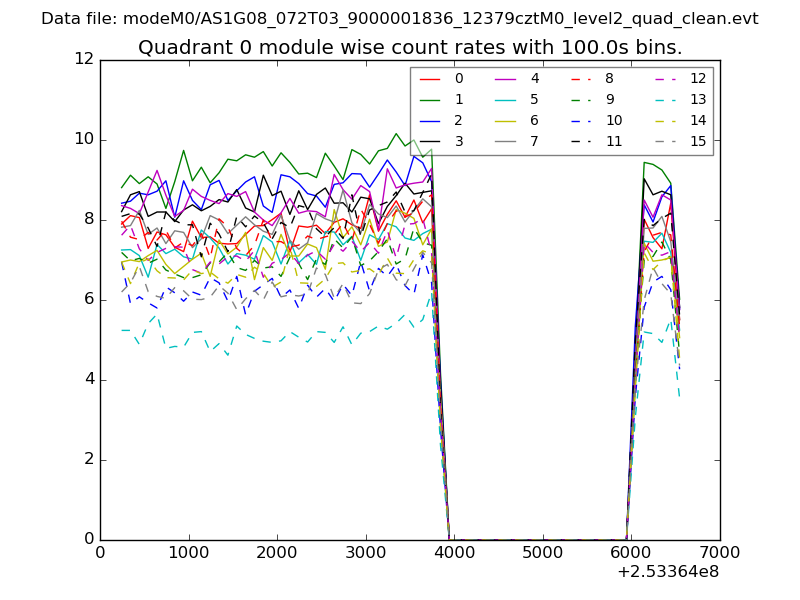 |
 |
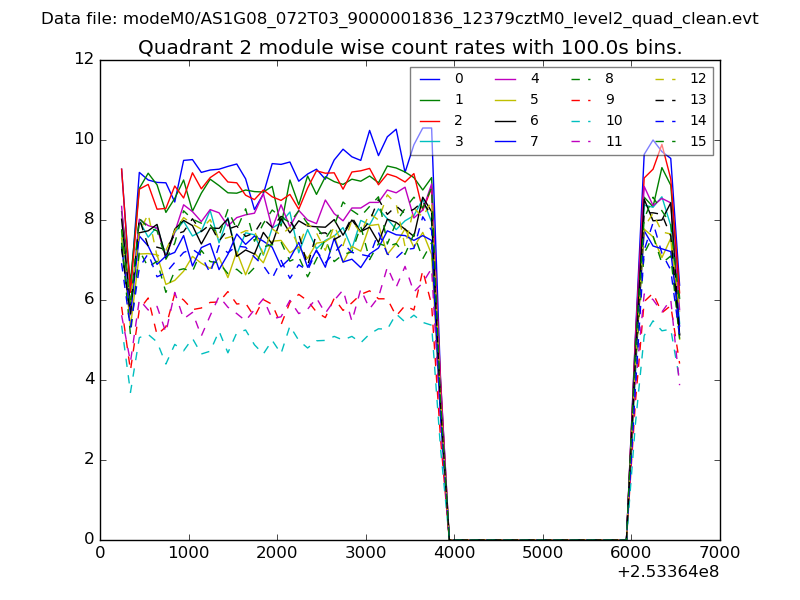
| Module-wise count rates for Quadrant B Data is divided into 100 sec bins |
 |
 |
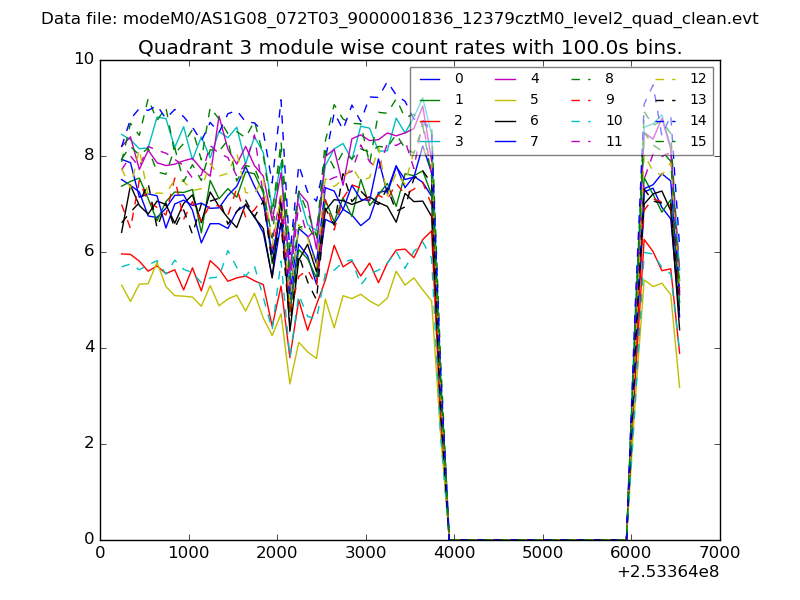
| Module-wise count rates for Quadrant C Data is divided into 100 sec bins |
 |
 |
| Module-wise count rates for Quadrant D Data is divided into 100 sec bins |
 |
 |
| Parameter | Plot |
|---|---|
| CZT HV Monitor | 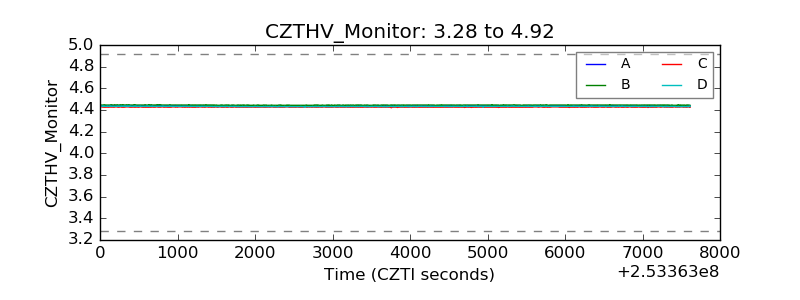 |
| D_VDD | 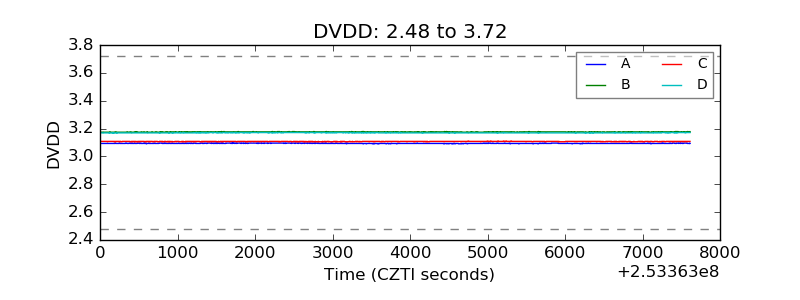 |
| Temperature 1 | 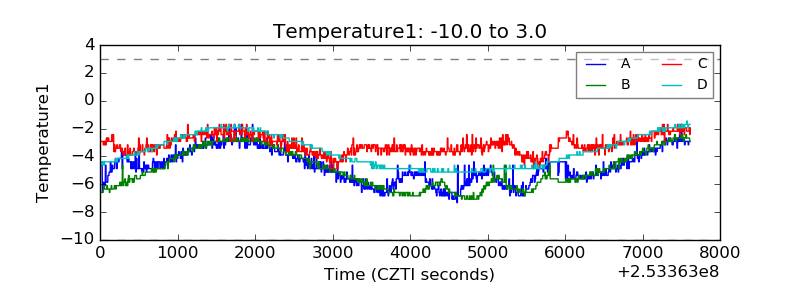 |
| Veto HV Monitor | 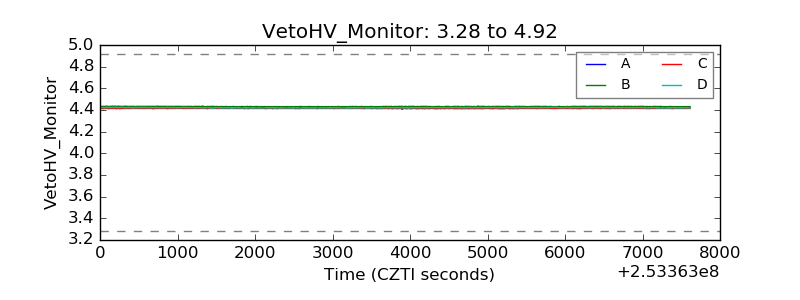 |
| Veto LLD | 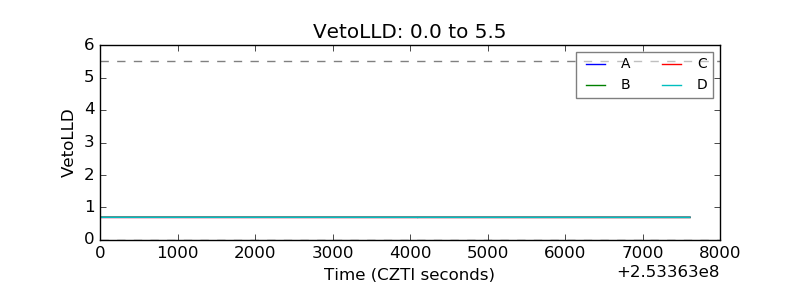 |
| Alpha Counter | 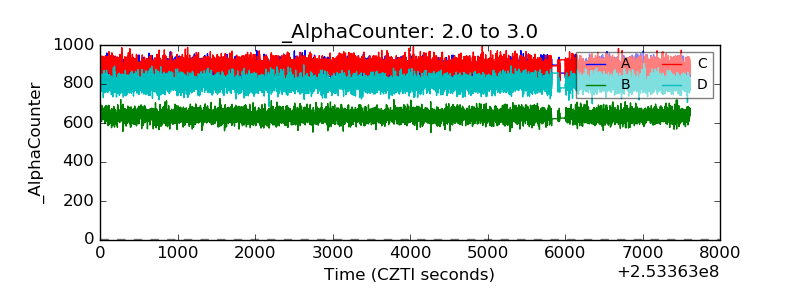 |
| _CPM_Rate | 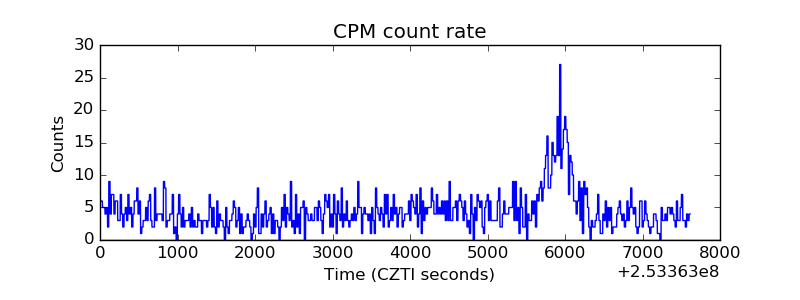 |
| CZT Counter | 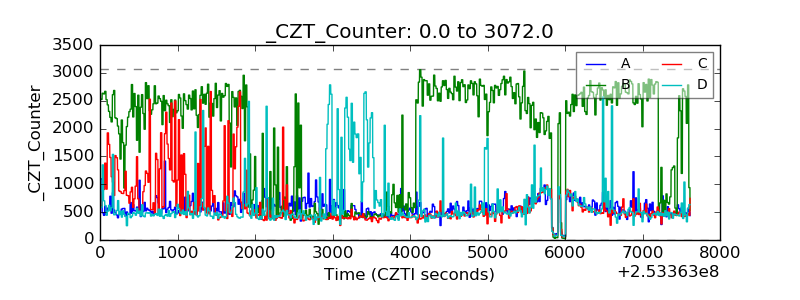 |
| +2.5 Volts monitor | 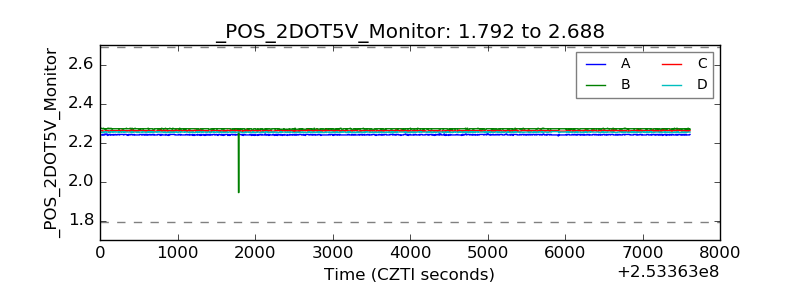 |
| +5 Volts monitor |  |
| _ROLL_ROT |  |
| _Roll_DEC | 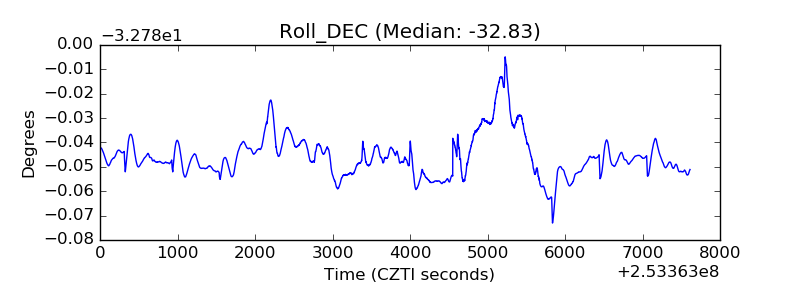 |
| _Roll_RA | 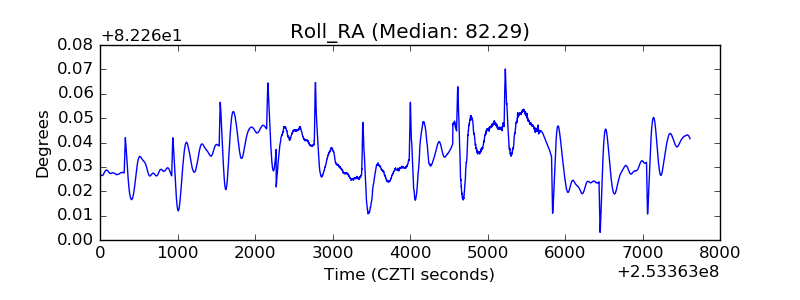 |
| Veto Counter | 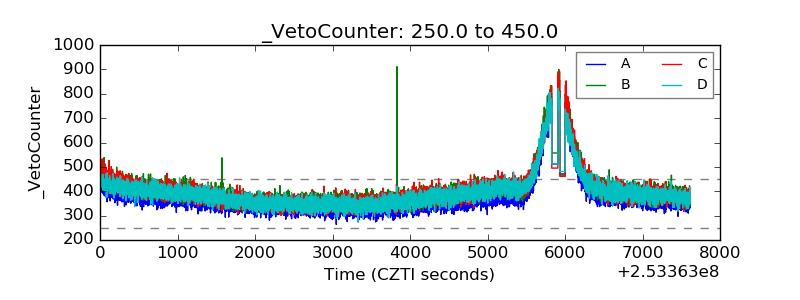 |