| Param | Original file | Final file |
|---|---|---|
| Filename | modeM0/AS1G08_072T03_9000001836_12383cztM0_level2.evt | modeM0/AS1G08_072T03_9000001836_12383cztM0_level2_quad_clean.evt |
| Size (bytes) | 169,439,040 | 31,069,440 |
| Size | 161.6 MB | 29.6 MB |
| Events in quadrant A | 1,047,137 | 214,506 |
| Events in quadrant B | 1,926,587 | 173,019 |
| Events in quadrant C | 780,958 | 215,116 |
| Events in quadrant D | 1,251,459 | 205,329 |
| Mode SS | |||
|---|---|---|---|
| Quadrant | BADHDUFLAG | Total packets | Discarded packets |
| A | 0 | 36 | 0 |
| B | 0 | 36 | 0 |
| C | 0 | 36 | 0 |
| D | 0 | 36 | 0 |
| Mode M0 | |||
|---|---|---|---|
| Quadrant | BADHDUFLAG | Total packets | Discarded packets |
| A | 0 | 4277 | 0 |
| B | 0 | 6950 | 0 |
| C | 0 | 3662 | 0 |
| D | 0 | 4920 | 0 |
| Quadrant | Total seconds | Saturated seconds | Saturation percentage |
|---|---|---|---|
| A | 1809 | 6 | 0.331675% |
| B | 1809 | 459 | 25.373134% |
| C | 1809 | 0 | 0.000000% |
| D | 1809 | 60 | 3.316750% |
Noise dominated data is calculated using 1-second bins in cleaned event files. If a bin has >2000 counts, and if more than 50% of those come from <1% of pixels, then it is considered to be noise-dominated and hence unusable.
| Quadrant | # 1 sec bins | Bins with >0 counts | Bins with >2000 counts | High rate bins dominated by noise | Noise dominated (total time) | Noise dominated (detector-on time) | Marked lightcurve |
|---|---|---|---|---|---|---|---|
| A | 1810 | 1810 | 0 | 0 | 0.00% | 0.00% | 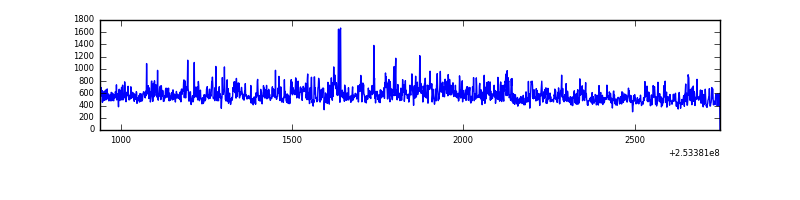 |
| B | 1810 | 1810 | 434 | 434 | 23.98% | 23.98% | 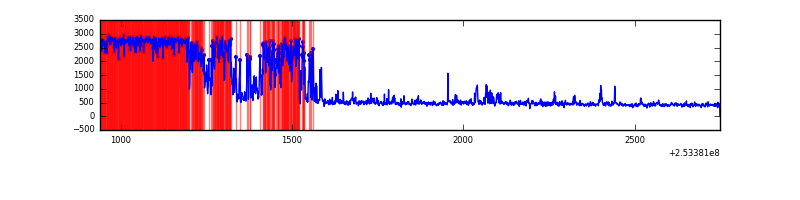 |
| C | 1810 | 1810 | 0 | 0 | 0.00% | 0.00% | 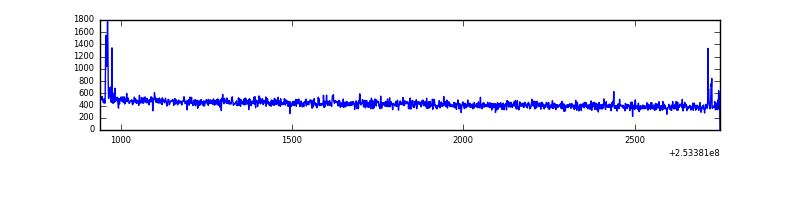 |
| D | 1810 | 1810 | 61 | 61 | 3.37% | 3.37% | 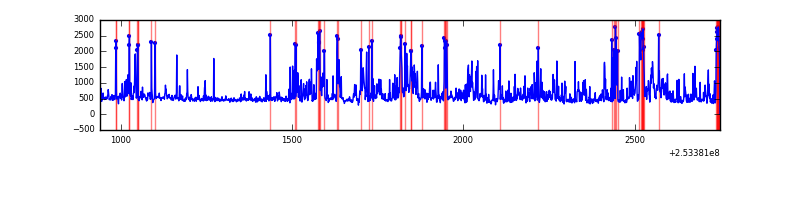 |
Top three noisy pixels from each quadrant. If the there are fewer than three noisy pixels in the level2.evt file, extra rows are filled as -1
| Pixel properties | Quadrant properties | ||||||
|---|---|---|---|---|---|---|---|
| Quadrant | DetID | PixID | Counts | Sigma | Mean | Median | Sigma |
| A | 13 | 251 | 74415 | 1677.83 | 209 | 204 | 44.2 |
| A | 1 | 162 | 57398 | 1293.09 | 209 | 204 | 44.2 |
| A | 1 | 178 | 30814 | 692.06 | 209 | 204 | 44.2 |
| B | 2 | 32 | 1045406 | 30046.64 | 170 | 166 | 34.8 |
| B | 2 | 48 | 117085 | 3360.97 | 170 | 166 | 34.8 |
| B | 4 | 239 | 49448 | 1416.67 | 170 | 166 | 34.8 |
| C | 14 | 234 | 13911 | 288.58 | 196 | 197 | 47.5 |
| C | 15 | 208 | 1623 | 30.01 | 196 | 197 | 47.5 |
| C | 13 | 61 | 1410 | 25.52 | 196 | 197 | 47.5 |
| D | 1 | 52 | 174991 | 3549.27 | 196 | 191 | 49.2 |
| D | 10 | 199 | 171191 | 3472.11 | 196 | 191 | 49.2 |
| D | 13 | 104 | 77265 | 1564.97 | 196 | 191 | 49.2 |
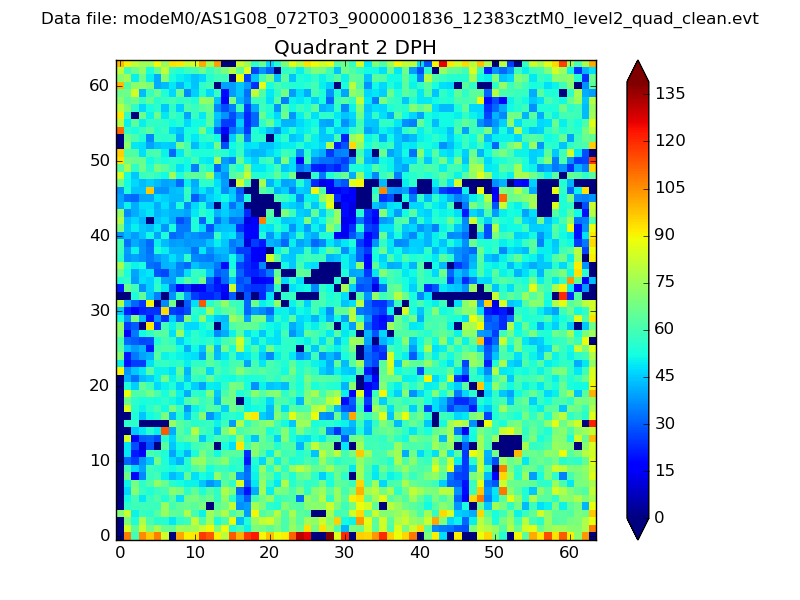
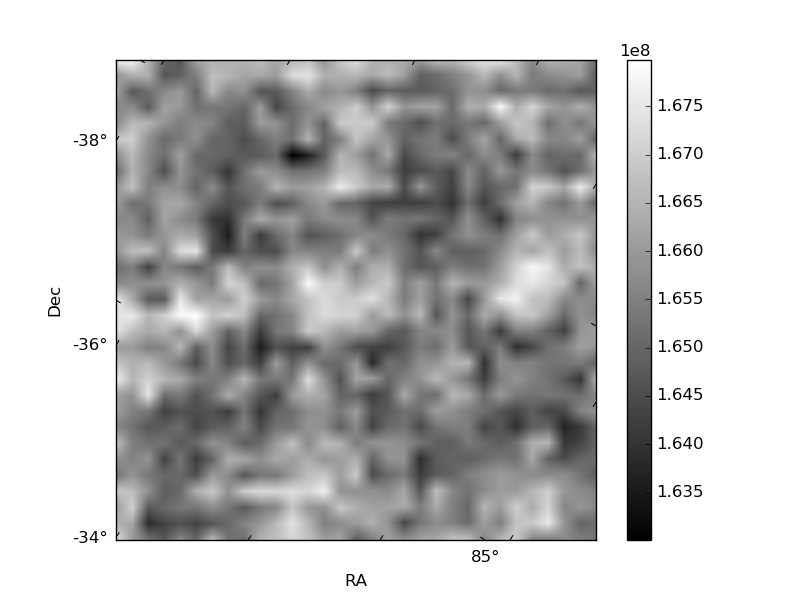
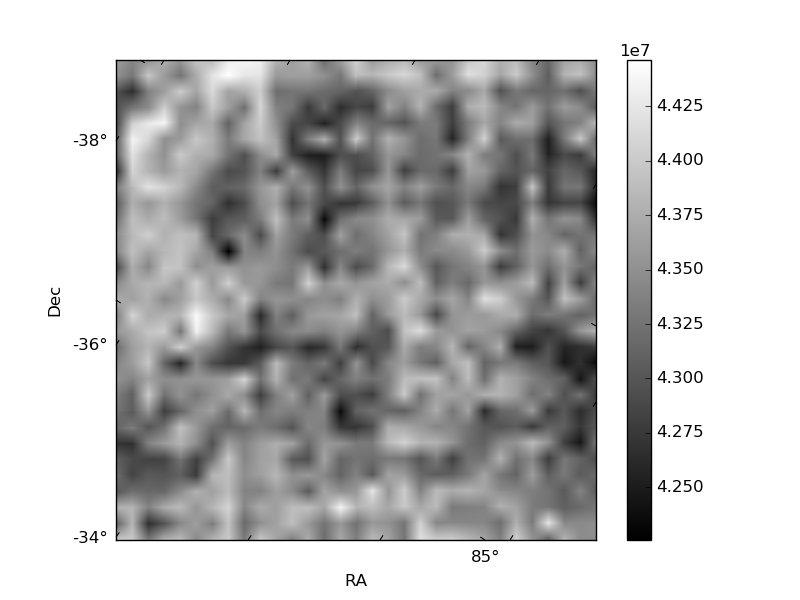
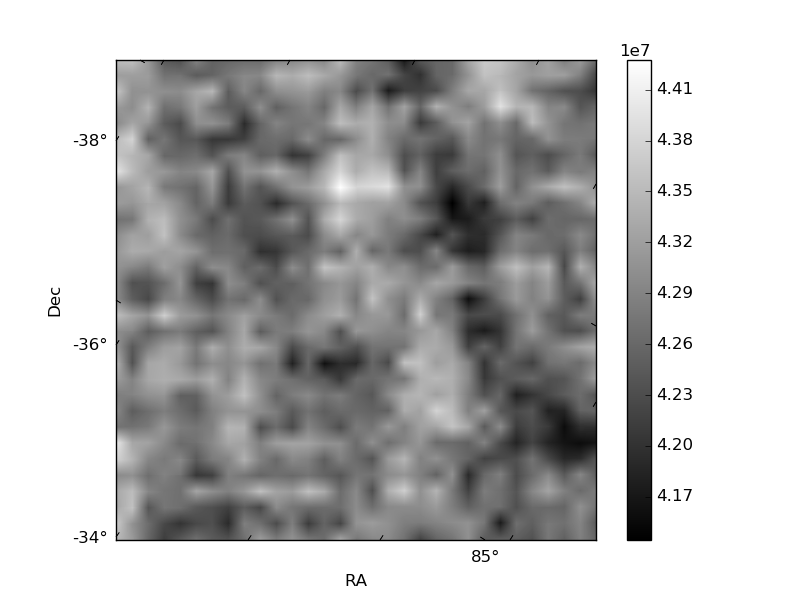
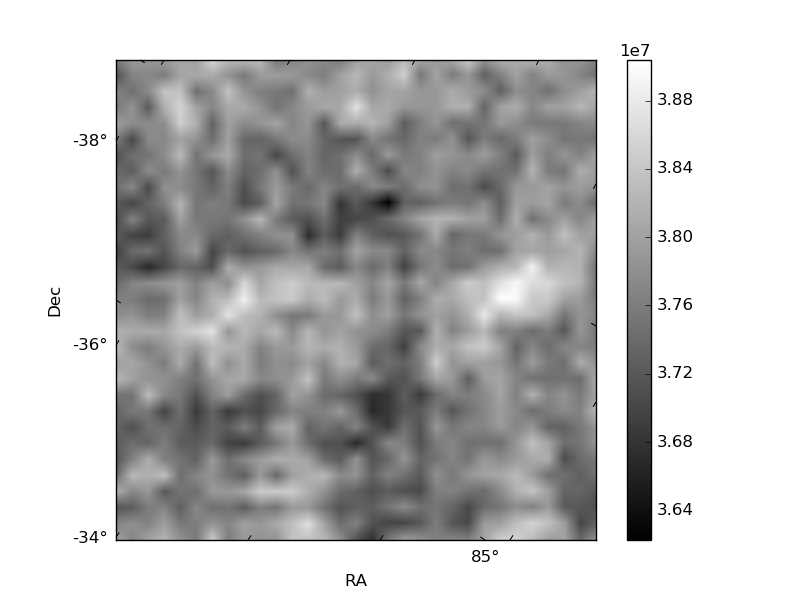
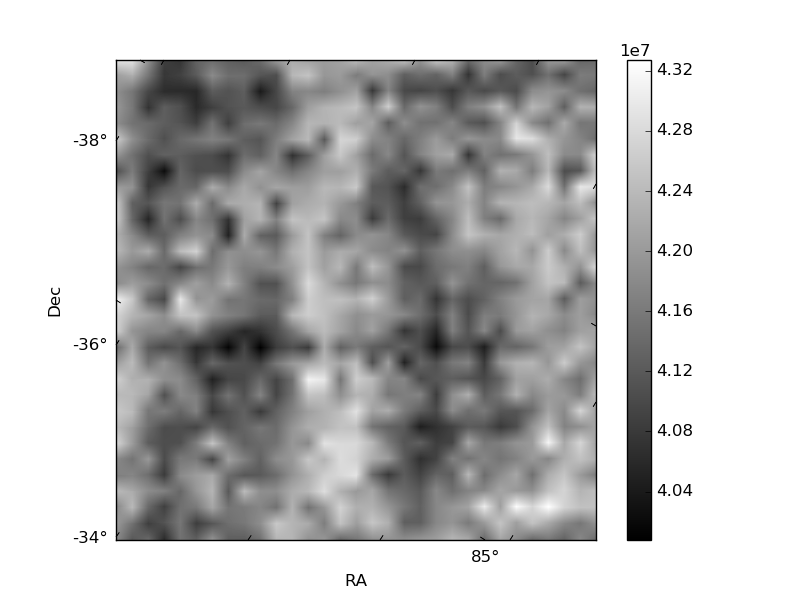
Histogram calculated using DETX and DETY for each event in the final _common_clean file
| Quadrant A | 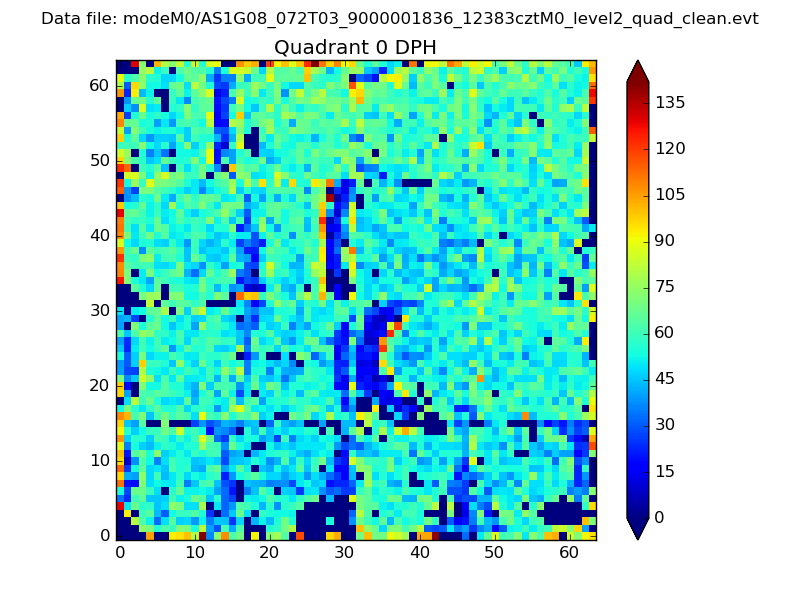 |
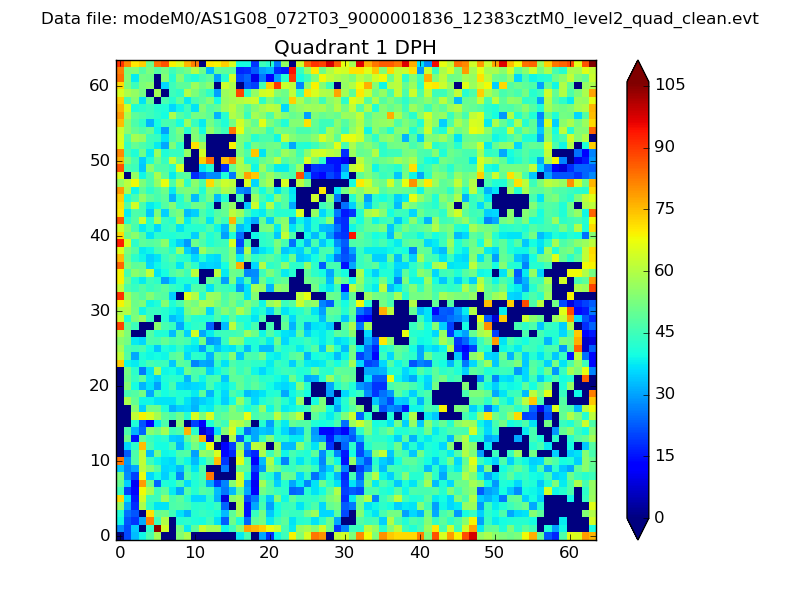 |
Quadrant B |
|---|---|---|---|
| Quadrant D | 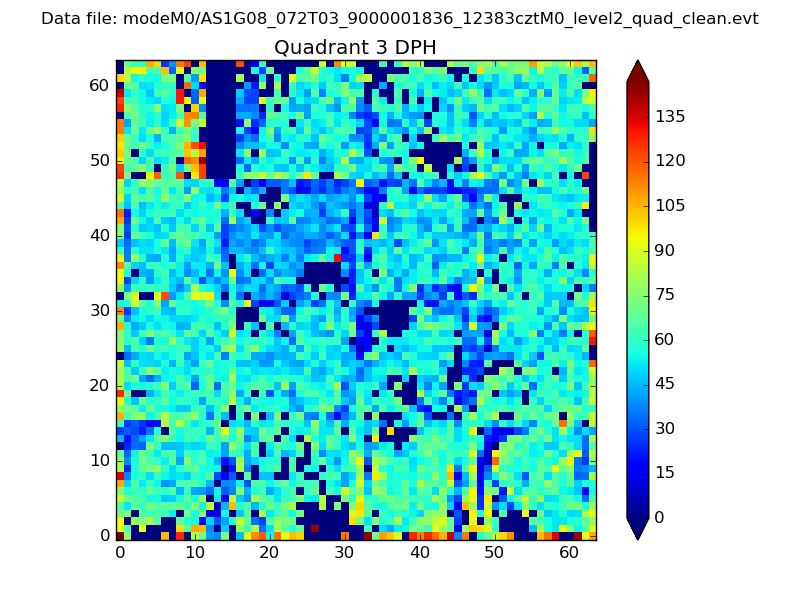 |
 |
Quadrant C |
| Plot type | Count rate plots | Images |
|---|---|---|
| Comparison with Poisson distribution Blue bars denote a histogram of data divided into 1 sec bins. Red curve is a Poisson curve with rate = median count rate of data. |
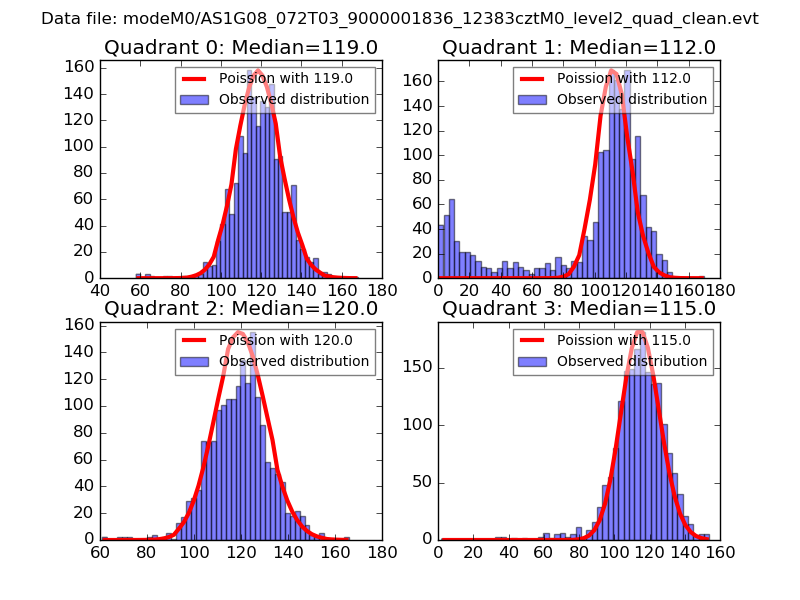 |
 |
| Quadrant-wise count rates Data is divided into 100 sec bins |
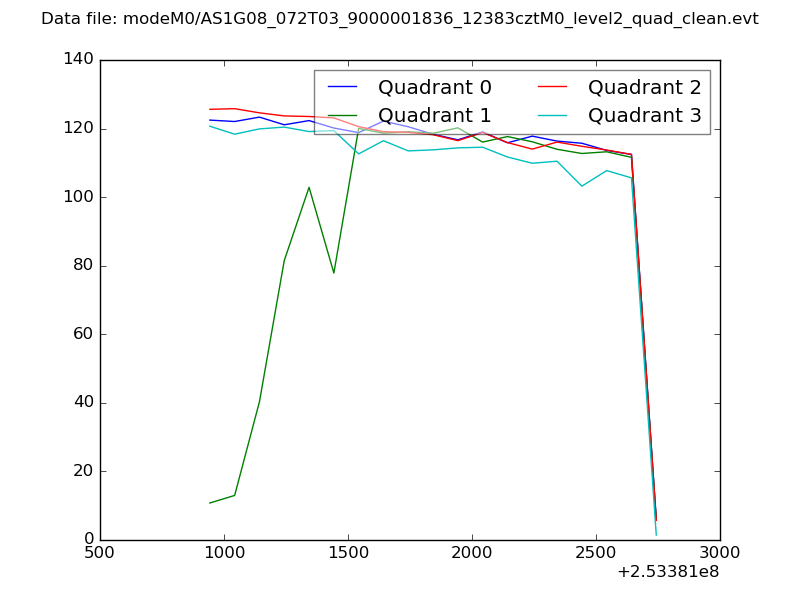 |
|
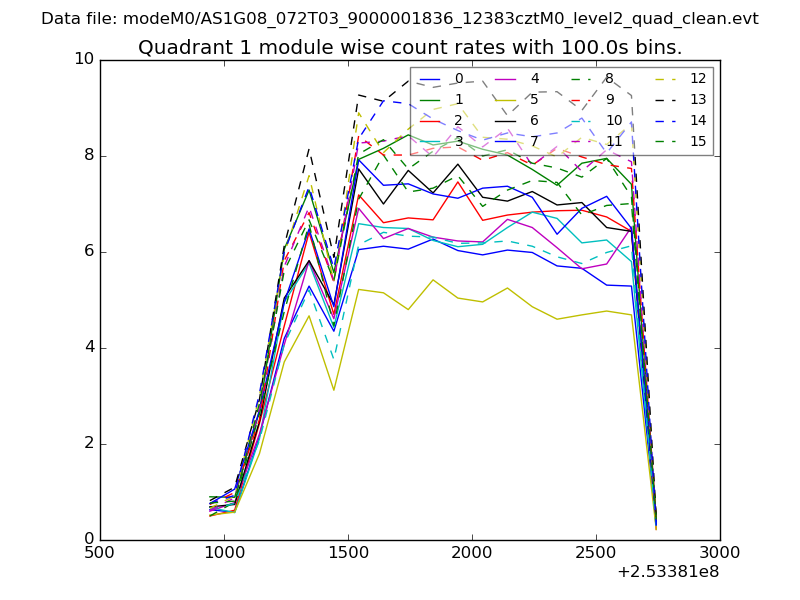
| Module-wise count rates for Quadrant A Data is divided into 100 sec bins |
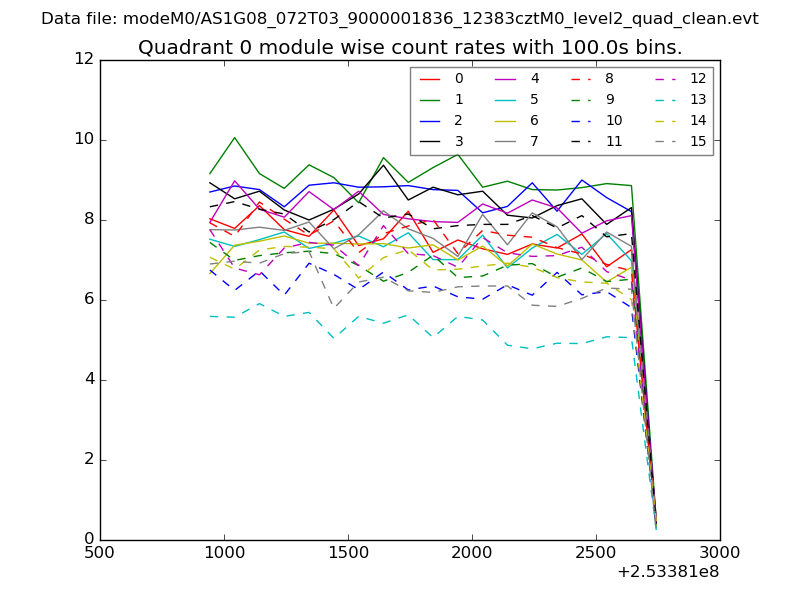 |
 |
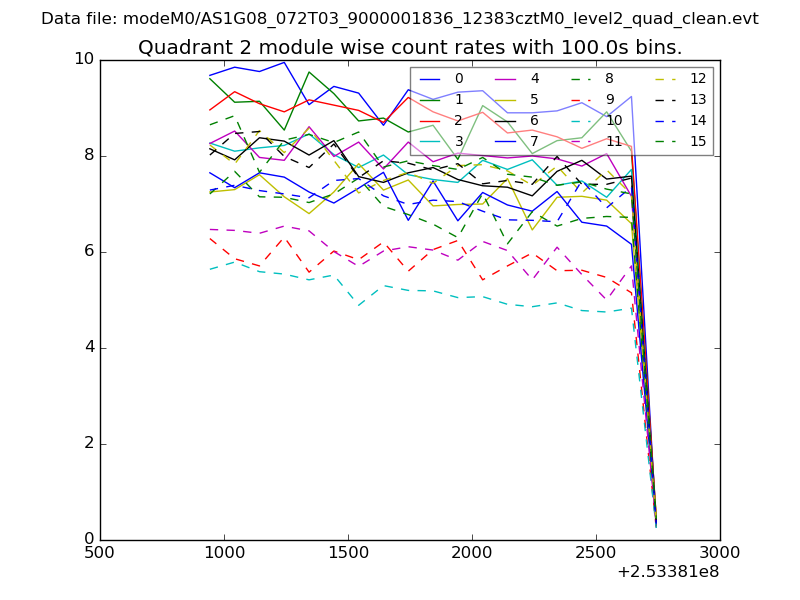
| Module-wise count rates for Quadrant B Data is divided into 100 sec bins |
 |
 |
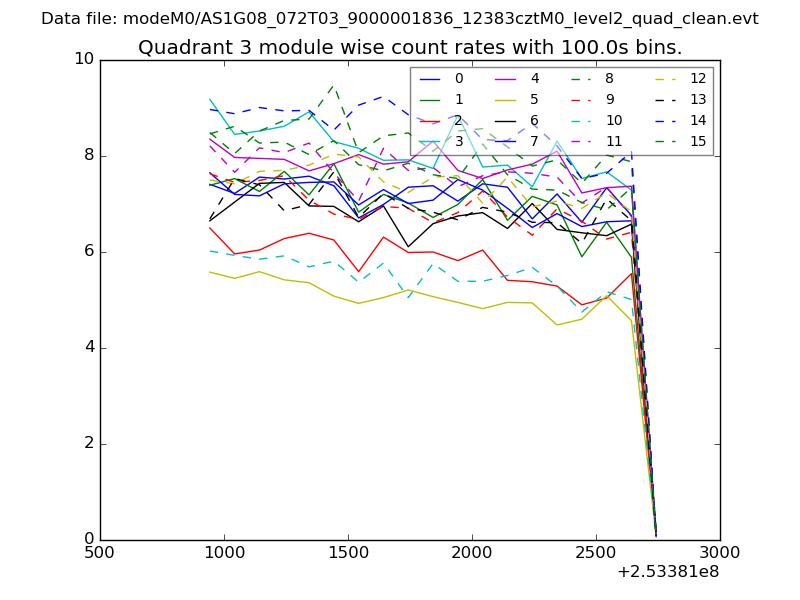
| Module-wise count rates for Quadrant C Data is divided into 100 sec bins |
 |
 |
| Module-wise count rates for Quadrant D Data is divided into 100 sec bins |
 |
 |
| Parameter | Plot |
|---|---|
| CZT HV Monitor | 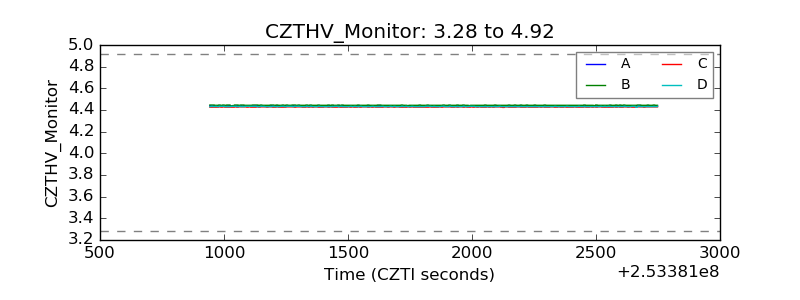 |
| D_VDD | 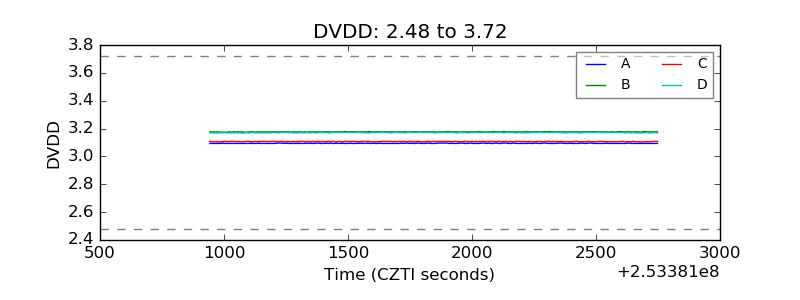 |
| Temperature 1 | 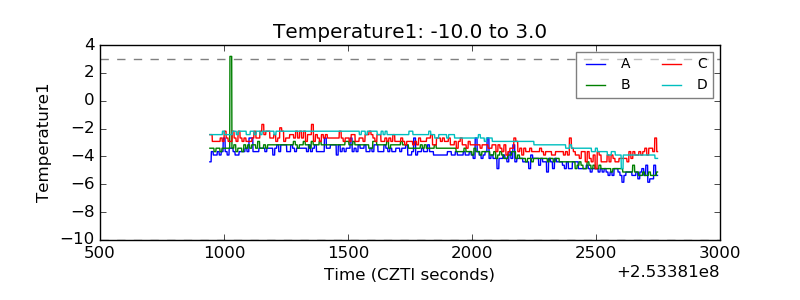 |
| Veto HV Monitor | 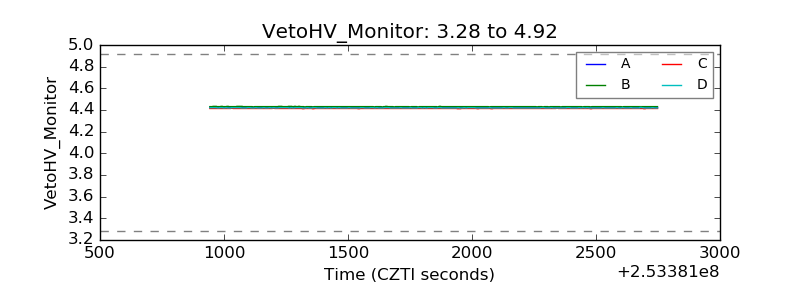 |
| Veto LLD | 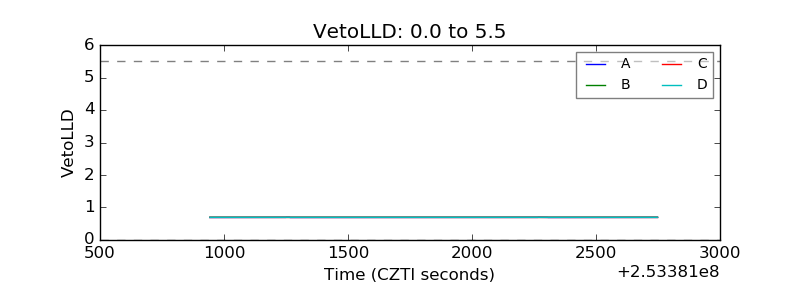 |
| Alpha Counter | 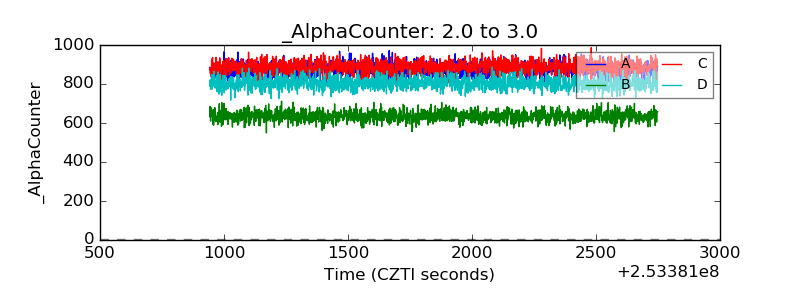 |
| _CPM_Rate | 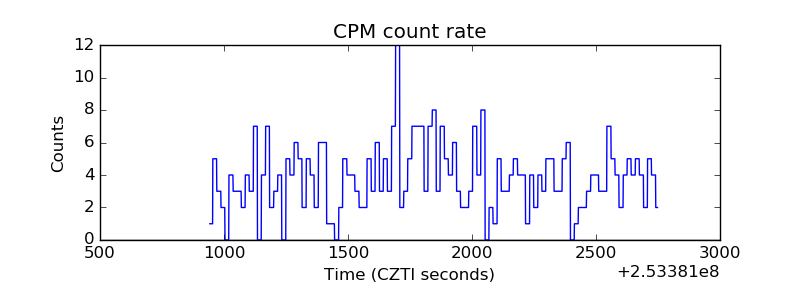 |
| CZT Counter | 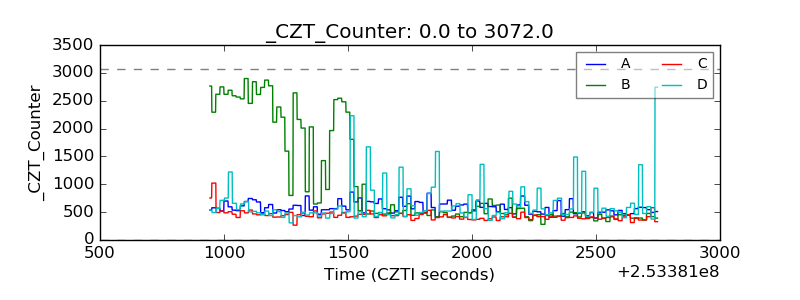 |
| +2.5 Volts monitor |  |
| +5 Volts monitor |  |
| _ROLL_ROT | 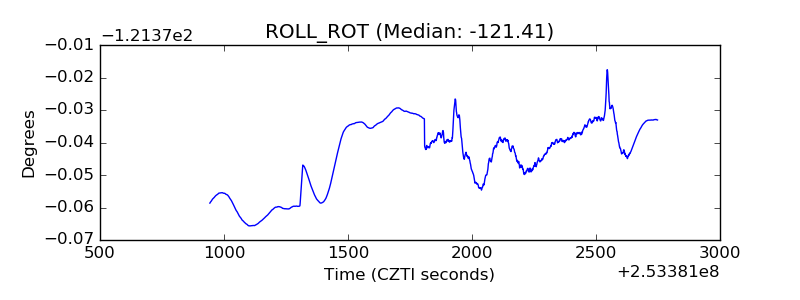 |
| _Roll_DEC | 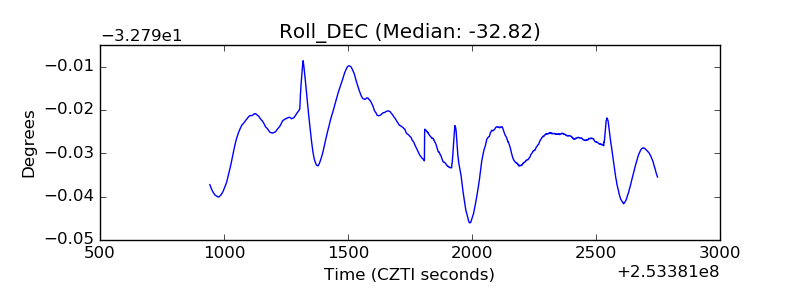 |
| _Roll_RA | 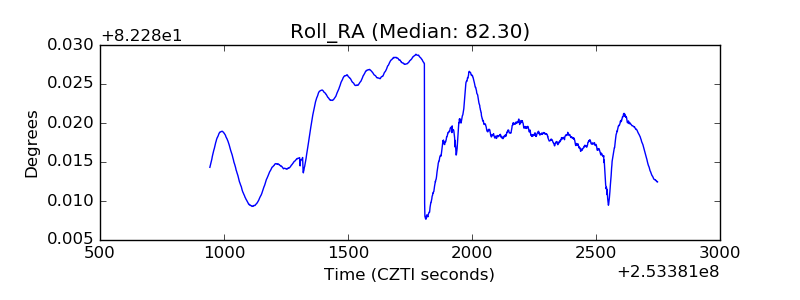 |
| Veto Counter | 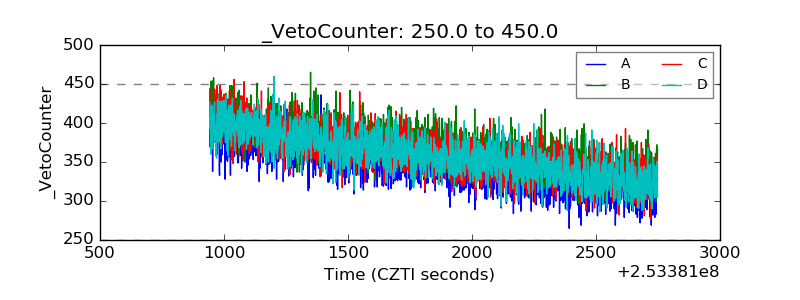 |