| Param | Original file | Final file |
|---|---|---|
| Filename | modeM0/AS1A04_104T02_9000001838_12383cztM0_level2.evt | modeM0/AS1A04_104T02_9000001838_12383cztM0_level2_quad_clean.evt |
| Size (bytes) | 443,183,040 | 65,214,720 |
| Size | 422.7 MB | 62.2 MB |
| Events in quadrant A | 2,478,695 | 472,769 |
| Events in quadrant B | 6,263,057 | 314,839 |
| Events in quadrant C | 1,764,733 | 472,633 |
| Events in quadrant D | 2,650,491 | 438,785 |
| Mode SS | |||
|---|---|---|---|
| Quadrant | BADHDUFLAG | Total packets | Discarded packets |
| A | 0 | 80 | 0 |
| B | 0 | 80 | 0 |
| C | 0 | 80 | 0 |
| D | 0 | 80 | 0 |
| Mode M9 | |||
|---|---|---|---|
| Quadrant | BADHDUFLAG | Total packets | Discarded packets |
| A | 0 | 6 | 0 |
| B | 0 | 6 | 0 |
| C | 0 | 6 | 0 |
| D | 0 | 6 | 0 |
| Mode M0 | |||
|---|---|---|---|
| Quadrant | BADHDUFLAG | Total packets | Discarded packets |
| A | 0 | 10072 | 2 |
| B | 0 | 21165 | 1 |
| C | 0 | 7885 | 1 |
| D | 0 | 10543 | 1 |
| Quadrant | Total seconds | Saturated seconds | Saturation percentage |
|---|---|---|---|
| A | 3889 | 70 | 1.799949% |
| B | 3889 | 2056 | 52.867061% |
| C | 3889 | 11 | 0.282849% |
| D | 3889 | 254 | 6.531242% |
Noise dominated data is calculated using 1-second bins in cleaned event files. If a bin has >2000 counts, and if more than 50% of those come from <1% of pixels, then it is considered to be noise-dominated and hence unusable.
| Quadrant | # 1 sec bins | Bins with >0 counts | Bins with >2000 counts | High rate bins dominated by noise | Noise dominated (total time) | Noise dominated (detector-on time) | Marked lightcurve |
|---|---|---|---|---|---|---|---|
| A | 4475 | 3891 | 0 | 0 | 0.00% | 0.00% | 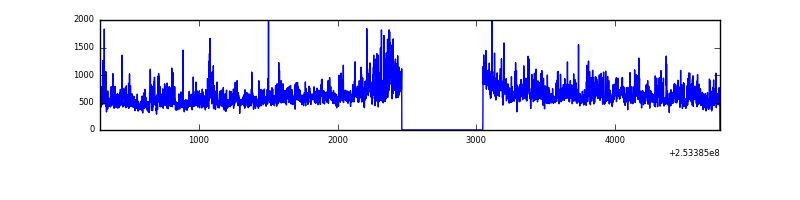 |
| B | 4475 | 3891 | 1950 | 1950 | 43.58% | 50.12% | 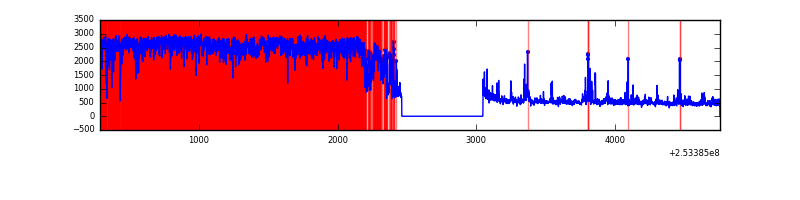 |
| C | 4475 | 3890 | 0 | 0 | 0.00% | 0.00% | 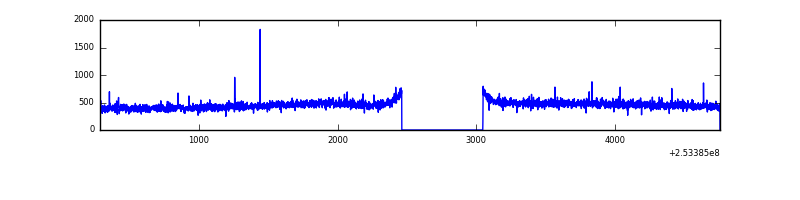 |
| D | 4475 | 3890 | 195 | 195 | 4.36% | 5.01% | 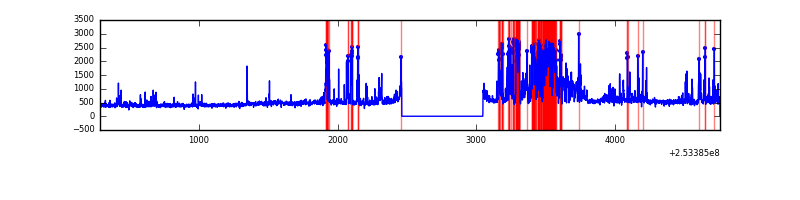 |
Top three noisy pixels from each quadrant. If the there are fewer than three noisy pixels in the level2.evt file, extra rows are filled as -1
| Pixel properties | Quadrant properties | ||||||
|---|---|---|---|---|---|---|---|
| Quadrant | DetID | PixID | Counts | Sigma | Mean | Median | Sigma |
| A | 13 | 251 | 267961 | 2748.99 | 466 | 456 | 97.3 |
| A | 1 | 162 | 147807 | 1514.24 | 466 | 456 | 97.3 |
| A | 1 | 178 | 80238 | 819.87 | 466 | 456 | 97.3 |
| B | 2 | 32 | 3000986 | 47003.88 | 329 | 321 | 63.8 |
| B | 2 | 48 | 1453178 | 22758.26 | 329 | 321 | 63.8 |
| B | 4 | 239 | 368525 | 5767.73 | 329 | 321 | 63.8 |
| C | 15 | 208 | 7854 | 70.03 | 449 | 449 | 105.7 |
| C | 13 | 61 | 3307 | 27.03 | 449 | 449 | 105.7 |
| C | 12 | 4 | 2204 | 16.6 | 449 | 449 | 105.7 |
| D | 1 | 52 | 786723 | 7433.44 | 437 | 424 | 105.8 |
| D | 8 | 195 | 105565 | 993.97 | 437 | 424 | 105.8 |
| D | 13 | 104 | 57328 | 537.95 | 437 | 424 | 105.8 |
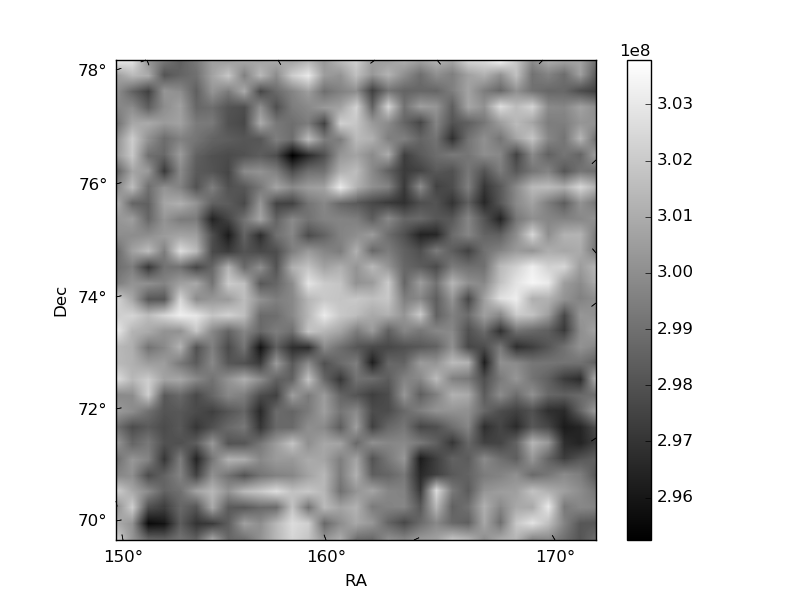
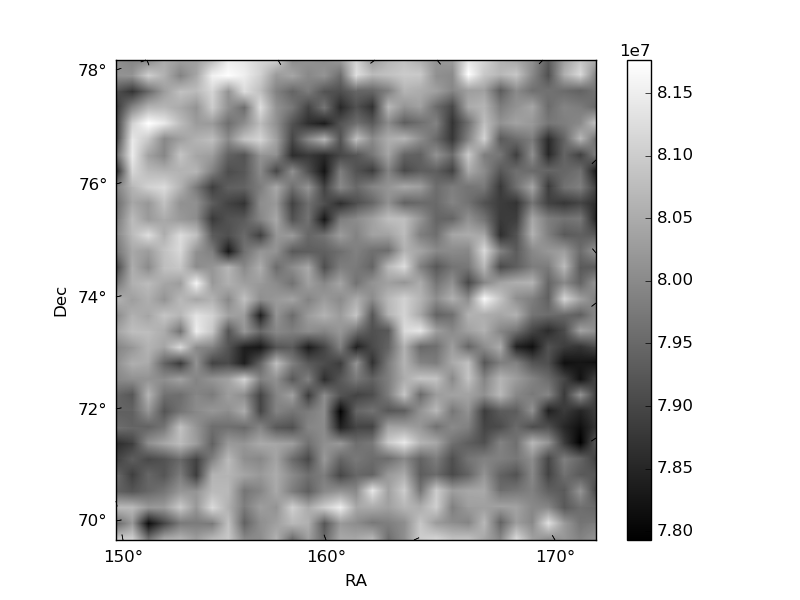
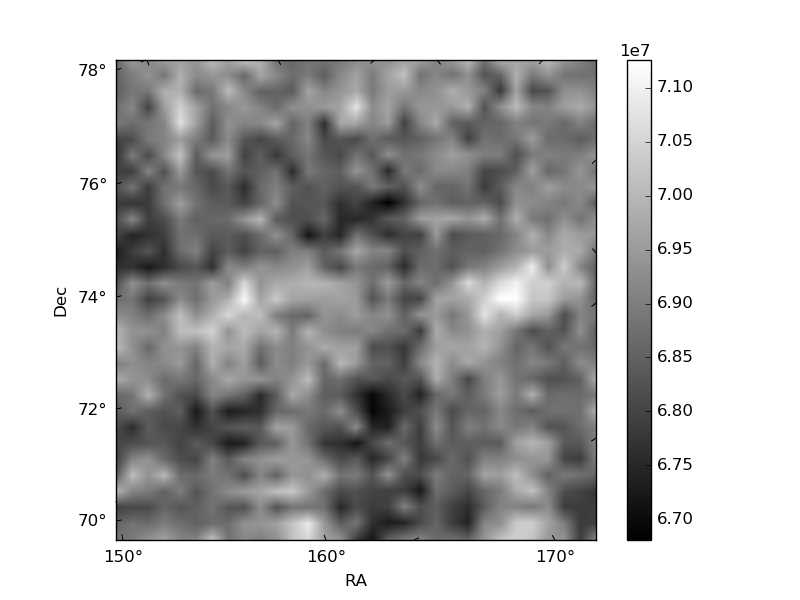
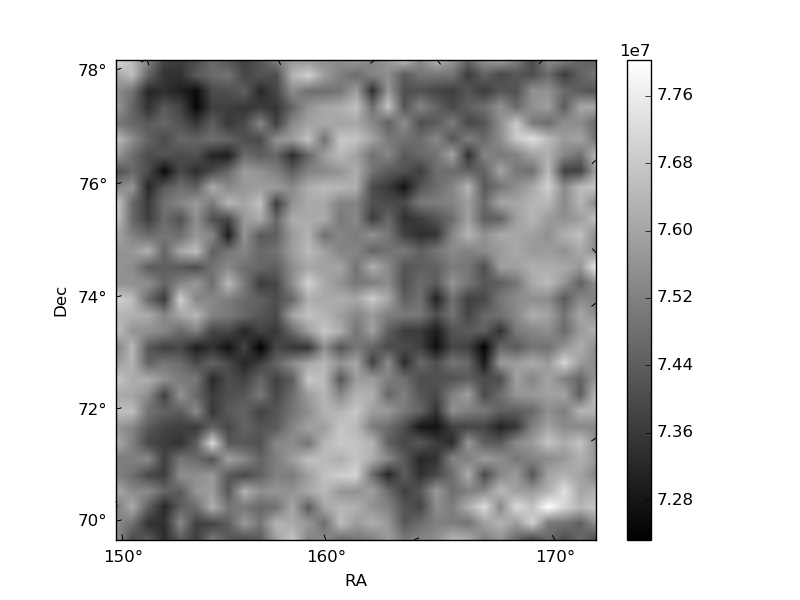
Histogram calculated using DETX and DETY for each event in the final _common_clean file
| Quadrant A | 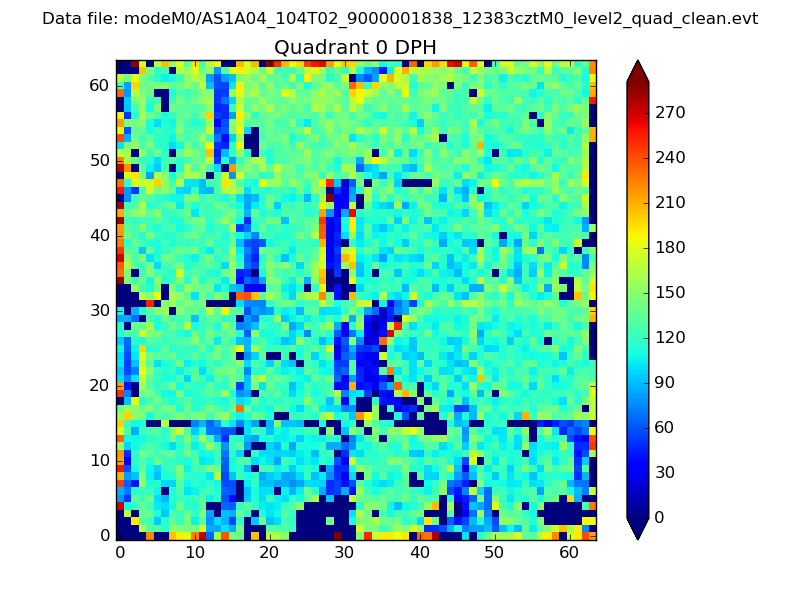 |
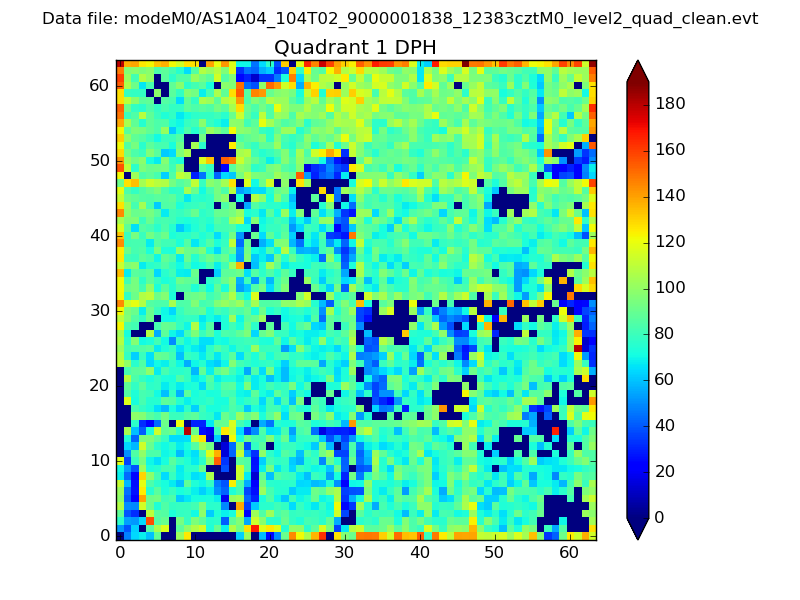 |
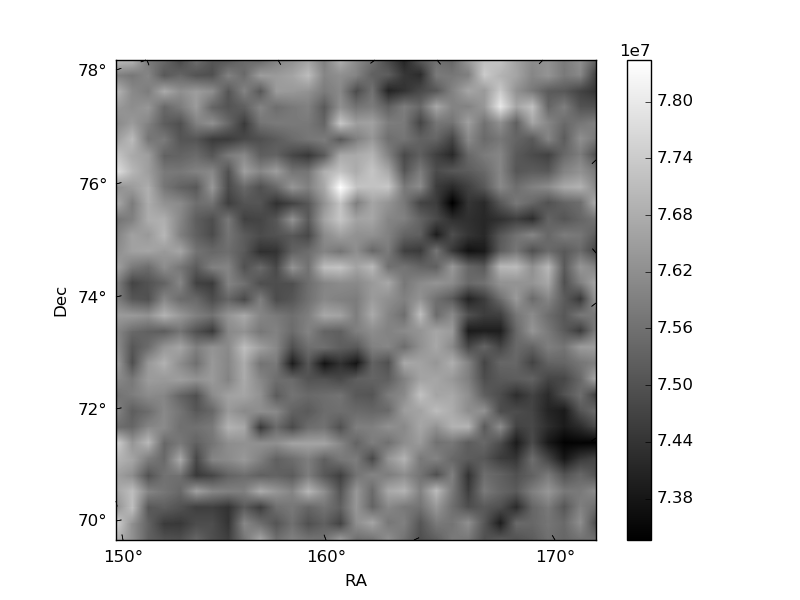
Quadrant B |
|---|---|---|---|
| Quadrant D | 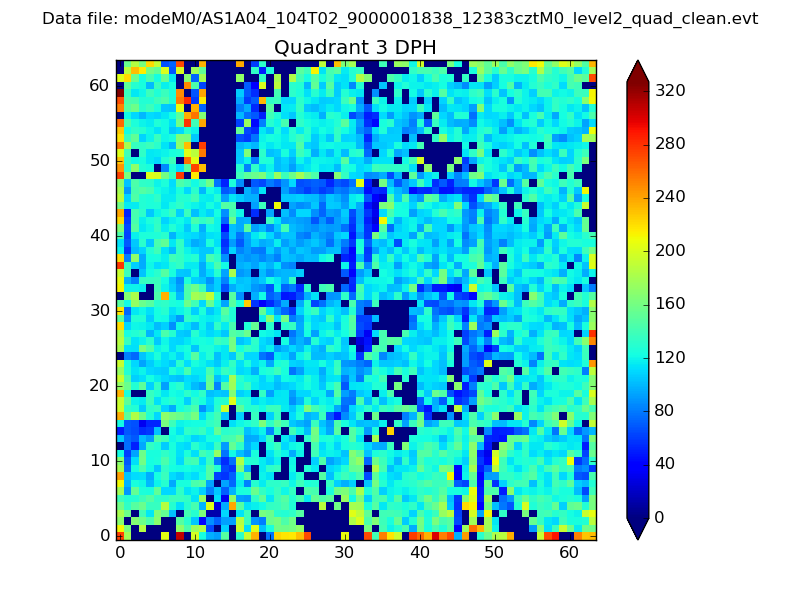 |
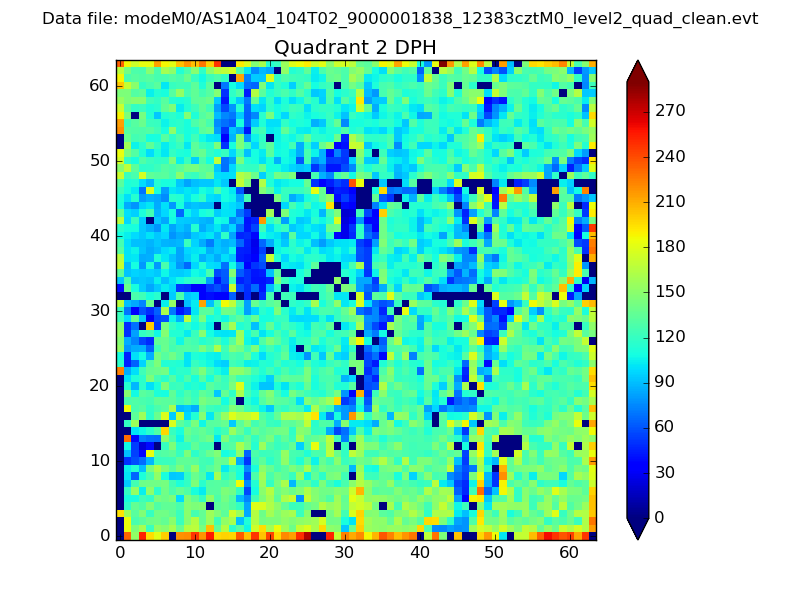 |
Quadrant C |
| Plot type | Count rate plots | Images |
|---|---|---|
| Comparison with Poisson distribution Blue bars denote a histogram of data divided into 1 sec bins. Red curve is a Poisson curve with rate = median count rate of data. |
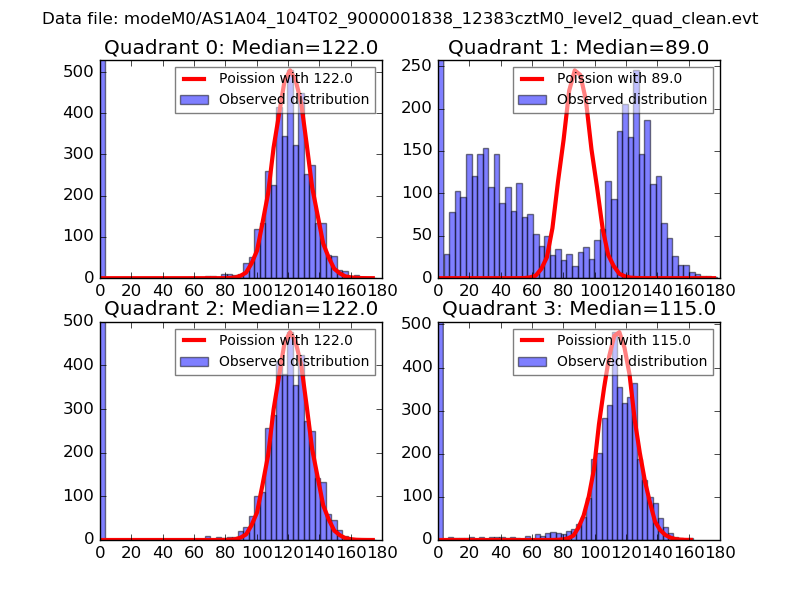 |
 |
| Quadrant-wise count rates Data is divided into 100 sec bins |
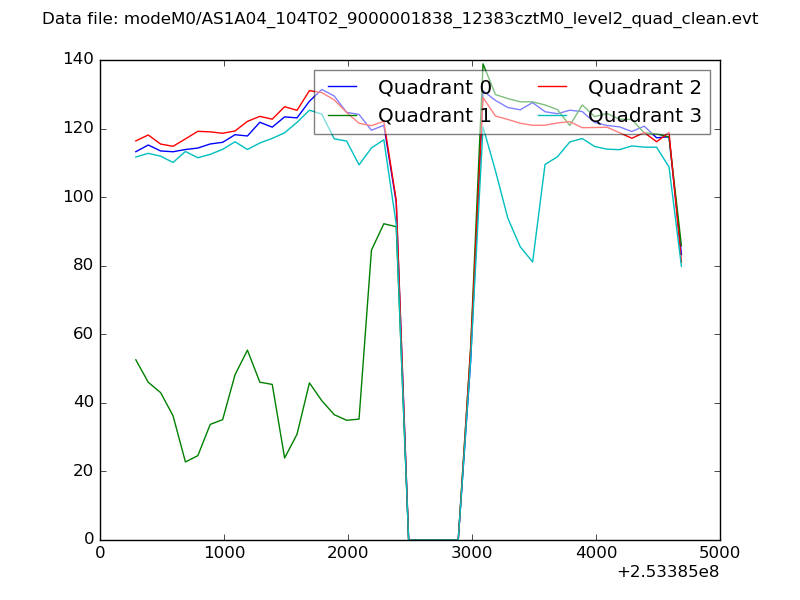 |
|
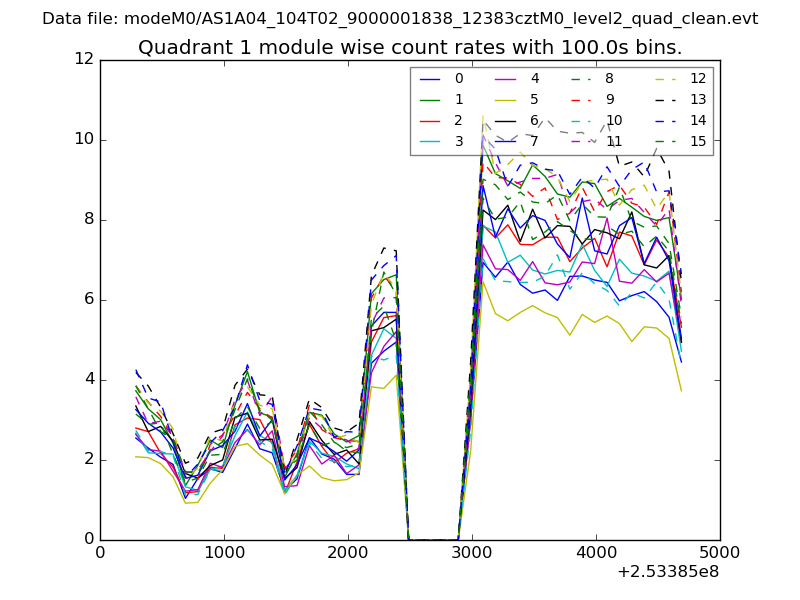
| Module-wise count rates for Quadrant A Data is divided into 100 sec bins |
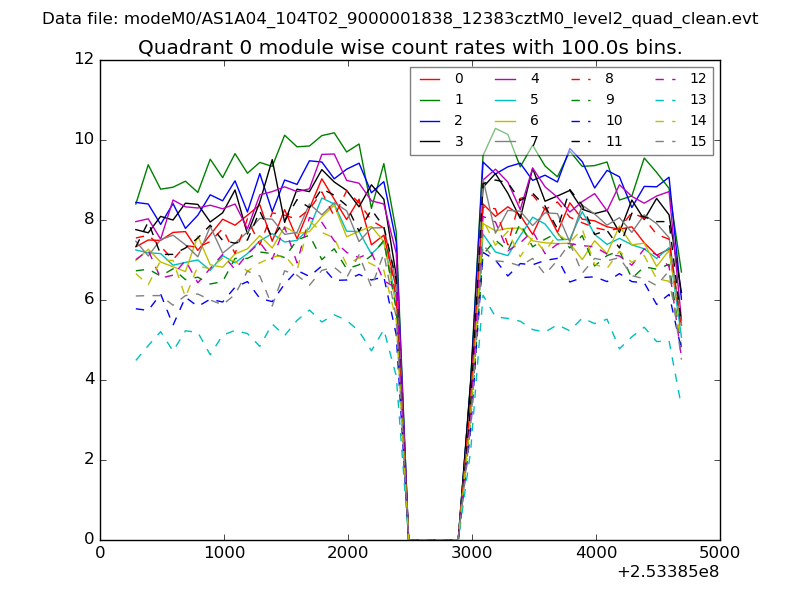 |
 |
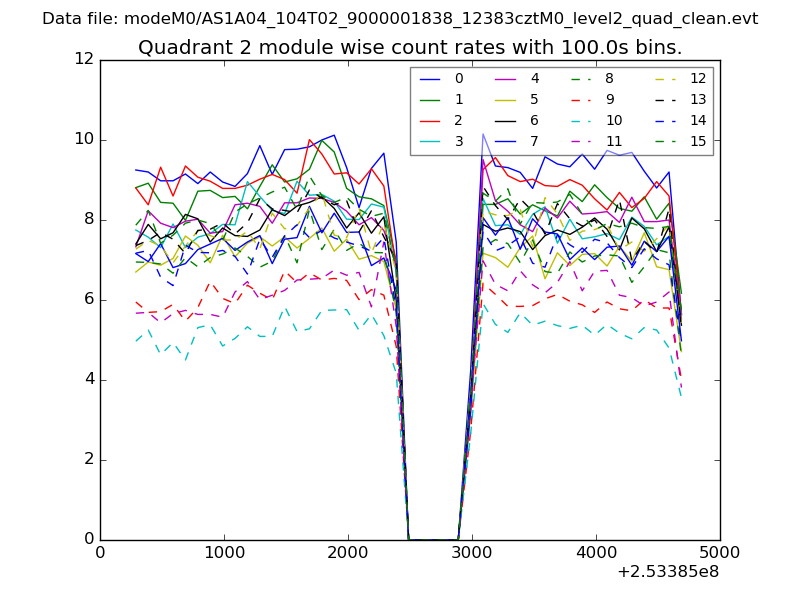
| Module-wise count rates for Quadrant B Data is divided into 100 sec bins |
 |
 |
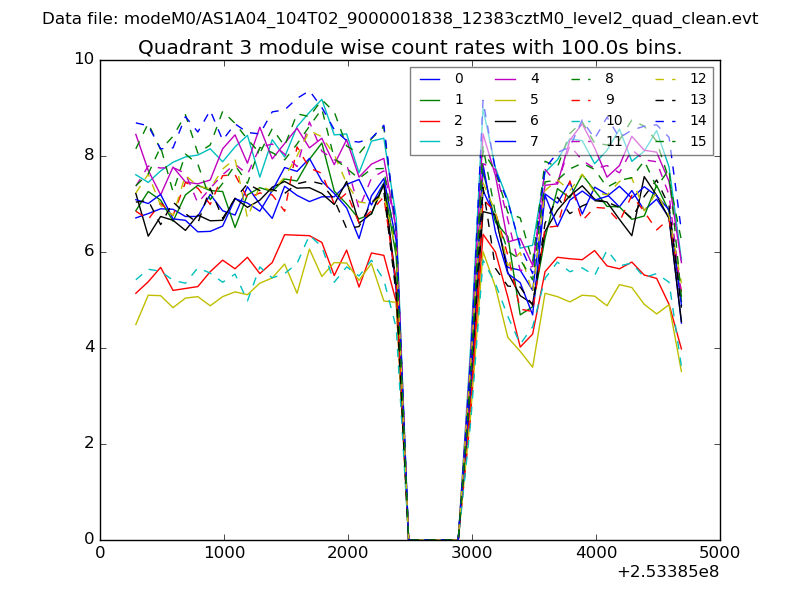
| Module-wise count rates for Quadrant C Data is divided into 100 sec bins |
 |
 |
| Module-wise count rates for Quadrant D Data is divided into 100 sec bins |
 |
 |
| Parameter | Plot |
|---|---|
| CZT HV Monitor | 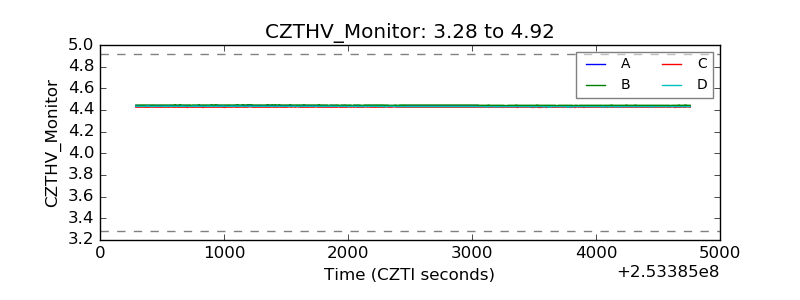 |
| D_VDD | 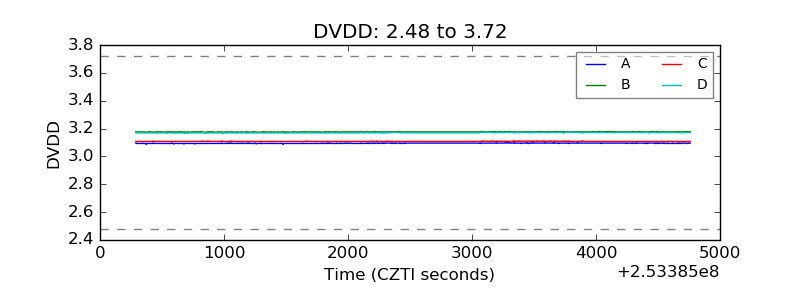 |
| Temperature 1 | 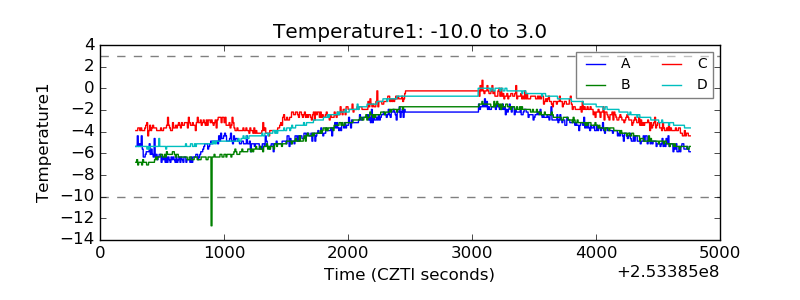 |
| Veto HV Monitor | 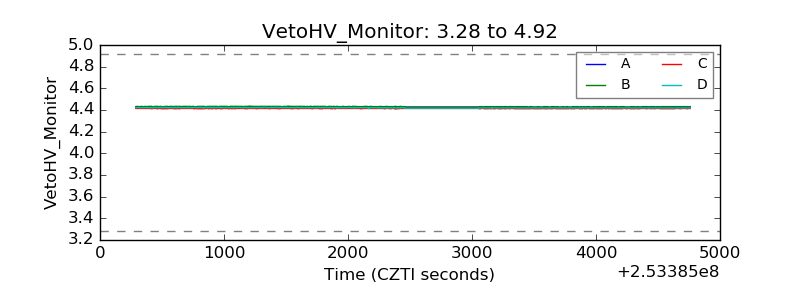 |
| Veto LLD | 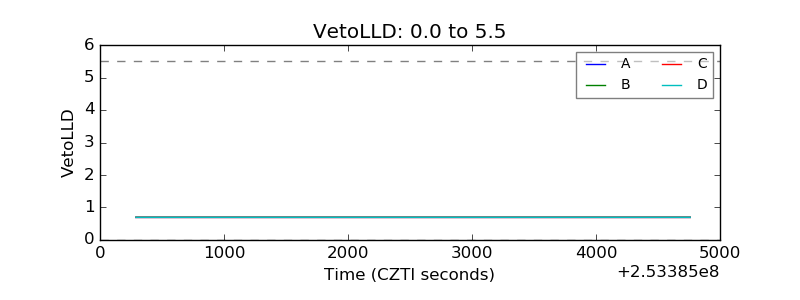 |
| Alpha Counter | 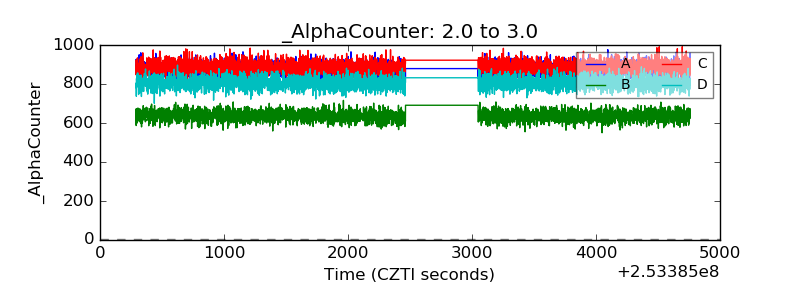 |
| _CPM_Rate | 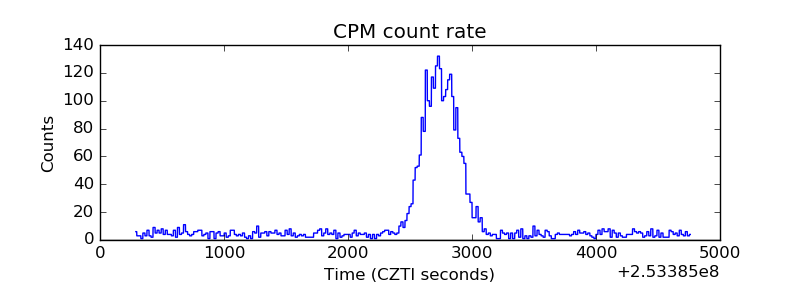 |
| CZT Counter | 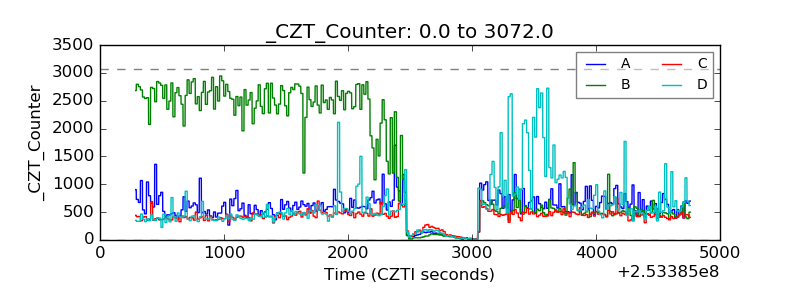 |
| +2.5 Volts monitor |  |
| +5 Volts monitor |  |
| _ROLL_ROT | 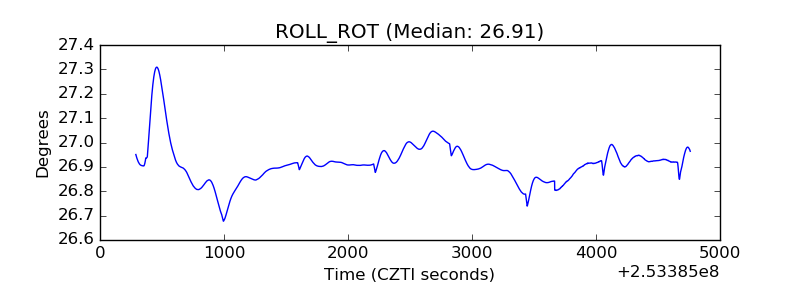 |
| _Roll_DEC | 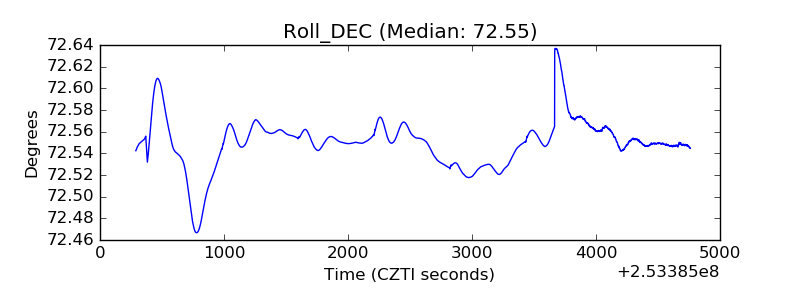 |
| _Roll_RA | 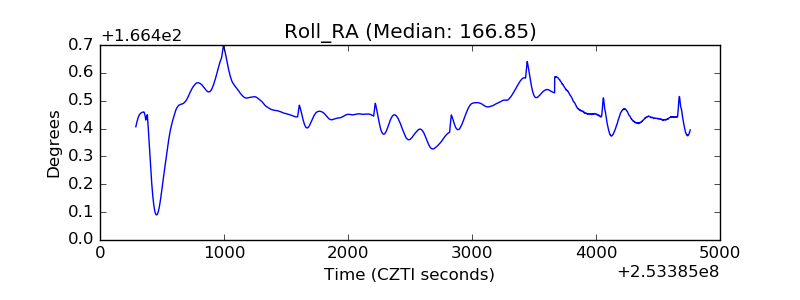 |
| Veto Counter | 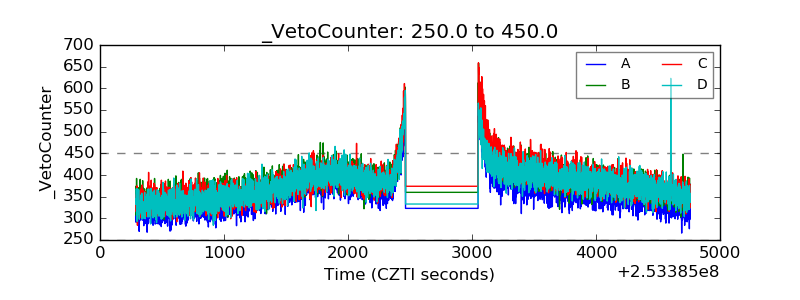 |