| Param | Original file | Final file |
|---|---|---|
| Filename | modeM0/AS1A04_104T02_9000001838_12385cztM0_level2.evt | modeM0/AS1A04_104T02_9000001838_12385cztM0_level2_quad_clean.evt |
| Size (bytes) | 621,331,200 | 119,413,440 |
| Size | 592.5 MB | 113.9 MB |
| Events in quadrant A | 3,882,726 | 810,161 |
| Events in quadrant B | 7,260,469 | 751,456 |
| Events in quadrant C | 2,945,393 | 823,144 |
| Events in quadrant D | 4,282,358 | 771,982 |
| Mode SS | |||
|---|---|---|---|
| Quadrant | BADHDUFLAG | Total packets | Discarded packets |
| A | 0 | 136 | 0 |
| B | 0 | 136 | 0 |
| C | 0 | 136 | 0 |
| D | 0 | 136 | 0 |
| Mode M9 | |||
|---|---|---|---|
| Quadrant | BADHDUFLAG | Total packets | Discarded packets |
| A | 0 | 20 | 0 |
| B | 0 | 20 | 0 |
| C | 0 | 20 | 0 |
| D | 0 | 20 | 0 |
| Mode M0 | |||
|---|---|---|---|
| Quadrant | BADHDUFLAG | Total packets | Discarded packets |
| A | 0 | 16087 | 3 |
| B | 0 | 25888 | 2 |
| C | 0 | 13480 | 2 |
| D | 0 | 17394 | 2 |
| Quadrant | Total seconds | Saturated seconds | Saturation percentage |
|---|---|---|---|
| A | 6586 | 107 | 1.624658% |
| B | 6586 | 1517 | 23.033708% |
| C | 6586 | 21 | 0.318858% |
| D | 6586 | 244 | 3.704828% |
Noise dominated data is calculated using 1-second bins in cleaned event files. If a bin has >2000 counts, and if more than 50% of those come from <1% of pixels, then it is considered to be noise-dominated and hence unusable.
| Quadrant | # 1 sec bins | Bins with >0 counts | Bins with >2000 counts | High rate bins dominated by noise | Noise dominated (total time) | Noise dominated (detector-on time) | Marked lightcurve |
|---|---|---|---|---|---|---|---|
| A | 8557 | 6587 | 6 | 6 | 0.07% | 0.09% | 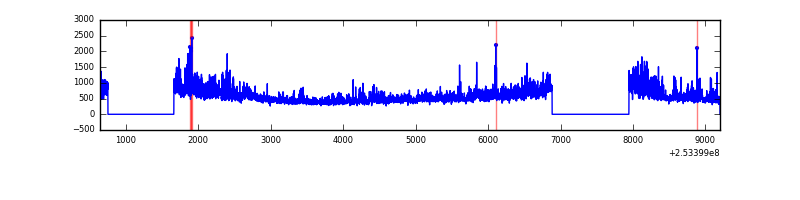 |
| B | 8557 | 6587 | 1459 | 1459 | 17.05% | 22.15% | 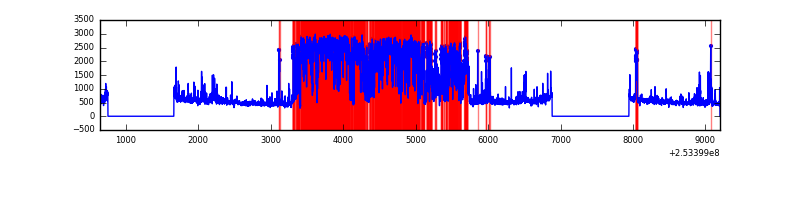 |
| C | 8557 | 6588 | 3 | 3 | 0.04% | 0.05% | 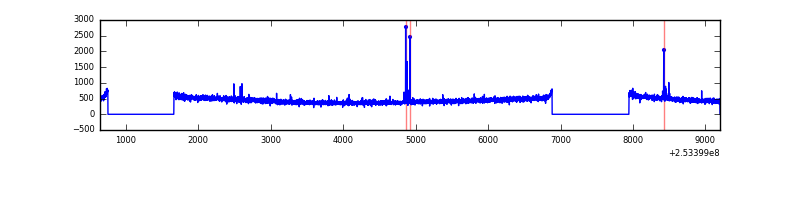 |
| D | 8557 | 6588 | 187 | 187 | 2.19% | 2.84% | 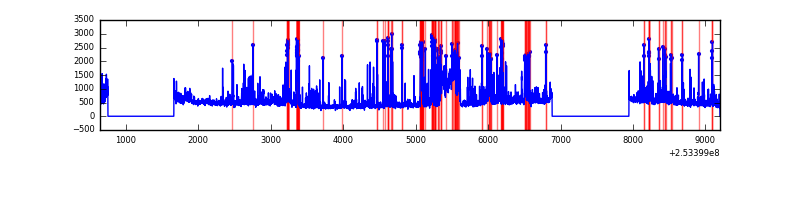 |
Top three noisy pixels from each quadrant. If the there are fewer than three noisy pixels in the level2.evt file, extra rows are filled as -1
| Pixel properties | Quadrant properties | ||||||
|---|---|---|---|---|---|---|---|
| Quadrant | DetID | PixID | Counts | Sigma | Mean | Median | Sigma |
| A | 13 | 251 | 251649 | 1630.74 | 757 | 741 | 153.9 |
| A | 1 | 162 | 232486 | 1506.2 | 757 | 741 | 153.9 |
| A | 1 | 178 | 125956 | 813.82 | 757 | 741 | 153.9 |
| B | 2 | 32 | 3204683 | 23452.16 | 716 | 698 | 136.6 |
| B | 2 | 48 | 724924 | 5301.1 | 716 | 698 | 136.6 |
| B | 4 | 239 | 283044 | 2066.68 | 716 | 698 | 136.6 |
| C | 14 | 234 | 21109 | 117.71 | 750 | 753 | 172.9 |
| C | 13 | 61 | 5560 | 27.79 | 750 | 753 | 172.9 |
| C | 3 | 202 | 1839 | 6.28 | 750 | 753 | 172.9 |
| D | 1 | 52 | 1060528 | 5973.76 | 732 | 711 | 177.4 |
| D | 13 | 104 | 128284 | 719.08 | 732 | 711 | 177.4 |
| D | 10 | 199 | 119151 | 667.6 | 732 | 711 | 177.4 |
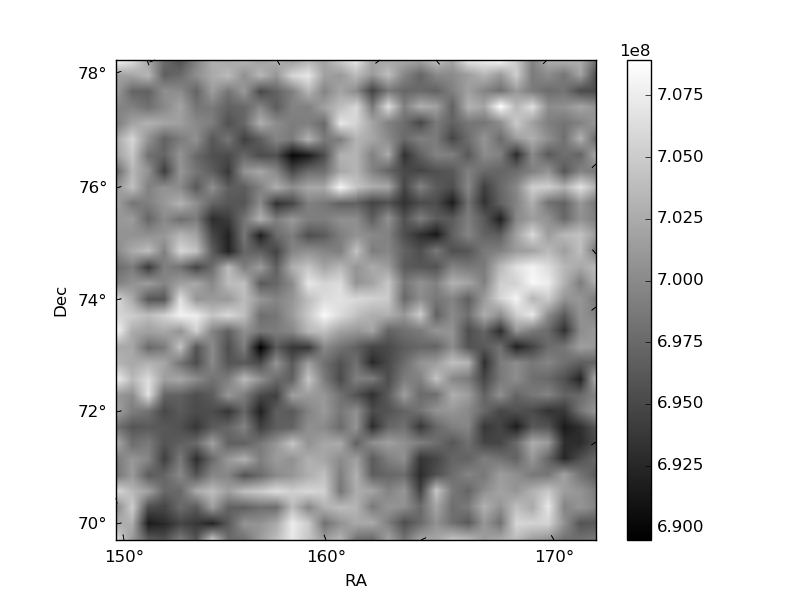
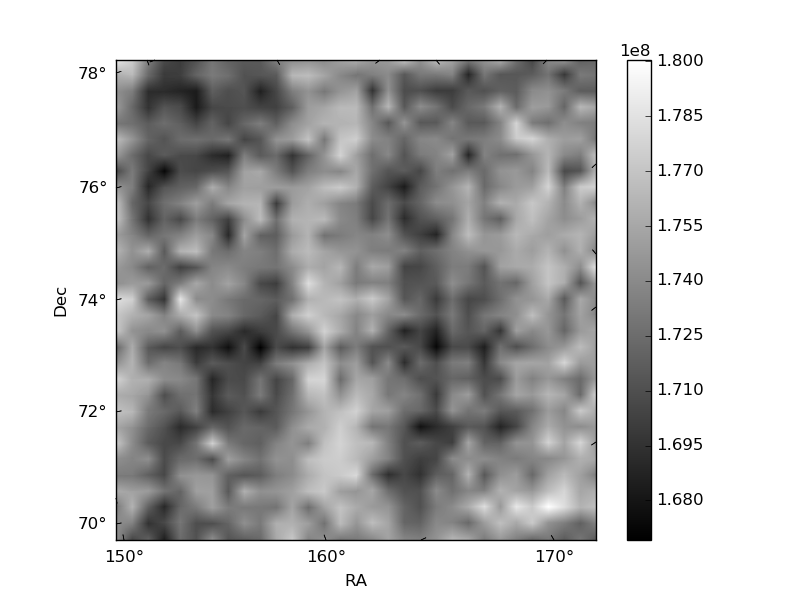
Histogram calculated using DETX and DETY for each event in the final _common_clean file
| Quadrant A | 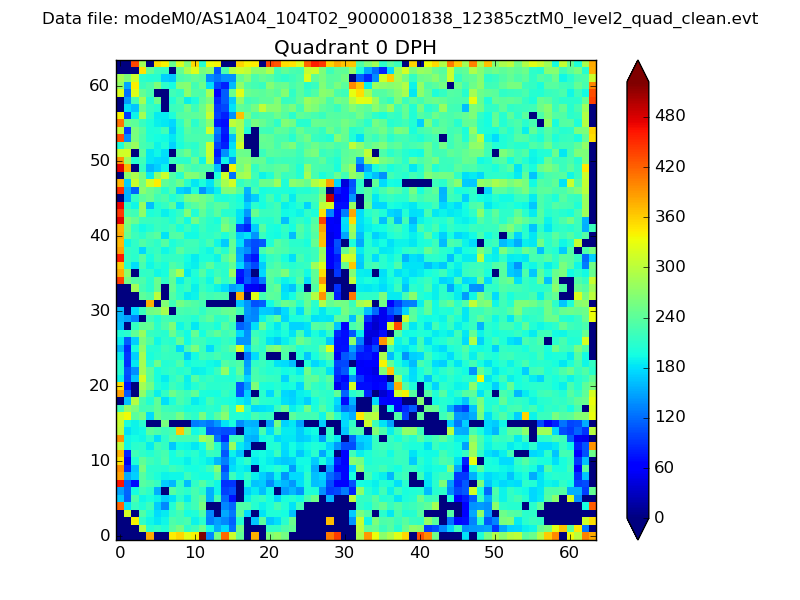 |
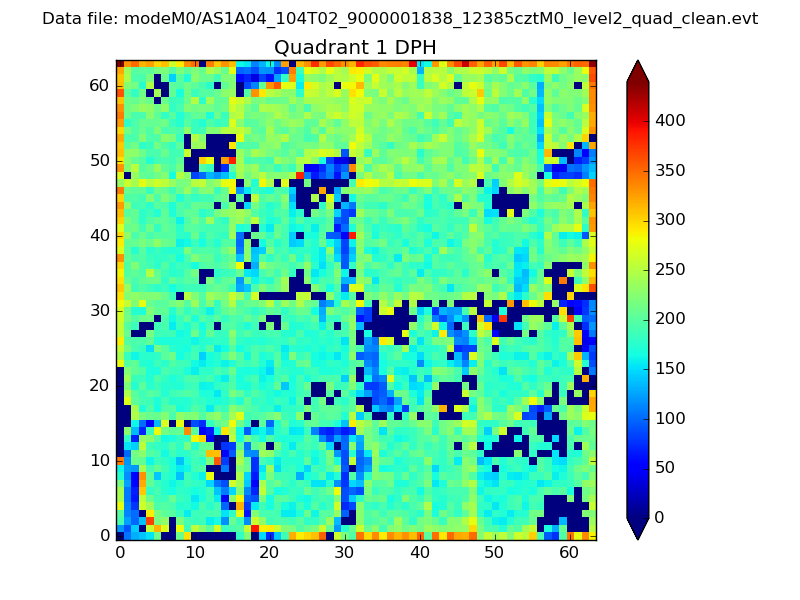 |
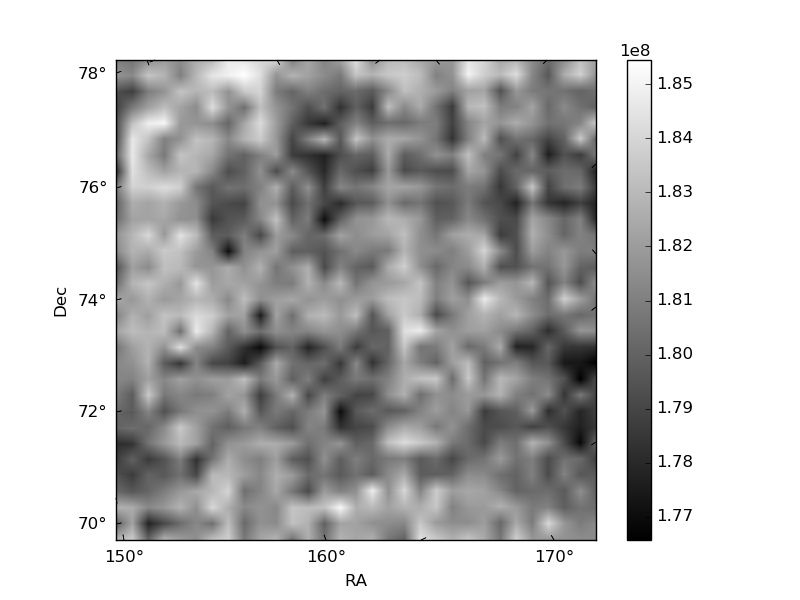
Quadrant B |
|---|---|---|---|
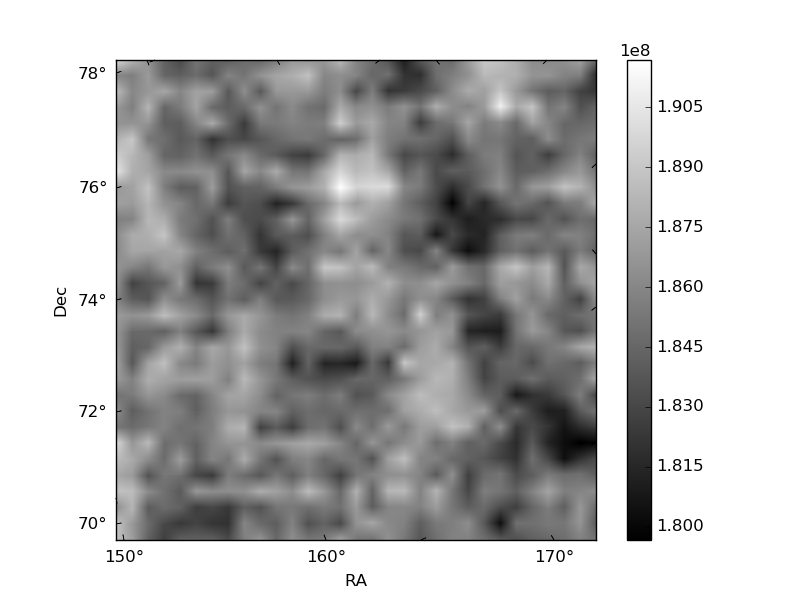
| Quadrant D | 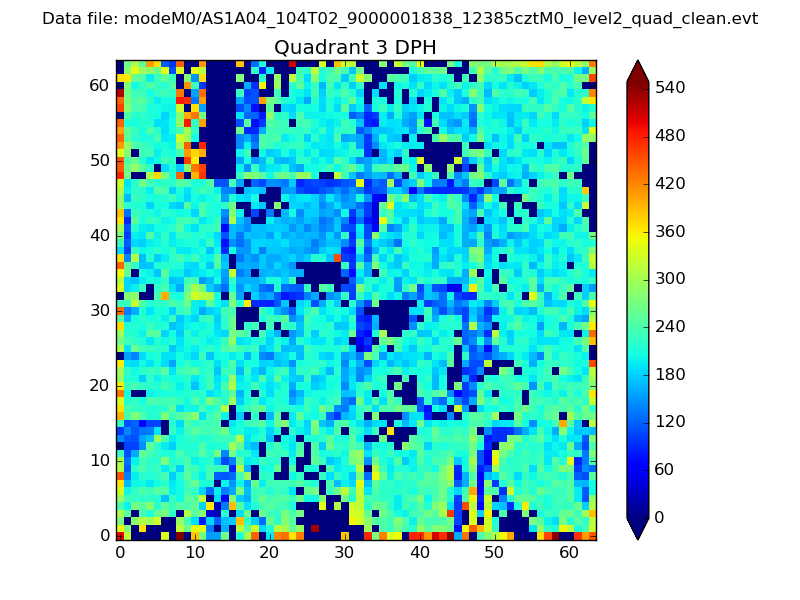 |
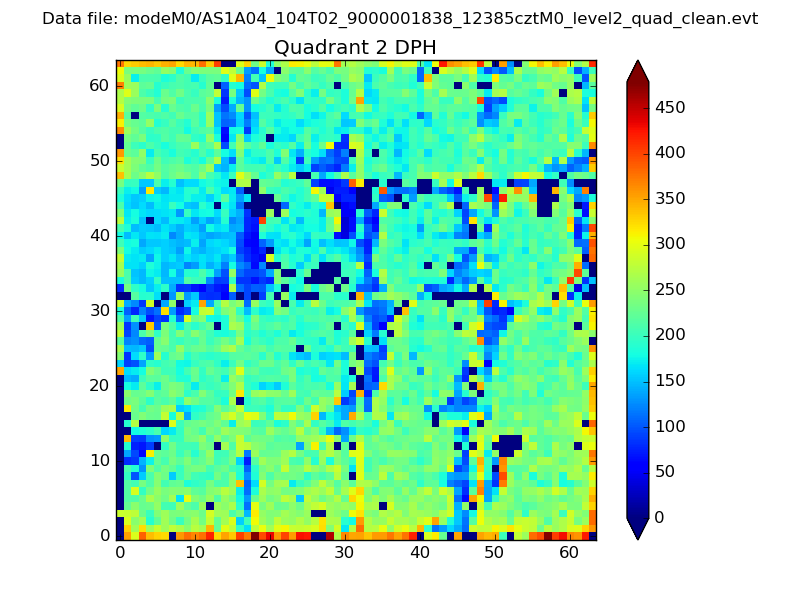 |
Quadrant C |
| Plot type | Count rate plots | Images |
|---|---|---|
| Comparison with Poisson distribution Blue bars denote a histogram of data divided into 1 sec bins. Red curve is a Poisson curve with rate = median count rate of data. |
 |
 |
| Quadrant-wise count rates Data is divided into 100 sec bins |
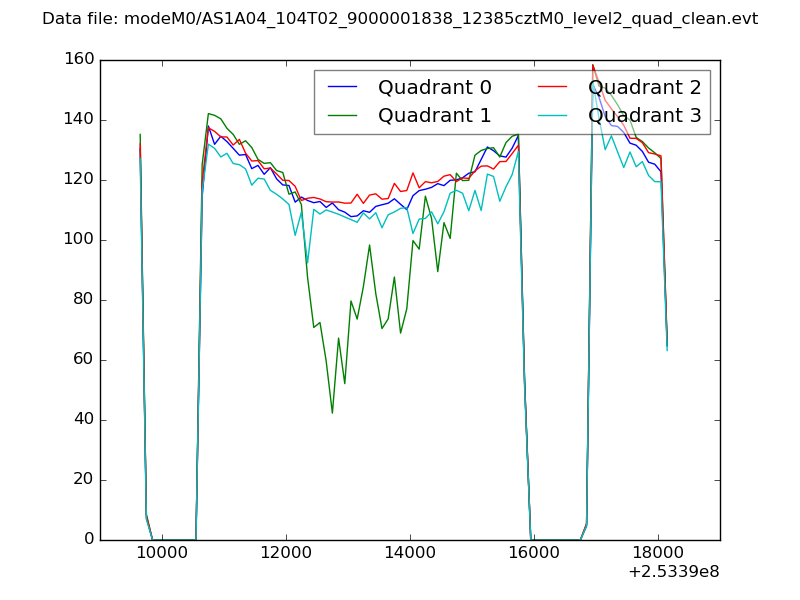 |
|
| Module-wise count rates for Quadrant A Data is divided into 100 sec bins |
 |
 |
| Module-wise count rates for Quadrant B Data is divided into 100 sec bins |
 |
 |
| Module-wise count rates for Quadrant C Data is divided into 100 sec bins |
 |
 |
| Module-wise count rates for Quadrant D Data is divided into 100 sec bins |
 |
 |
| Parameter | Plot |
|---|---|
| CZT HV Monitor | 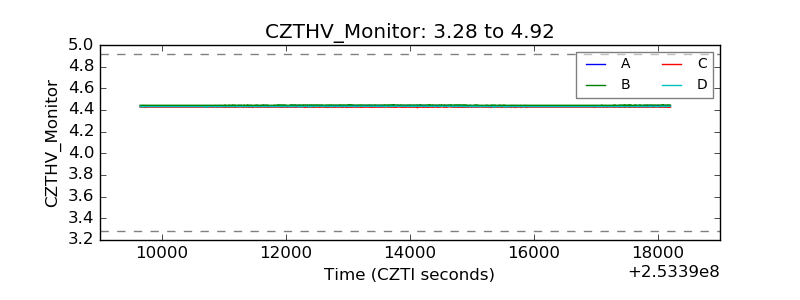 |
| D_VDD | 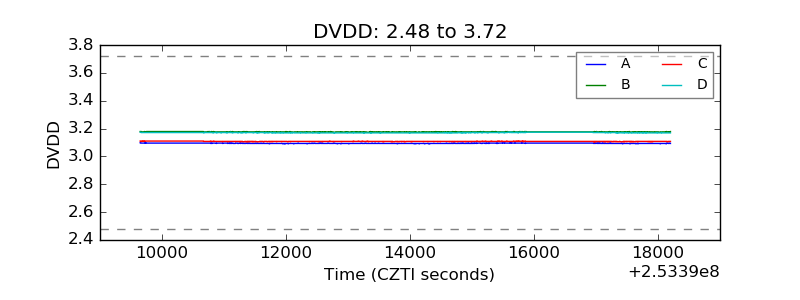 |
| Temperature 1 |  |
| Veto HV Monitor | 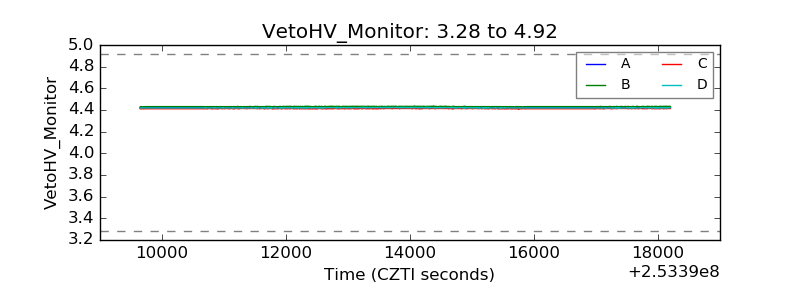 |
| Veto LLD | 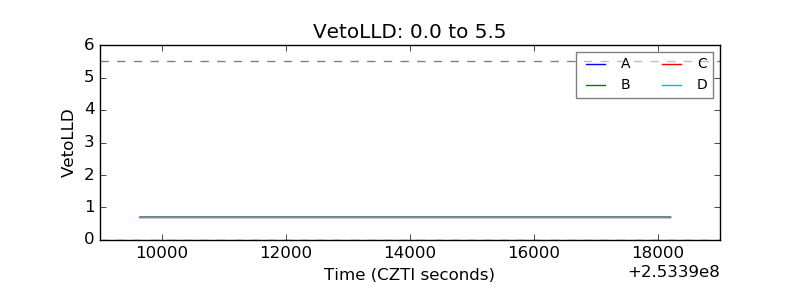 |
| Alpha Counter | 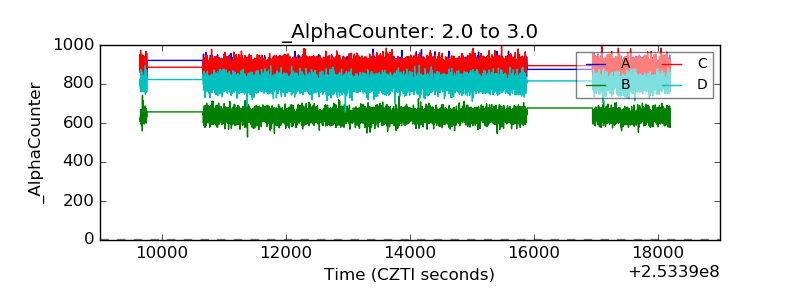 |
| _CPM_Rate | 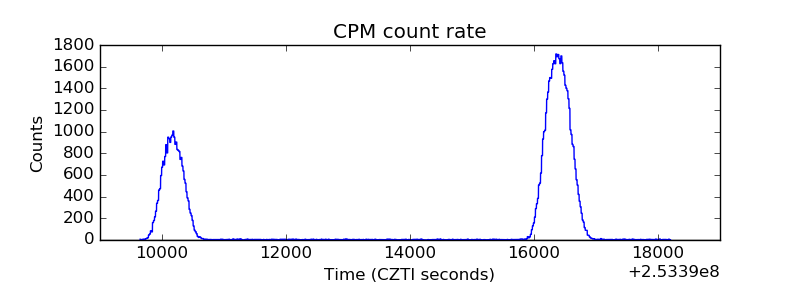 |
| CZT Counter | 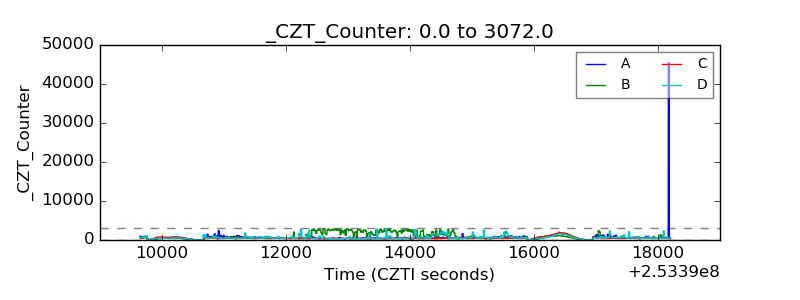 |
| +2.5 Volts monitor |  |
| +5 Volts monitor |  |
| _ROLL_ROT |  |
| _Roll_DEC |  |
| _Roll_RA | 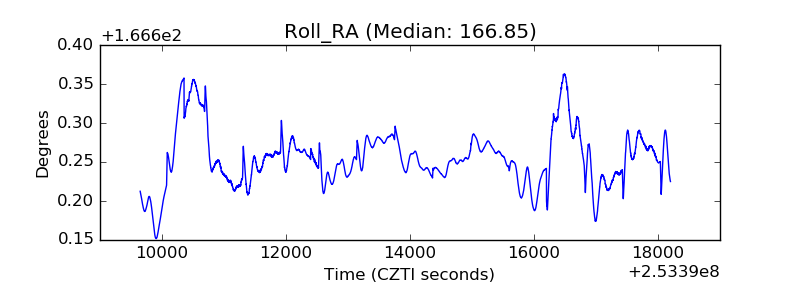 |
| Veto Counter |  |