| Param | Original file | Final file |
|---|---|---|
| Filename | modeM0/AS1A04_104T02_9000001838_12387cztM0_level2.evt | modeM0/AS1A04_104T02_9000001838_12387cztM0_level2_quad_clean.evt |
| Size (bytes) | 549,725,760 | 126,002,880 |
| Size | 524.3 MB | 120.2 MB |
| Events in quadrant A | 3,691,069 | 852,063 |
| Events in quadrant B | 5,531,869 | 831,003 |
| Events in quadrant C | 3,019,419 | 860,027 |
| Events in quadrant D | 3,954,009 | 808,205 |
| Mode SS | |||
|---|---|---|---|
| Quadrant | BADHDUFLAG | Total packets | Discarded packets |
| A | 0 | 136 | 0 |
| B | 0 | 136 | 0 |
| C | 0 | 136 | 0 |
| D | 0 | 136 | 0 |
| Mode M9 | |||
|---|---|---|---|
| Quadrant | BADHDUFLAG | Total packets | Discarded packets |
| A | 0 | 14 | 0 |
| B | 0 | 14 | 0 |
| C | 0 | 14 | 0 |
| D | 0 | 15 | 0 |
| Mode M0 | |||
|---|---|---|---|
| Quadrant | BADHDUFLAG | Total packets | Discarded packets |
| A | 0 | 15474 | 3 |
| B | 0 | 20842 | 2 |
| C | 0 | 13796 | 2 |
| D | 0 | 16527 | 2 |
| Quadrant | Total seconds | Saturated seconds | Saturation percentage |
|---|---|---|---|
| A | 6664 | 63 | 0.945378% |
| B | 6664 | 722 | 10.834334% |
| C | 6664 | 20 | 0.300120% |
| D | 6664 | 134 | 2.010804% |
Noise dominated data is calculated using 1-second bins in cleaned event files. If a bin has >2000 counts, and if more than 50% of those come from <1% of pixels, then it is considered to be noise-dominated and hence unusable.
| Quadrant | # 1 sec bins | Bins with >0 counts | Bins with >2000 counts | High rate bins dominated by noise | Noise dominated (total time) | Noise dominated (detector-on time) | Marked lightcurve |
|---|---|---|---|---|---|---|---|
| A | 7820 | 6666 | 4 | 4 | 0.05% | 0.06% | 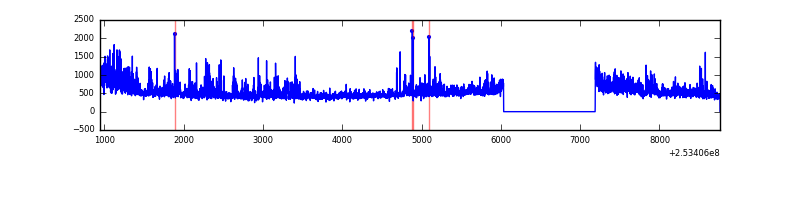 |
| B | 7820 | 6666 | 680 | 680 | 8.70% | 10.20% | 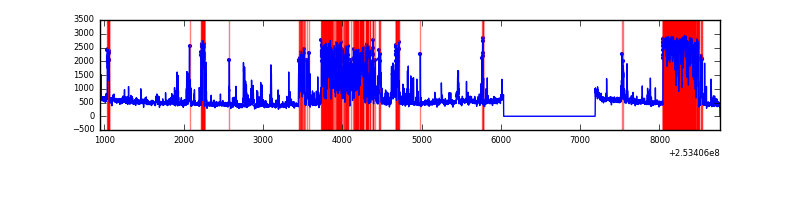 |
| C | 7820 | 6666 | 8 | 8 | 0.10% | 0.12% | 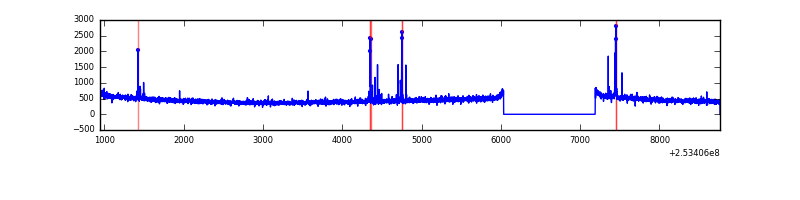 |
| D | 7820 | 6666 | 130 | 130 | 1.66% | 1.95% | 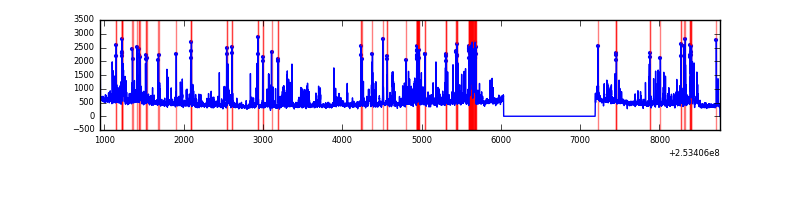 |
Top three noisy pixels from each quadrant. If the there are fewer than three noisy pixels in the level2.evt file, extra rows are filled as -1
| Pixel properties | Quadrant properties | ||||||
|---|---|---|---|---|---|---|---|
| Quadrant | DetID | PixID | Counts | Sigma | Mean | Median | Sigma |
| A | 1 | 162 | 175478 | 1136.42 | 769 | 754 | 153.7 |
| A | 13 | 251 | 144774 | 936.72 | 769 | 754 | 153.7 |
| A | 15 | 239 | 101205 | 653.34 | 769 | 754 | 153.7 |
| B | 2 | 32 | 1628063 | 11640.49 | 754 | 737 | 139.8 |
| B | 2 | 48 | 450499 | 3217.21 | 754 | 737 | 139.8 |
| B | 4 | 239 | 302318 | 2157.25 | 754 | 737 | 139.8 |
| C | 14 | 234 | 70515 | 400.82 | 756 | 761 | 174.0 |
| C | 13 | 61 | 5611 | 27.87 | 756 | 761 | 174.0 |
| C | 8 | 222 | 2208 | 8.31 | 756 | 761 | 174.0 |
| D | 1 | 52 | 631268 | 3560.62 | 737 | 715 | 177.1 |
| D | 13 | 104 | 229459 | 1291.68 | 737 | 715 | 177.1 |
| D | 10 | 199 | 110058 | 617.44 | 737 | 715 | 177.1 |
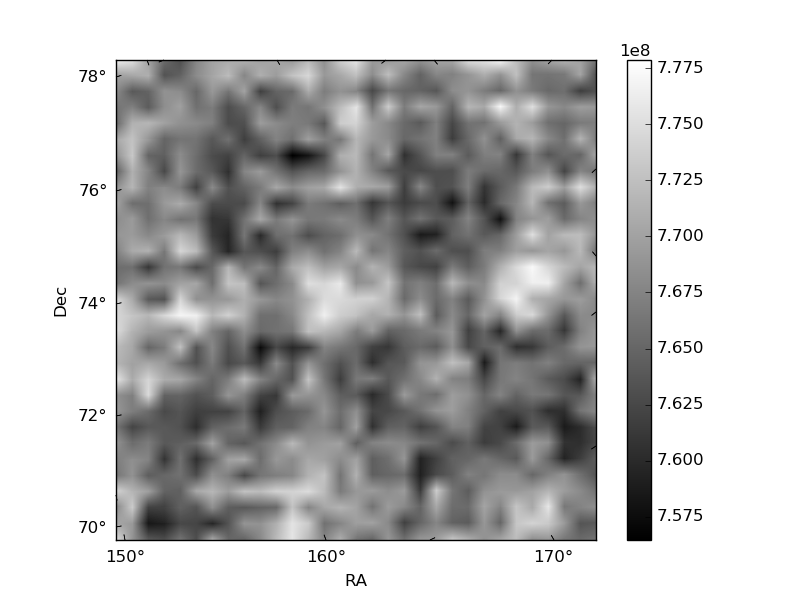
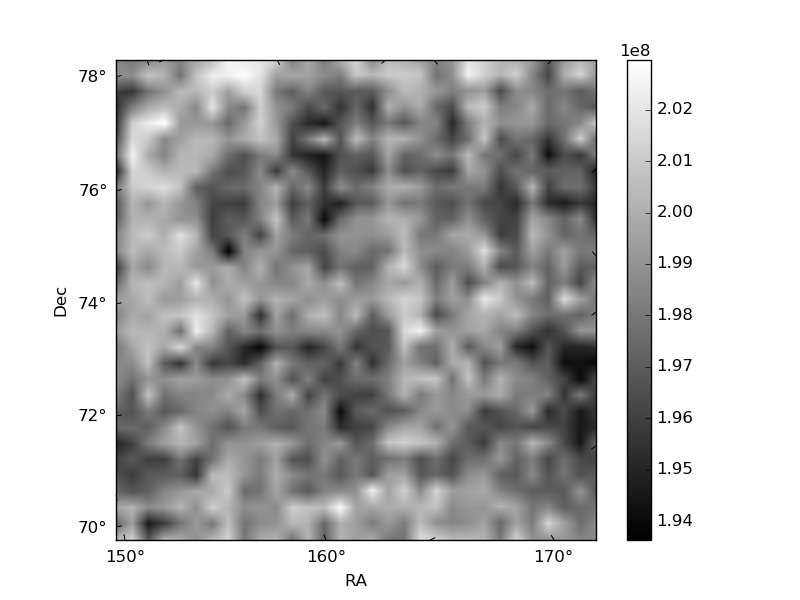
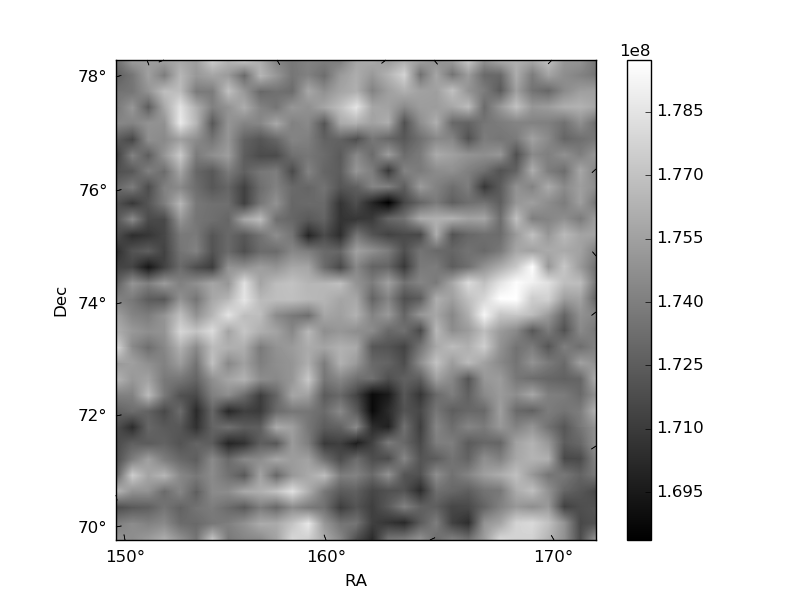
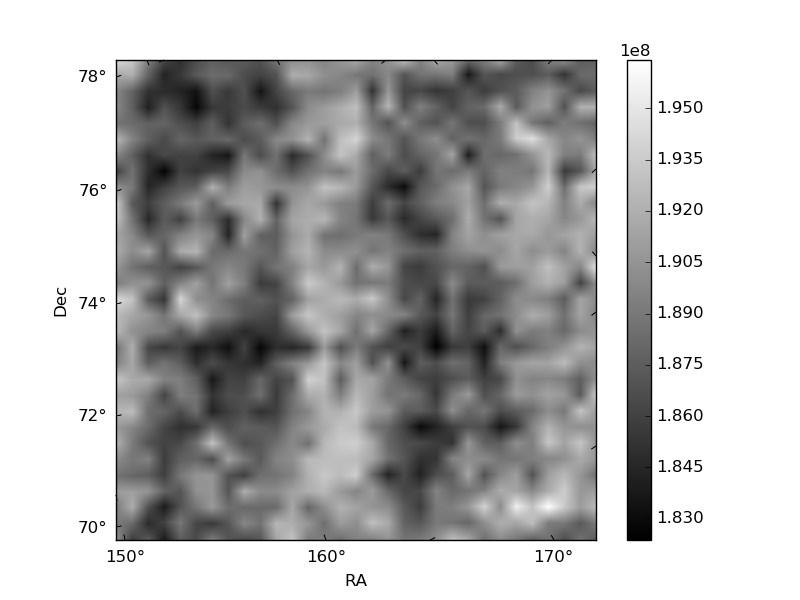
Histogram calculated using DETX and DETY for each event in the final _common_clean file
| Quadrant A | 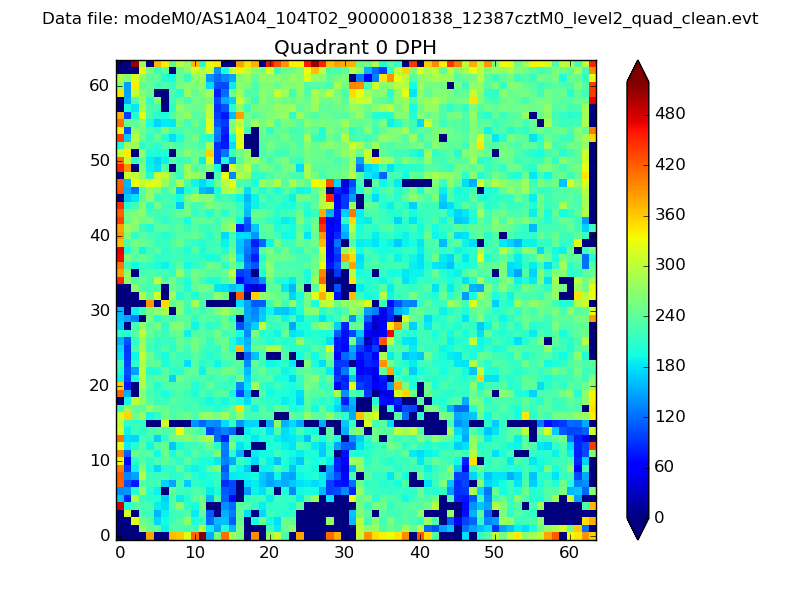 |
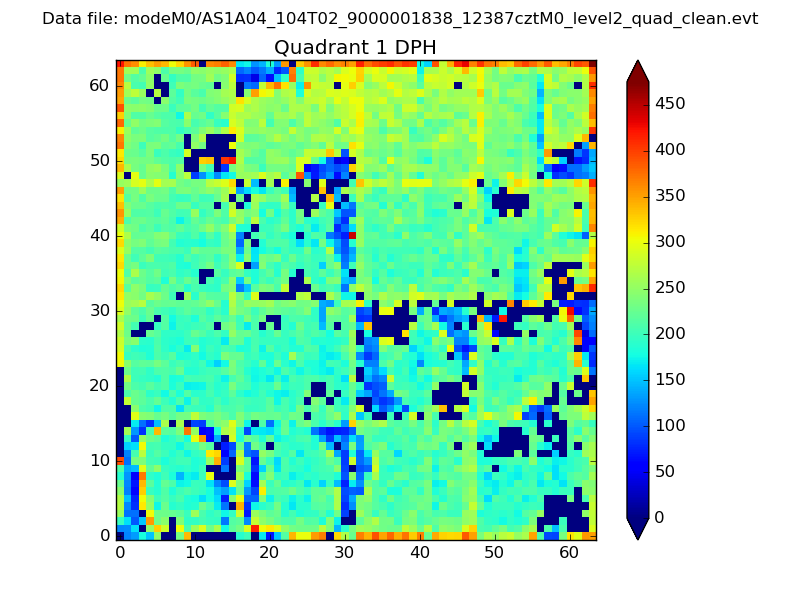 |
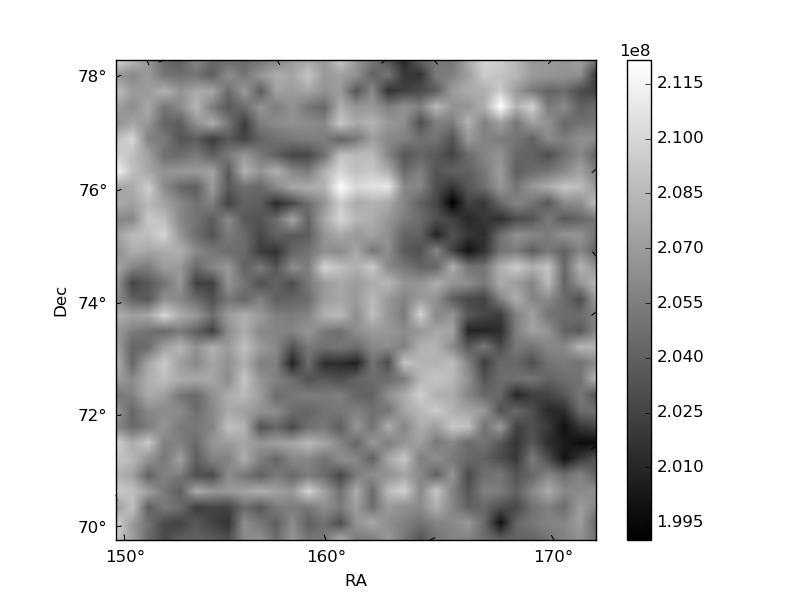
Quadrant B |
|---|---|---|---|
| Quadrant D | 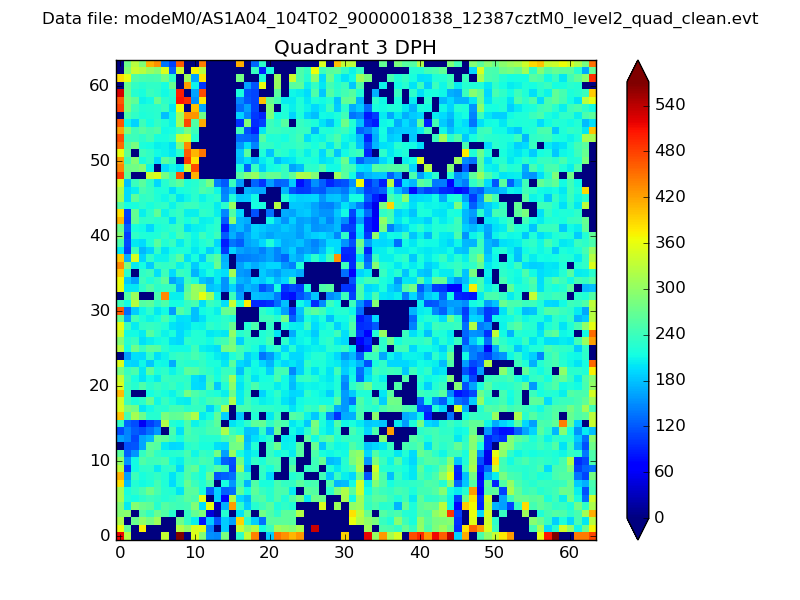 |
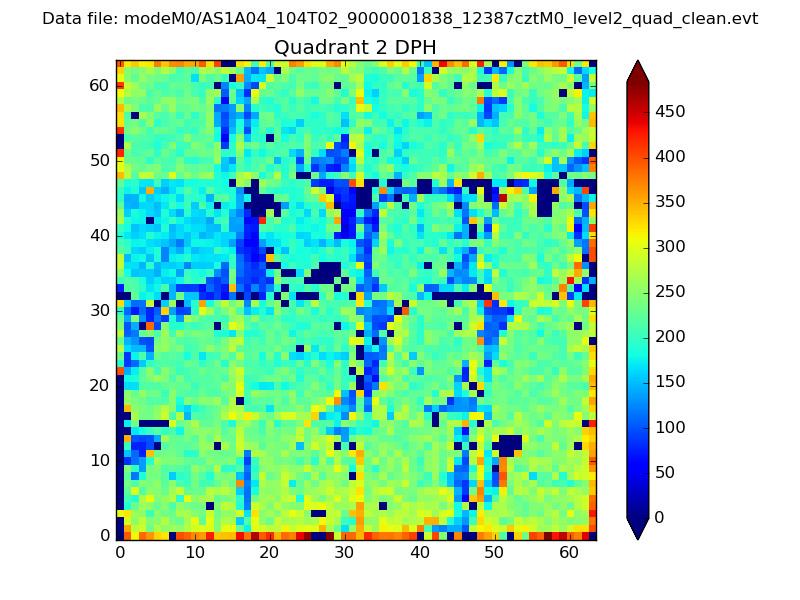 |
Quadrant C |
| Plot type | Count rate plots | Images |
|---|---|---|
| Comparison with Poisson distribution Blue bars denote a histogram of data divided into 1 sec bins. Red curve is a Poisson curve with rate = median count rate of data. |
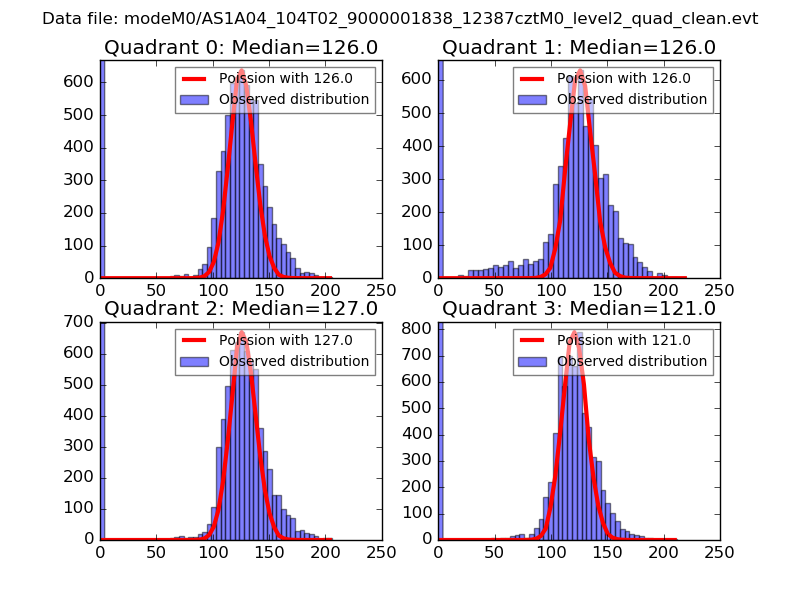 |
 |
| Quadrant-wise count rates Data is divided into 100 sec bins |
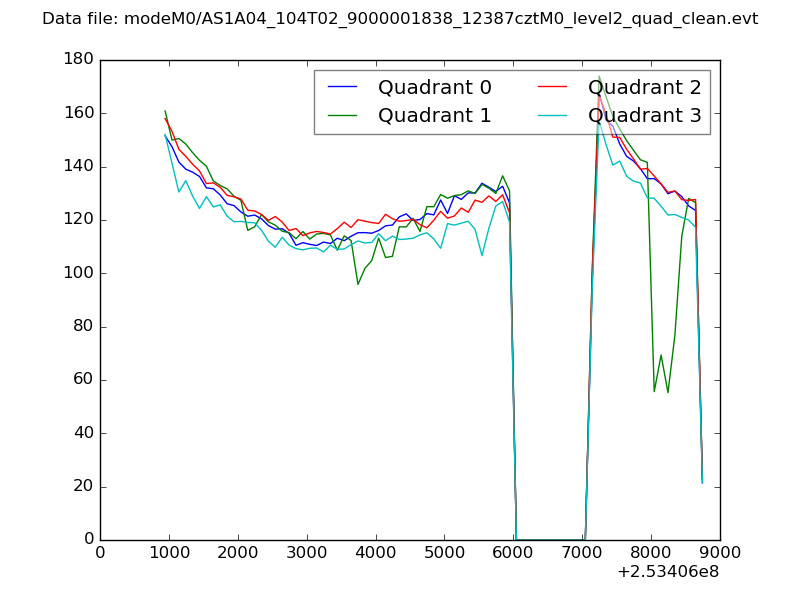 |
|
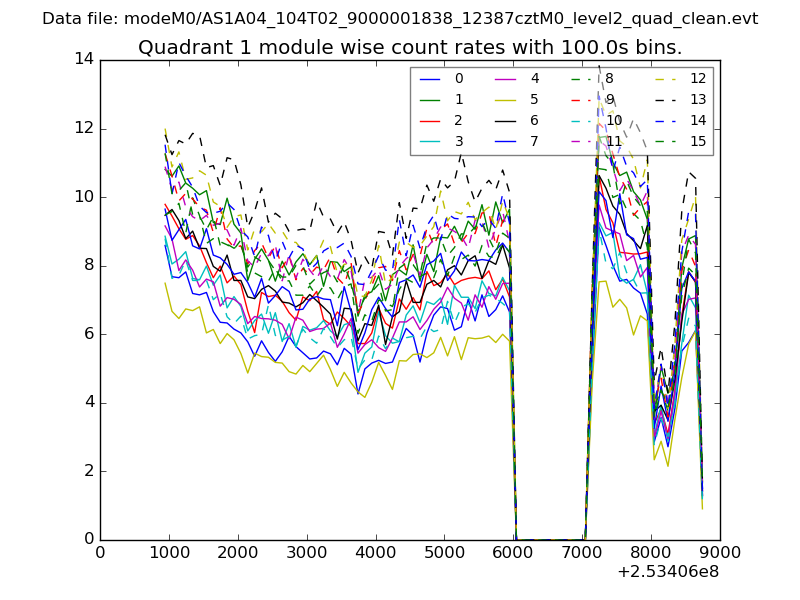
| Module-wise count rates for Quadrant A Data is divided into 100 sec bins |
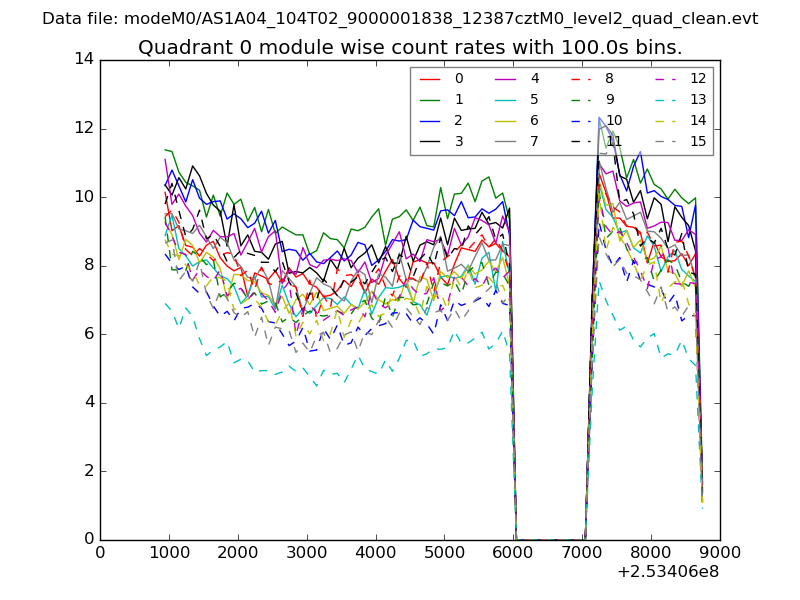 |
 |
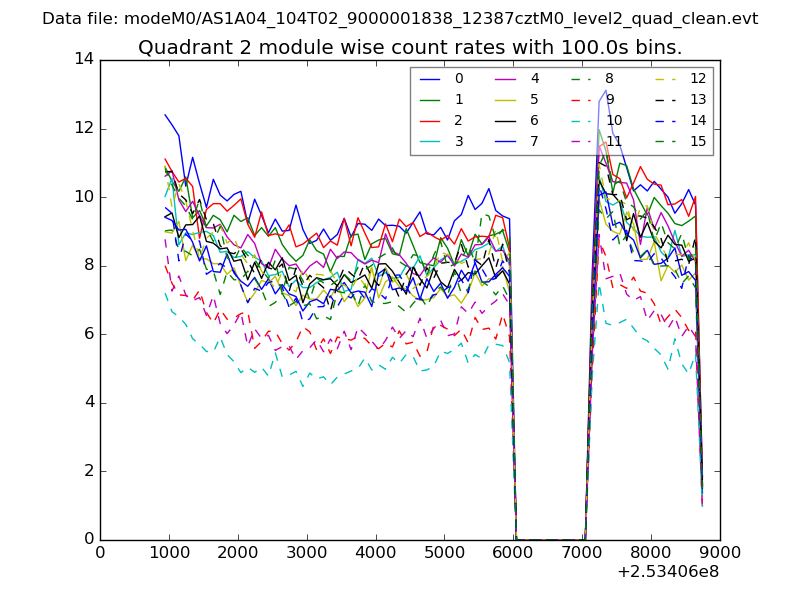
| Module-wise count rates for Quadrant B Data is divided into 100 sec bins |
 |
 |
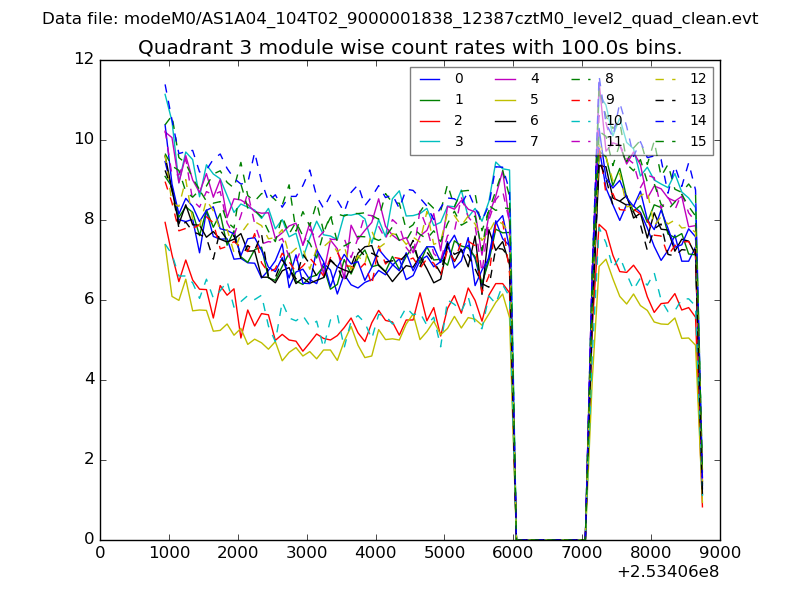
| Module-wise count rates for Quadrant C Data is divided into 100 sec bins |
 |
 |
| Module-wise count rates for Quadrant D Data is divided into 100 sec bins |
 |
 |
| Parameter | Plot |
|---|---|
| CZT HV Monitor | 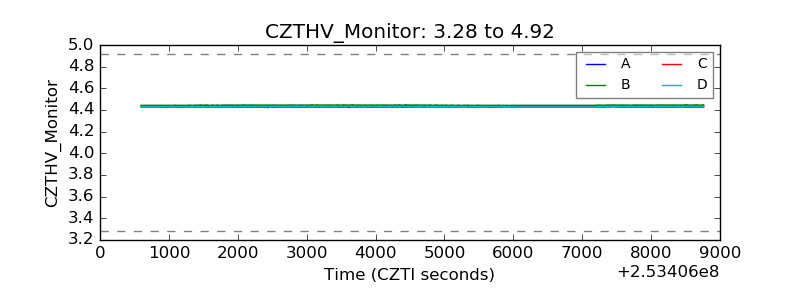 |
| D_VDD | 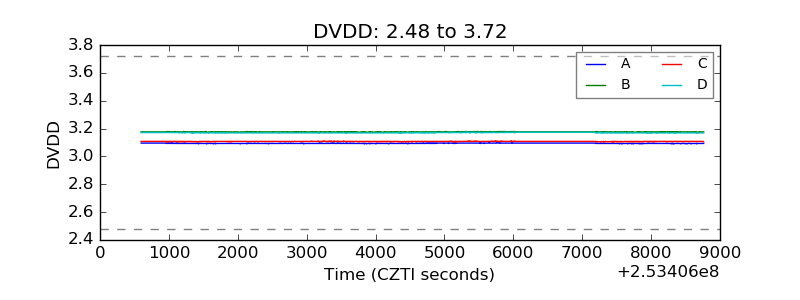 |
| Temperature 1 | 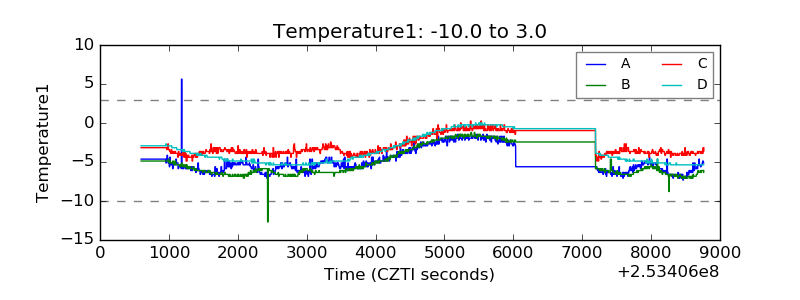 |
| Veto HV Monitor |  |
| Veto LLD | 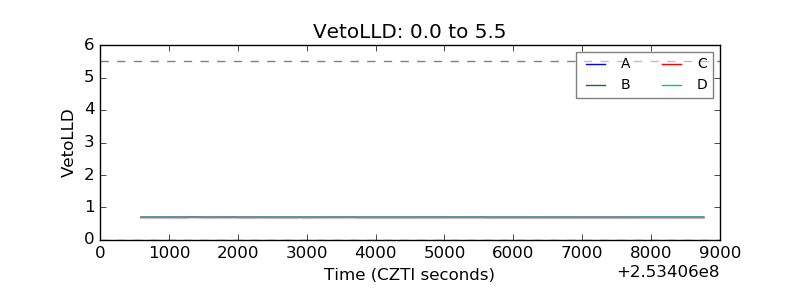 |
| Alpha Counter | 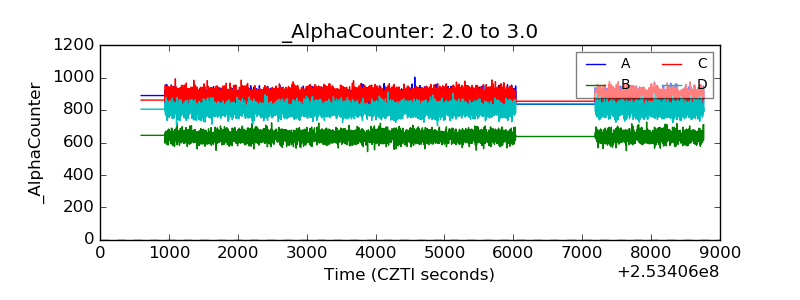 |
| _CPM_Rate | 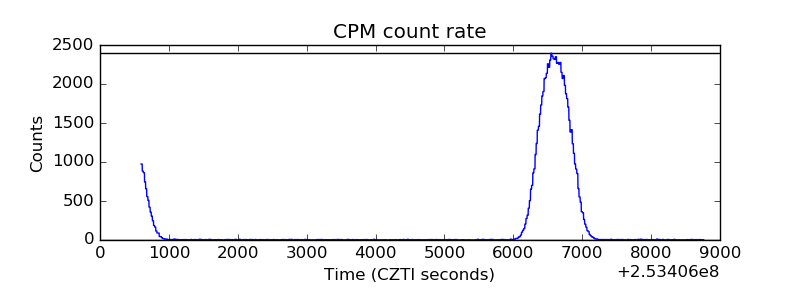 |
| CZT Counter |  |
| +2.5 Volts monitor |  |
| +5 Volts monitor |  |
| _ROLL_ROT | 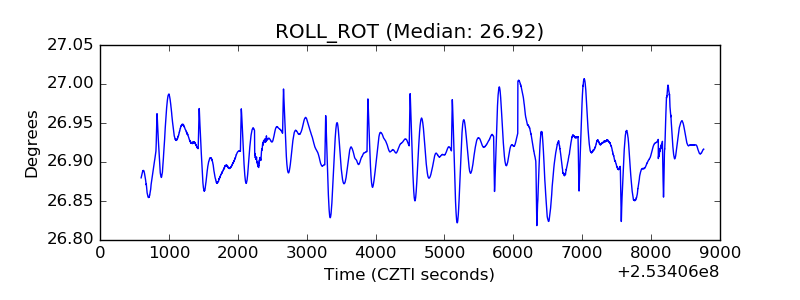 |
| _Roll_DEC | 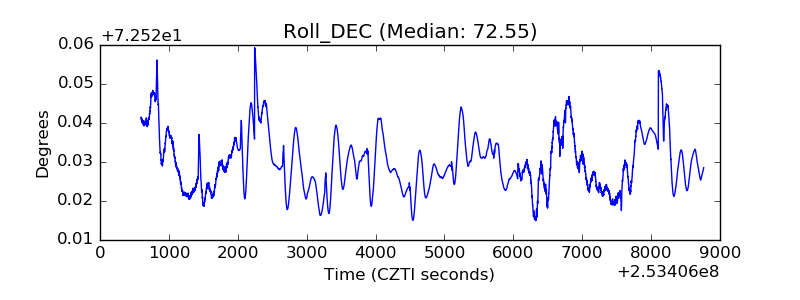 |
| _Roll_RA | 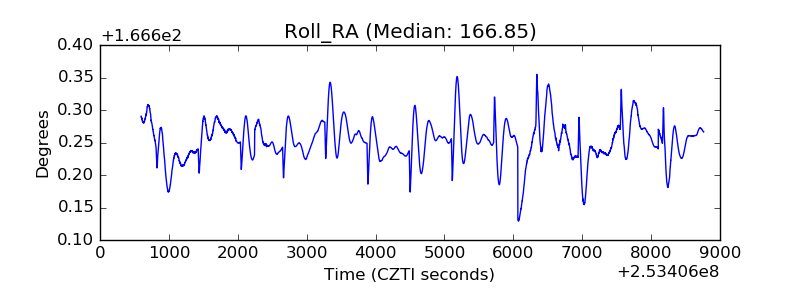 |
| Veto Counter | 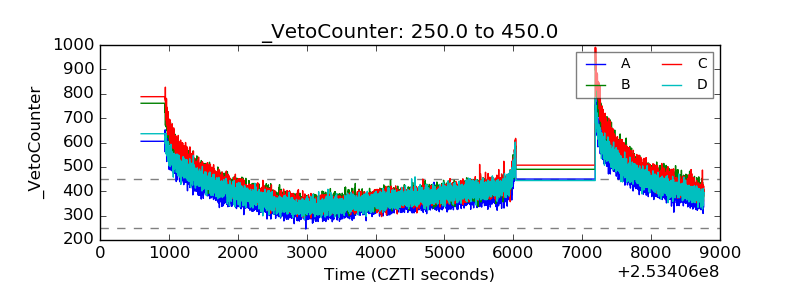 |