| Param | Original file | Final file |
|---|---|---|
| Filename | modeM0/AS1A04_104T02_9000001838_12389cztM0_level2.evt | modeM0/AS1A04_104T02_9000001838_12389cztM0_level2_quad_clean.evt |
| Size (bytes) | 647,706,240 | 122,074,560 |
| Size | 617.7 MB | 116.4 MB |
| Events in quadrant A | 3,911,196 | 854,636 |
| Events in quadrant B | 8,035,263 | 762,182 |
| Events in quadrant C | 2,860,138 | 850,699 |
| Events in quadrant D | 4,380,757 | 787,244 |
| Mode SS | |||
|---|---|---|---|
| Quadrant | BADHDUFLAG | Total packets | Discarded packets |
| A | 0 | 126 | 0 |
| B | 0 | 126 | 0 |
| C | 0 | 126 | 0 |
| D | 0 | 126 | 0 |
| Mode M9 | |||
|---|---|---|---|
| Quadrant | BADHDUFLAG | Total packets | Discarded packets |
| A | 0 | 14 | 0 |
| B | 0 | 14 | 0 |
| C | 0 | 14 | 0 |
| D | 0 | 14 | 0 |
| Mode M0 | |||
|---|---|---|---|
| Quadrant | BADHDUFLAG | Total packets | Discarded packets |
| A | 0 | 15909 | 2 |
| B | 0 | 28045 | 1 |
| C | 0 | 12890 | 1 |
| D | 0 | 17417 | 1 |
| Quadrant | Total seconds | Saturated seconds | Saturation percentage |
|---|---|---|---|
| A | 6338 | 58 | 0.915115% |
| B | 6338 | 1944 | 30.672136% |
| C | 6338 | 13 | 0.205112% |
| D | 6338 | 320 | 5.048911% |
Noise dominated data is calculated using 1-second bins in cleaned event files. If a bin has >2000 counts, and if more than 50% of those come from <1% of pixels, then it is considered to be noise-dominated and hence unusable.
| Quadrant | # 1 sec bins | Bins with >0 counts | Bins with >2000 counts | High rate bins dominated by noise | Noise dominated (total time) | Noise dominated (detector-on time) | Marked lightcurve |
|---|---|---|---|---|---|---|---|
| A | 7674 | 6340 | 8 | 8 | 0.10% | 0.13% | 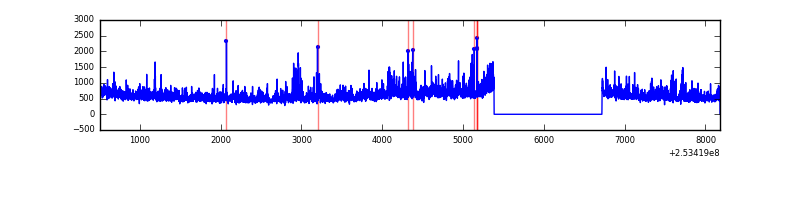 |
| B | 7673 | 6339 | 1899 | 1899 | 24.75% | 29.96% | 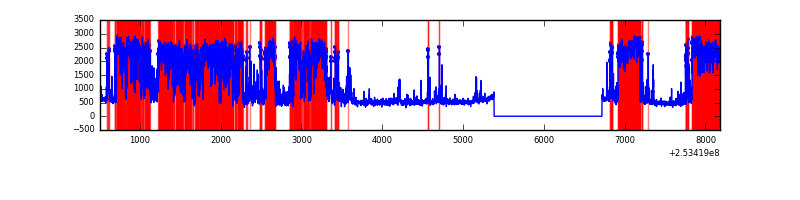 |
| C | 7674 | 6339 | 2 | 2 | 0.03% | 0.03% | 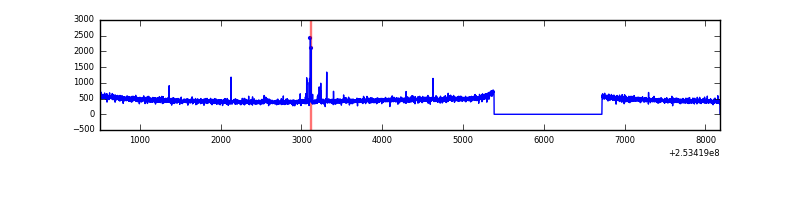 |
| D | 7674 | 6340 | 221 | 221 | 2.88% | 3.49% | 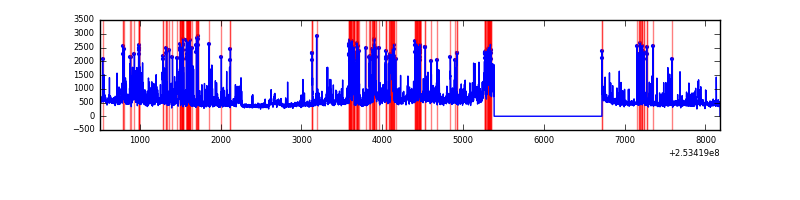 |
Top three noisy pixels from each quadrant. If the there are fewer than three noisy pixels in the level2.evt file, extra rows are filled as -1
| Pixel properties | Quadrant properties | ||||||
|---|---|---|---|---|---|---|---|
| Quadrant | DetID | PixID | Counts | Sigma | Mean | Median | Sigma |
| A | 13 | 251 | 320522 | 2116.06 | 754 | 741 | 151.1 |
| A | 1 | 162 | 255516 | 1685.9 | 754 | 741 | 151.1 |
| A | 1 | 178 | 135196 | 889.72 | 754 | 741 | 151.1 |
| B | 2 | 32 | 2858861 | 22555.19 | 687 | 672 | 126.7 |
| B | 2 | 48 | 1803747 | 14228.83 | 687 | 672 | 126.7 |
| B | 4 | 239 | 388993 | 3064.41 | 687 | 672 | 126.7 |
| C | 14 | 234 | 26588 | 155.86 | 725 | 730 | 165.9 |
| C | 13 | 61 | 5409 | 28.2 | 725 | 730 | 165.9 |
| C | 6 | 96 | 3776 | 18.36 | 725 | 730 | 165.9 |
| D | 1 | 52 | 1215884 | 7353.97 | 701 | 682 | 165.2 |
| D | 10 | 199 | 145365 | 875.57 | 701 | 682 | 165.2 |
| D | 13 | 104 | 97952 | 588.64 | 701 | 682 | 165.2 |
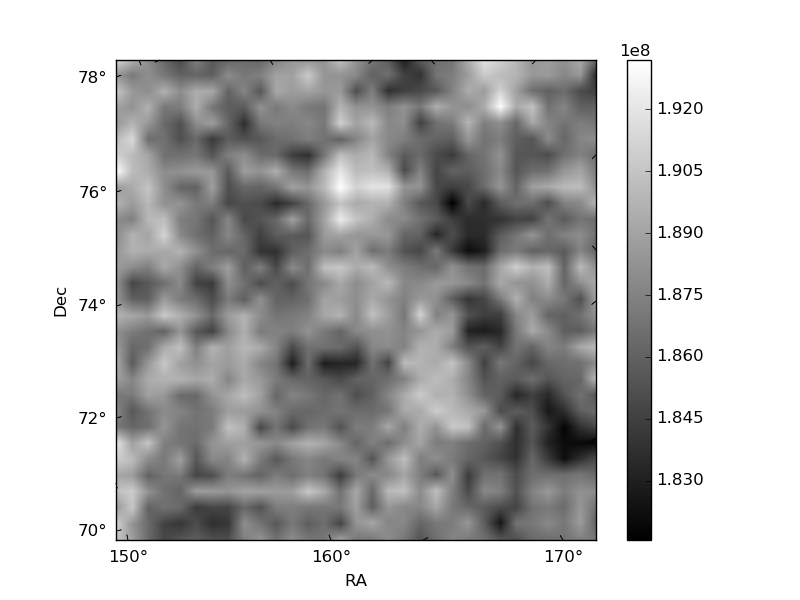
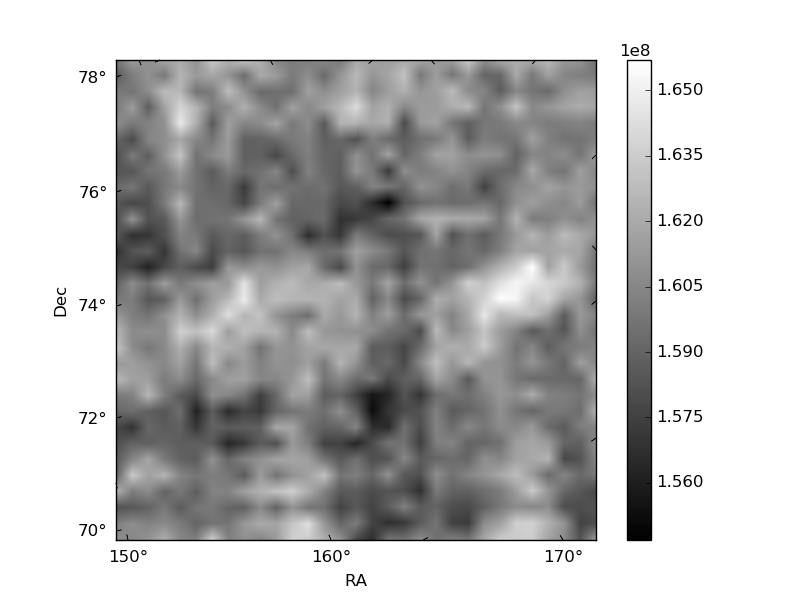
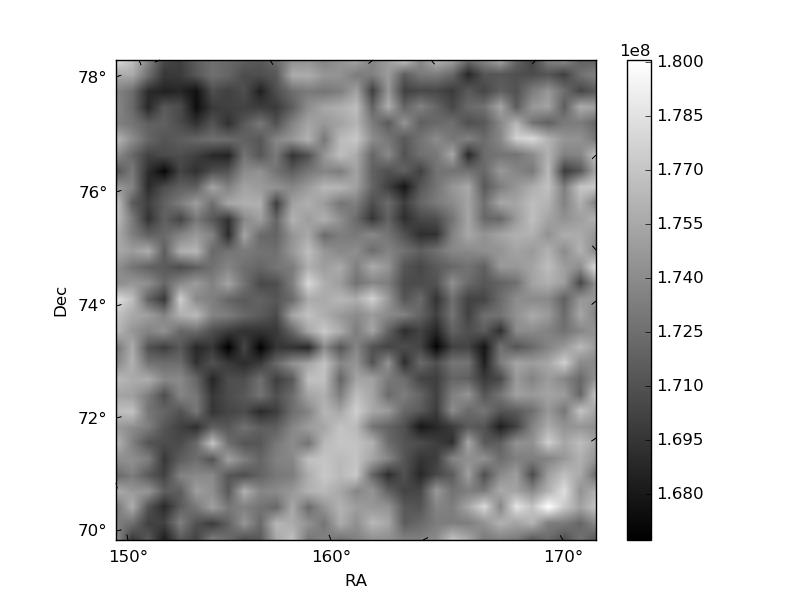
Histogram calculated using DETX and DETY for each event in the final _common_clean file
| Quadrant A | 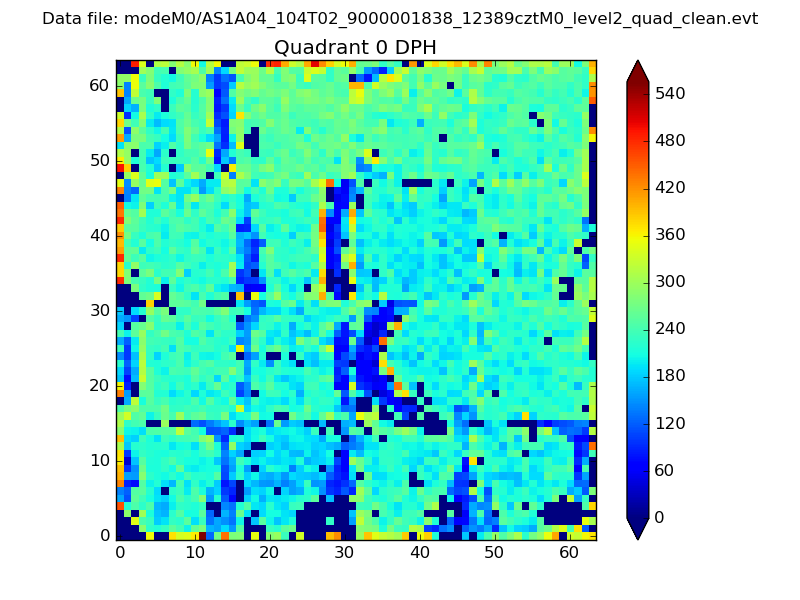 |
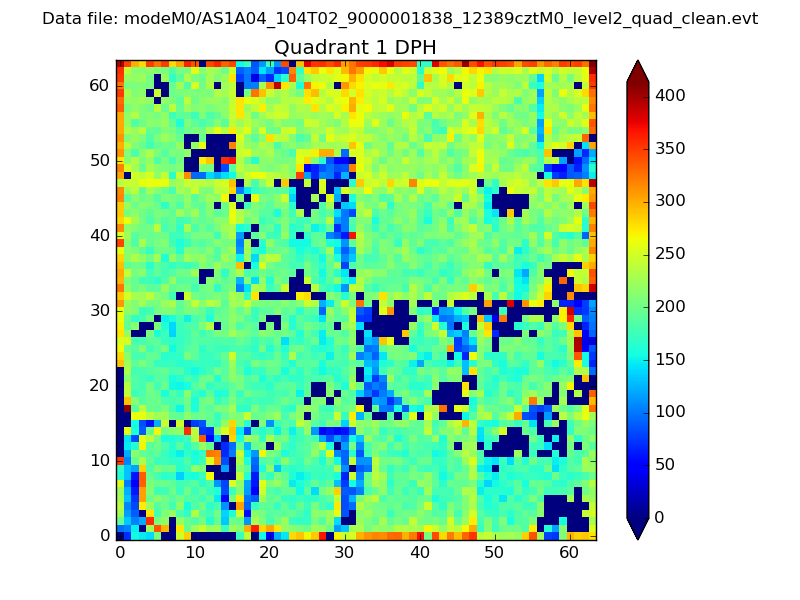 |
Quadrant B |
|---|---|---|---|
| Quadrant D |  |
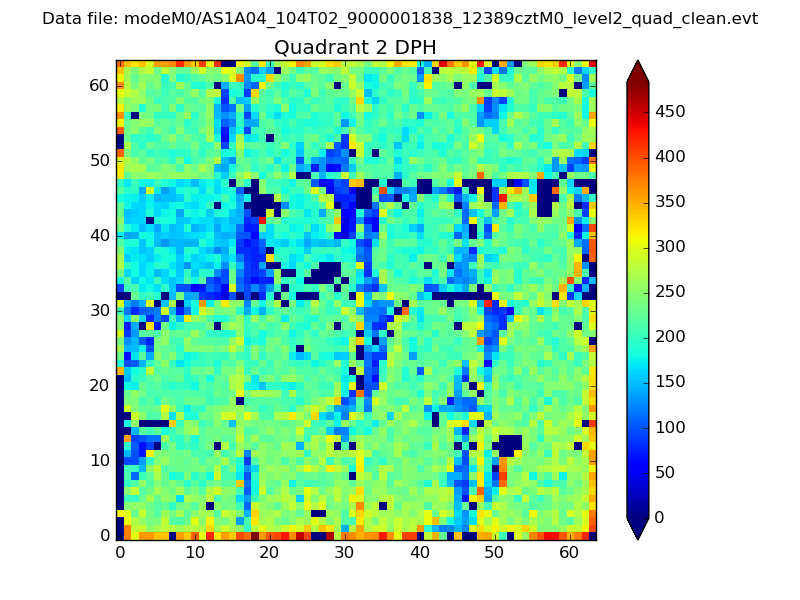 |
Quadrant C |
| Plot type | Count rate plots | Images |
|---|---|---|
| Comparison with Poisson distribution Blue bars denote a histogram of data divided into 1 sec bins. Red curve is a Poisson curve with rate = median count rate of data. |
 |
 |
| Quadrant-wise count rates Data is divided into 100 sec bins |
 |
|
| Module-wise count rates for Quadrant A Data is divided into 100 sec bins |
 |
 |
| Module-wise count rates for Quadrant B Data is divided into 100 sec bins |
 |
 |
| Module-wise count rates for Quadrant C Data is divided into 100 sec bins |
 |
 |
| Module-wise count rates for Quadrant D Data is divided into 100 sec bins |
 |
 |
| Parameter | Plot |
|---|---|
| CZT HV Monitor |  |
| D_VDD | 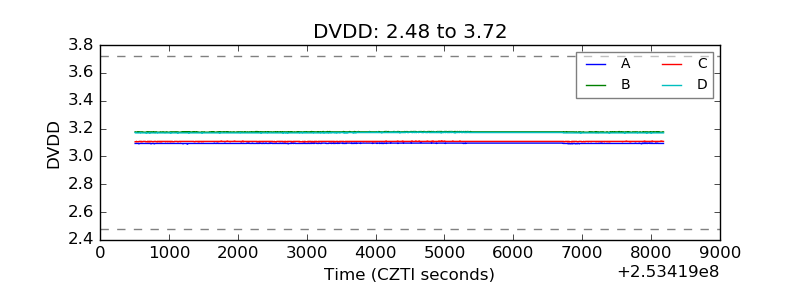 |
| Temperature 1 | 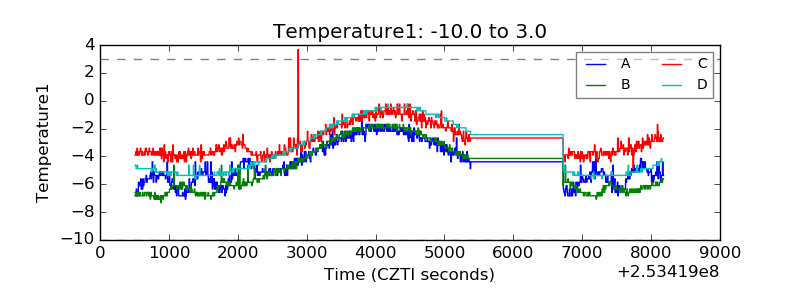 |
| Veto HV Monitor |  |
| Veto LLD | 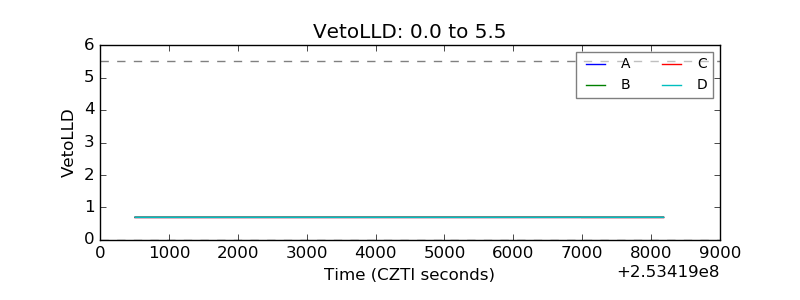 |
| Alpha Counter | 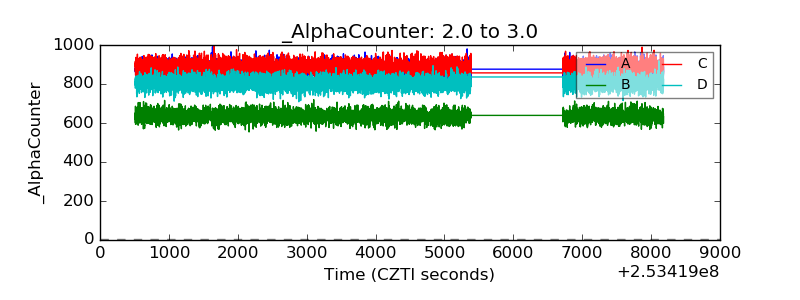 |
| _CPM_Rate | 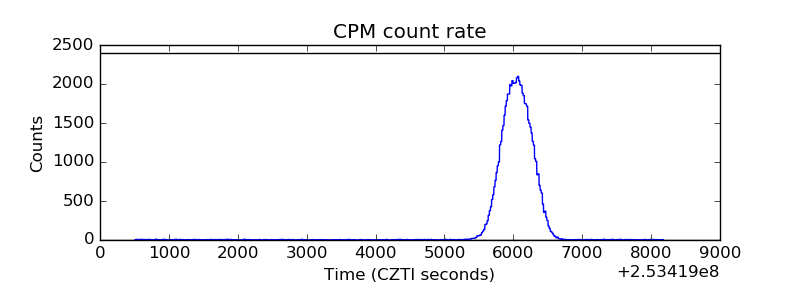 |
| CZT Counter | 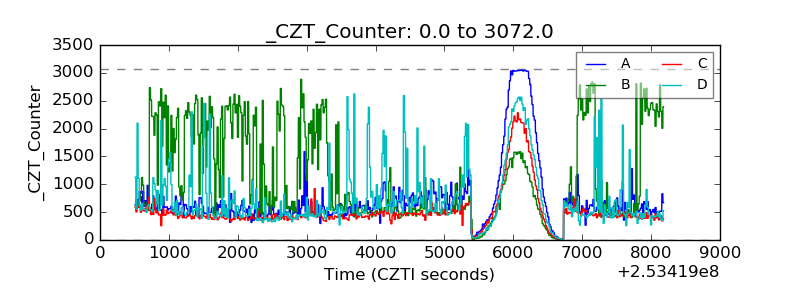 |
| +2.5 Volts monitor |  |
| +5 Volts monitor |  |
| _ROLL_ROT |  |
| _Roll_DEC |  |
| _Roll_RA |  |
| Veto Counter |  |