| Param | Original file | Final file |
|---|---|---|
| Filename | modeM0/AS1A04_104T02_9000001838_12391cztM0_level2.evt | modeM0/AS1A04_104T02_9000001838_12391cztM0_level2_quad_clean.evt |
| Size (bytes) | 1,078,885,440 | 200,782,080 |
| Size | 1.0 GB | 191.5 MB |
| Events in quadrant A | 6,673,258 | 1,409,650 |
| Events in quadrant B | 13,247,493 | 1,220,444 |
| Events in quadrant C | 4,802,964 | 1,393,277 |
| Events in quadrant D | 7,217,710 | 1,305,288 |
| Mode SS | |||
|---|---|---|---|
| Quadrant | BADHDUFLAG | Total packets | Discarded packets |
| A | 0 | 222 | 0 |
| B | 0 | 222 | 0 |
| C | 0 | 222 | 0 |
| D | 0 | 222 | 0 |
| Mode M9 | |||
|---|---|---|---|
| Quadrant | BADHDUFLAG | Total packets | Discarded packets |
| A | 0 | 24 | 0 |
| B | 0 | 24 | 0 |
| C | 0 | 24 | 0 |
| D | 0 | 24 | 0 |
| Mode M0 | |||
|---|---|---|---|
| Quadrant | BADHDUFLAG | Total packets | Discarded packets |
| A | 0 | 27146 | 3 |
| B | 0 | 46524 | 2 |
| C | 0 | 22002 | 2 |
| D | 0 | 28770 | 2 |
| Quadrant | Total seconds | Saturated seconds | Saturation percentage |
|---|---|---|---|
| A | 10848 | 245 | 2.258481% |
| B | 10848 | 3479 | 32.070428% |
| C | 10848 | 33 | 0.304204% |
| D | 10848 | 444 | 4.092920% |
Noise dominated data is calculated using 1-second bins in cleaned event files. If a bin has >2000 counts, and if more than 50% of those come from <1% of pixels, then it is considered to be noise-dominated and hence unusable.
| Quadrant | # 1 sec bins | Bins with >0 counts | Bins with >2000 counts | High rate bins dominated by noise | Noise dominated (total time) | Noise dominated (detector-on time) | Marked lightcurve |
|---|---|---|---|---|---|---|---|
| A | 13304 | 10849 | 31 | 31 | 0.23% | 0.29% | 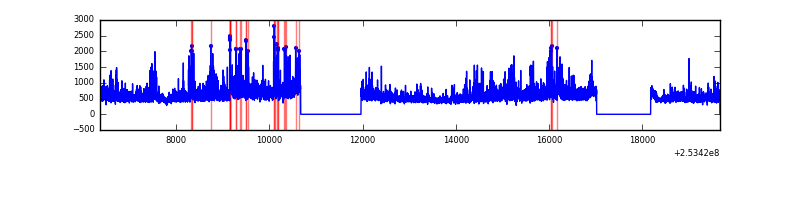 |
| B | 13304 | 10849 | 3091 | 3091 | 23.23% | 28.49% | 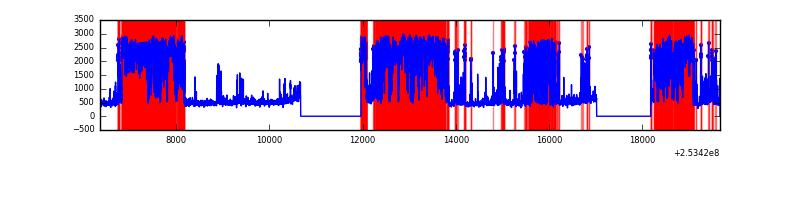 |
| C | 13304 | 10850 | 1 | 1 | 0.01% | 0.01% | 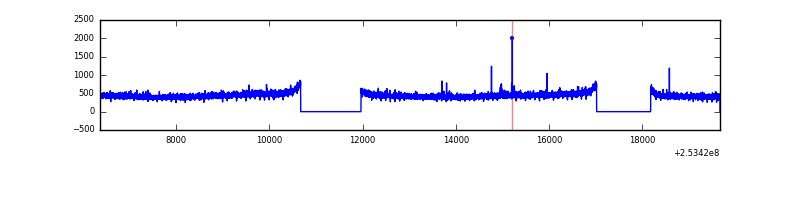 |
| D | 13304 | 10849 | 358 | 358 | 2.69% | 3.30% |  |
Top three noisy pixels from each quadrant. If the there are fewer than three noisy pixels in the level2.evt file, extra rows are filled as -1
| Pixel properties | Quadrant properties | ||||||
|---|---|---|---|---|---|---|---|
| Quadrant | DetID | PixID | Counts | Sigma | Mean | Median | Sigma |
| A | 13 | 251 | 615769 | 2397.38 | 1277 | 1253 | 256.3 |
| A | 1 | 162 | 385249 | 1498.06 | 1277 | 1253 | 256.3 |
| A | 1 | 178 | 202232 | 784.07 | 1277 | 1253 | 256.3 |
| B | 2 | 32 | 5183438 | 25046.94 | 1122 | 1095 | 206.9 |
| B | 2 | 48 | 2080205 | 10048.61 | 1122 | 1095 | 206.9 |
| B | 4 | 239 | 1330260 | 6424.03 | 1122 | 1095 | 206.9 |
| C | 6 | 96 | 16471 | 55.05 | 1223 | 1227 | 276.9 |
| C | 3 | 233 | 10343 | 32.92 | 1223 | 1227 | 276.9 |
| C | 13 | 61 | 9176 | 28.71 | 1223 | 1227 | 276.9 |
| D | 1 | 52 | 2015644 | 7098.03 | 1205 | 1171 | 283.8 |
| D | 10 | 199 | 233777 | 819.59 | 1205 | 1171 | 283.8 |
| D | 2 | 14 | 124404 | 434.21 | 1205 | 1171 | 283.8 |
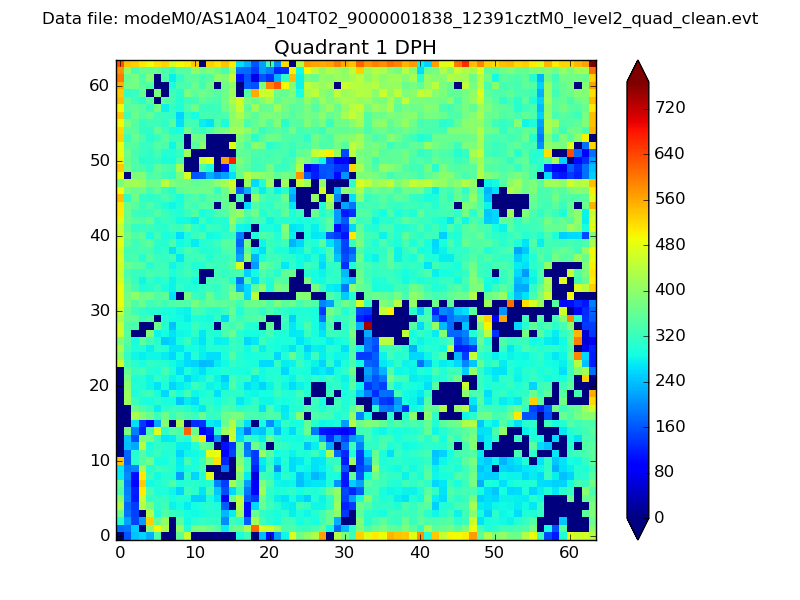
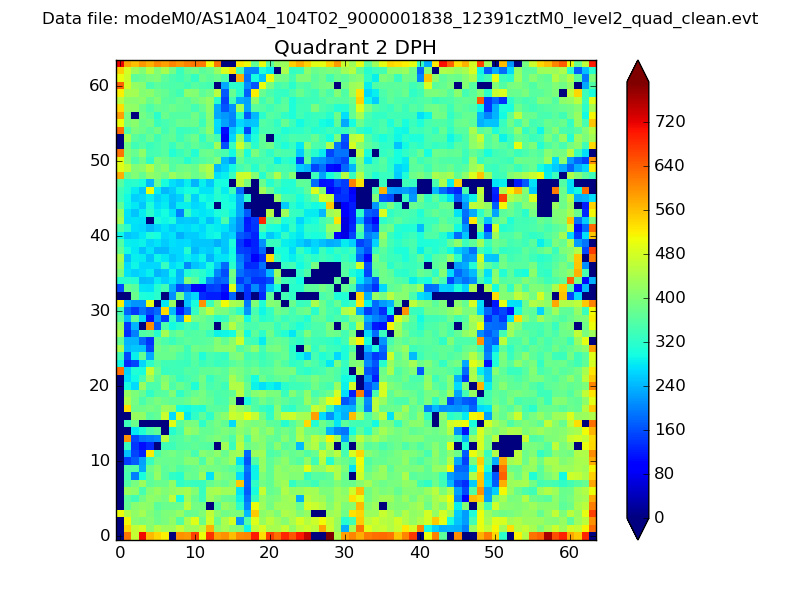
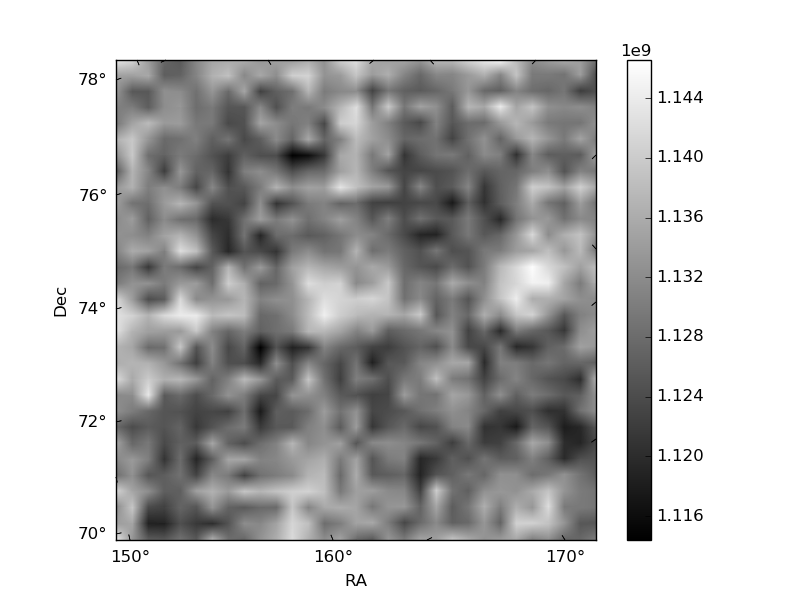
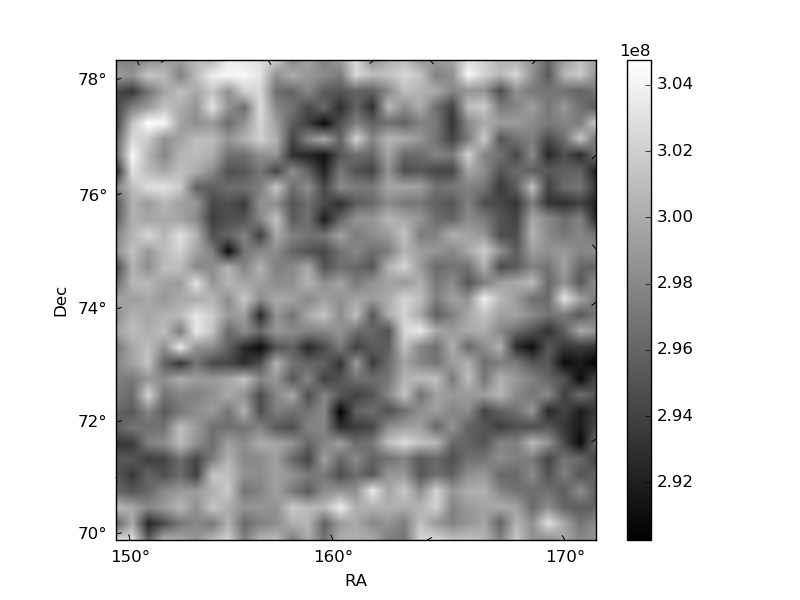
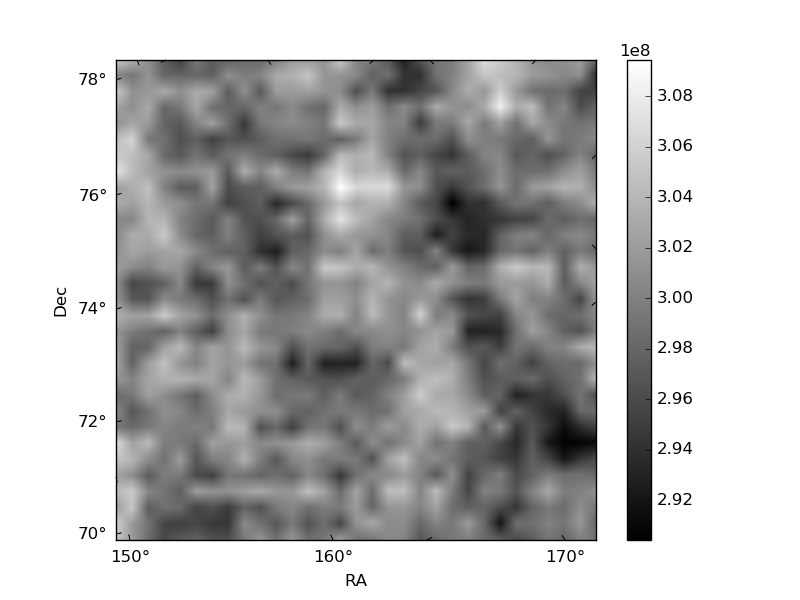
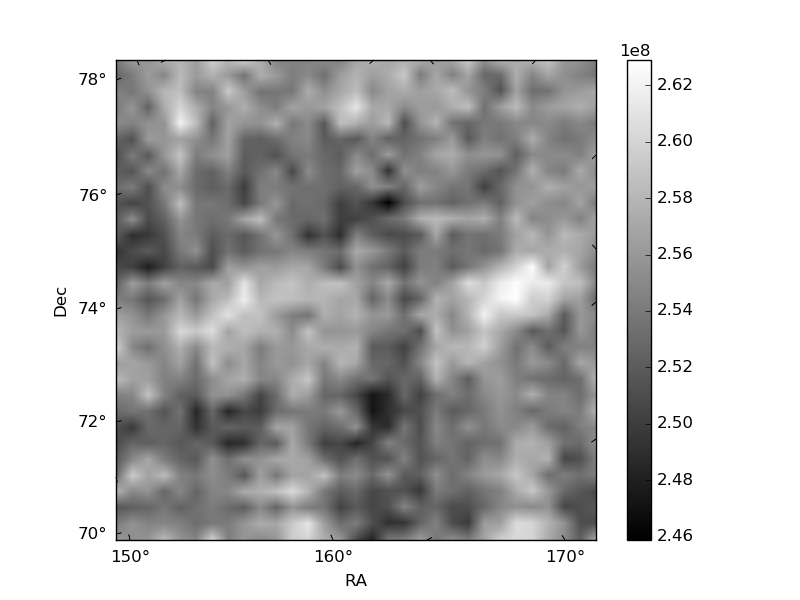
Histogram calculated using DETX and DETY for each event in the final _common_clean file
| Quadrant A | 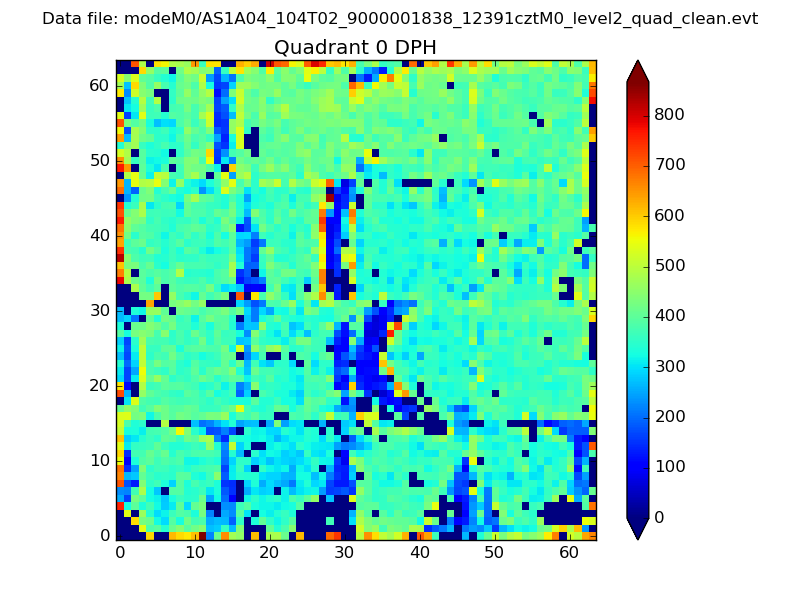 |
 |
Quadrant B |
|---|---|---|---|
| Quadrant D | 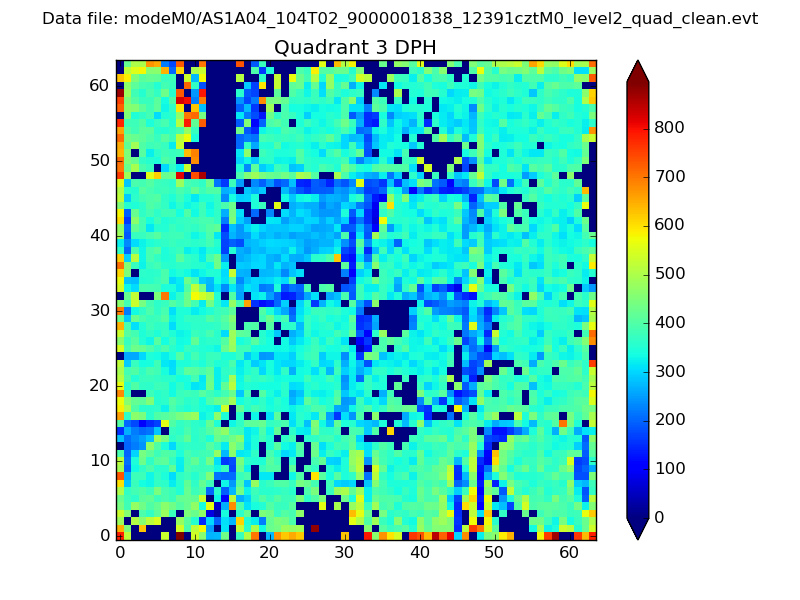 |
 |
Quadrant C |
| Plot type | Count rate plots | Images |
|---|---|---|
| Comparison with Poisson distribution Blue bars denote a histogram of data divided into 1 sec bins. Red curve is a Poisson curve with rate = median count rate of data. |
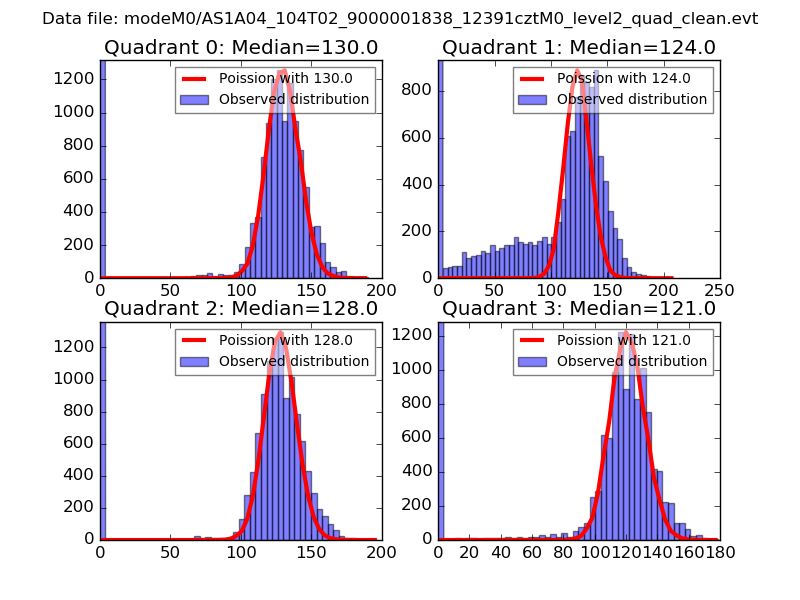 |
 |
| Quadrant-wise count rates Data is divided into 100 sec bins |
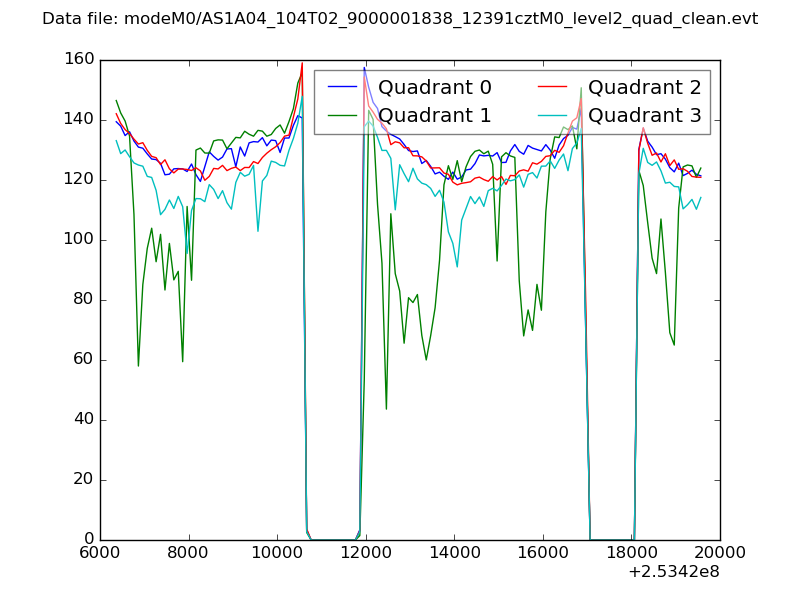 |
|
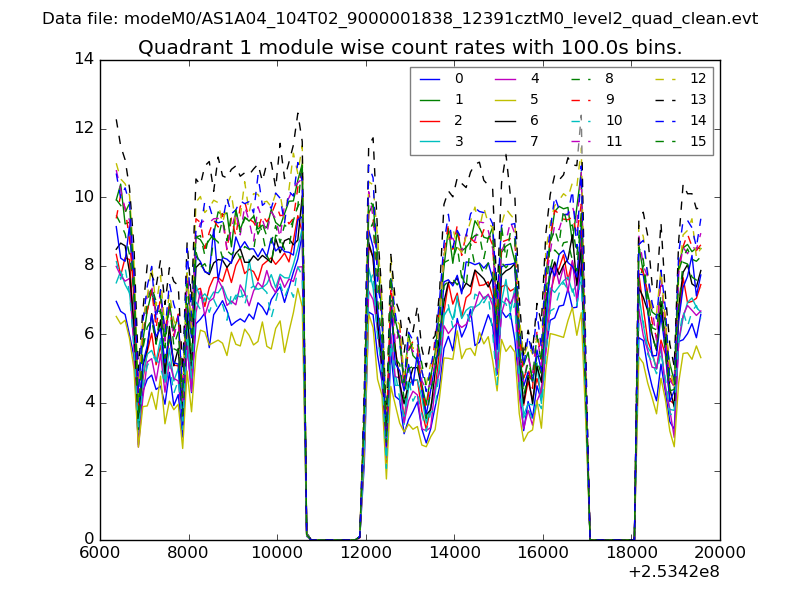
| Module-wise count rates for Quadrant A Data is divided into 100 sec bins |
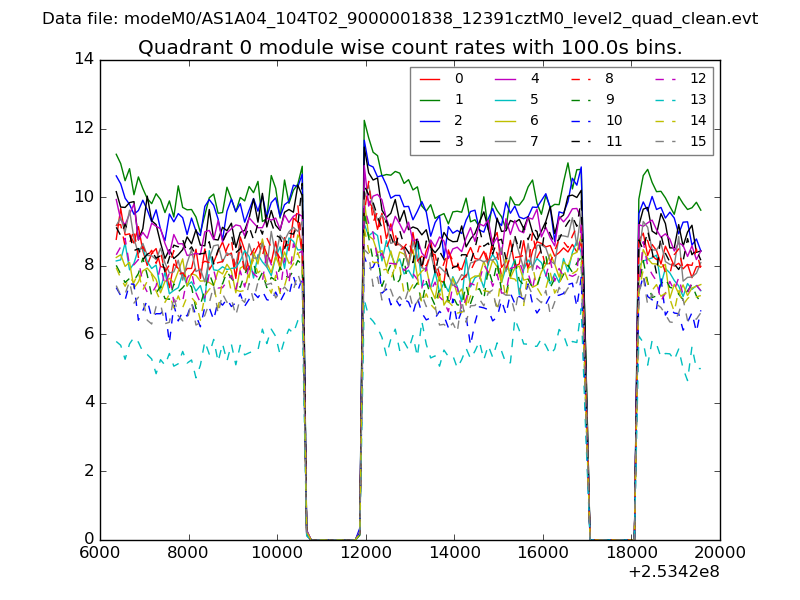 |
 |
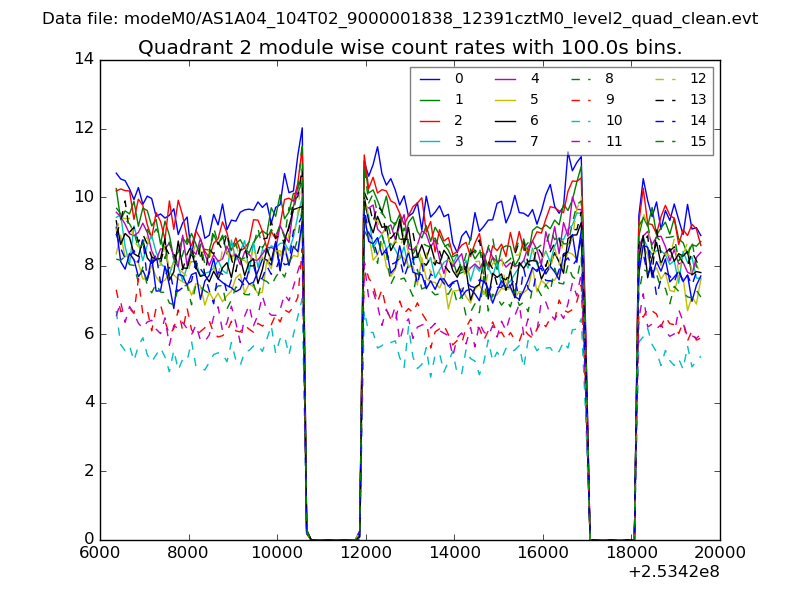
| Module-wise count rates for Quadrant B Data is divided into 100 sec bins |
 |
 |
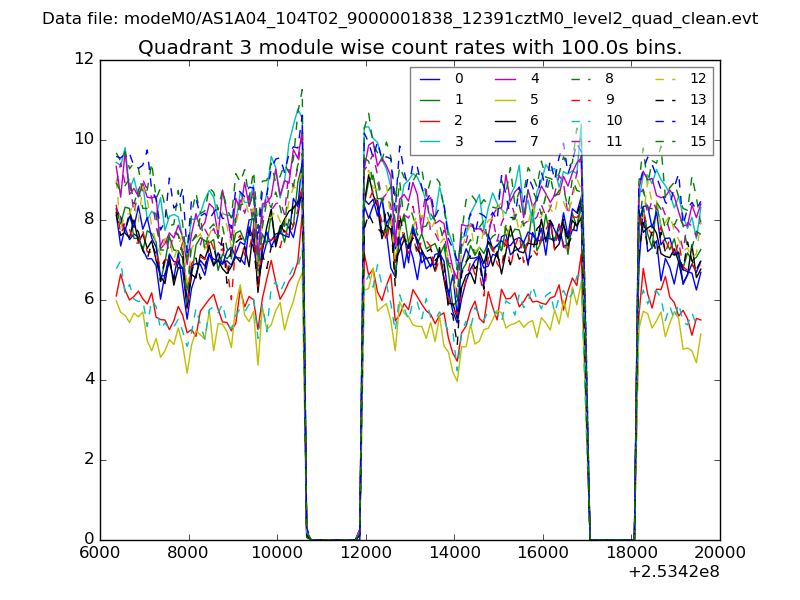
| Module-wise count rates for Quadrant C Data is divided into 100 sec bins |
 |
 |
| Module-wise count rates for Quadrant D Data is divided into 100 sec bins |
 |
 |
| Parameter | Plot |
|---|---|
| CZT HV Monitor | 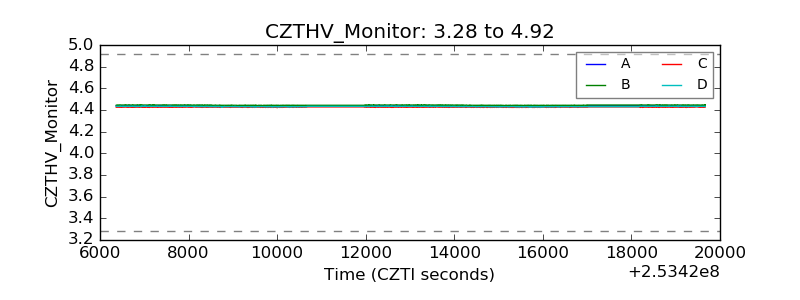 |
| D_VDD | 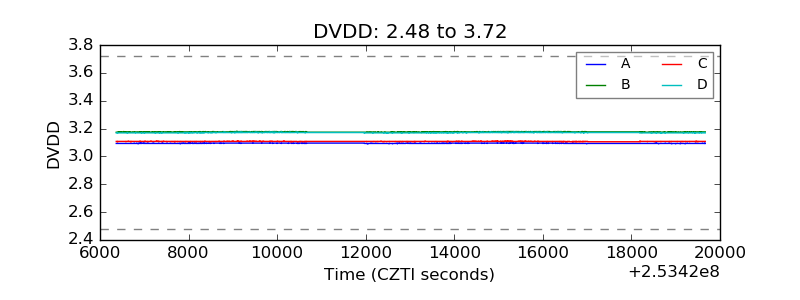 |
| Temperature 1 |  |
| Veto HV Monitor | 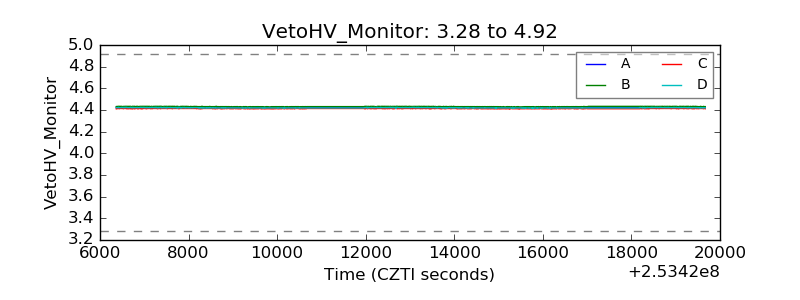 |
| Veto LLD |  |
| Alpha Counter | 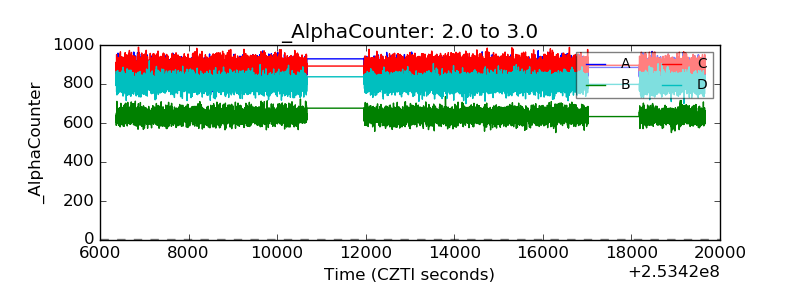 |
| _CPM_Rate | 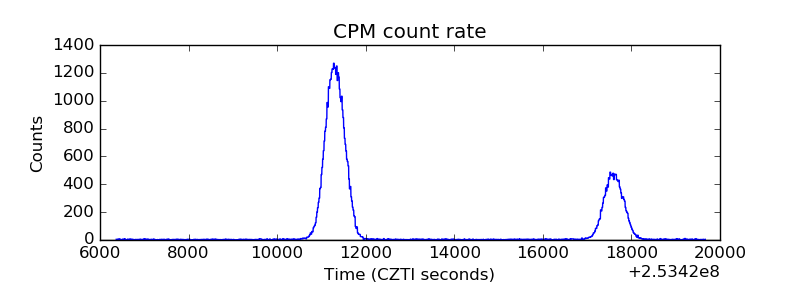 |
| CZT Counter | 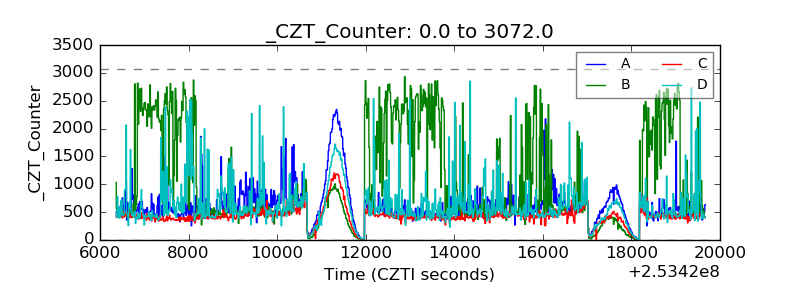 |
| +2.5 Volts monitor | 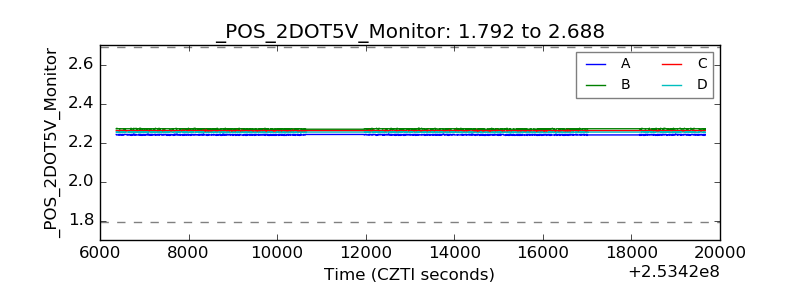 |
| +5 Volts monitor |  |
| _ROLL_ROT | 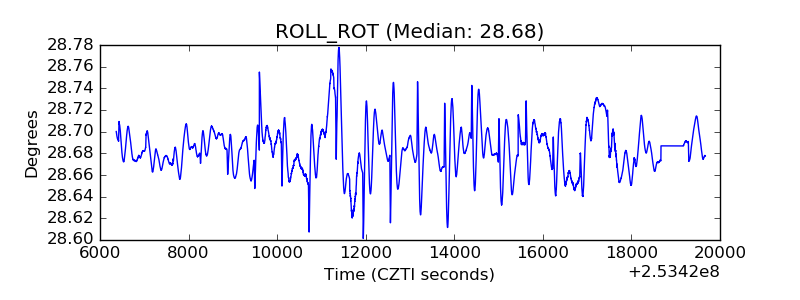 |
| _Roll_DEC | 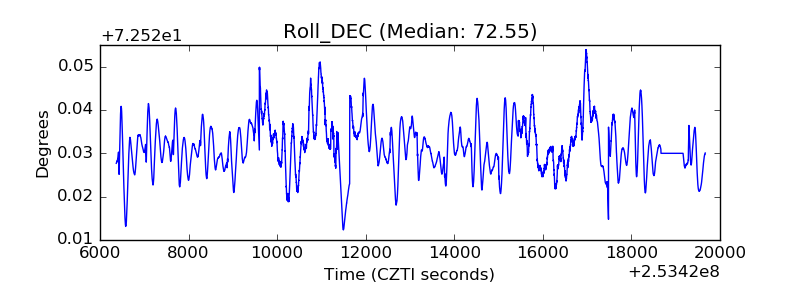 |
| _Roll_RA | 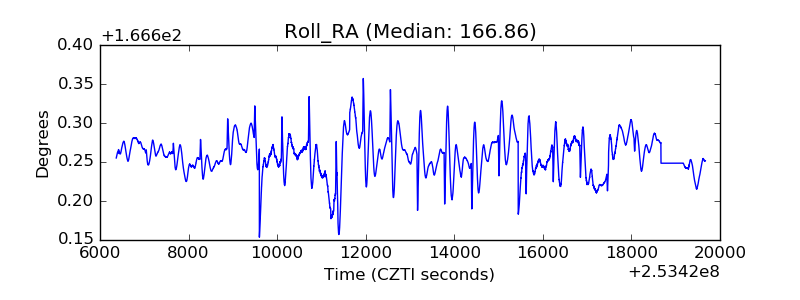 |
| Veto Counter | 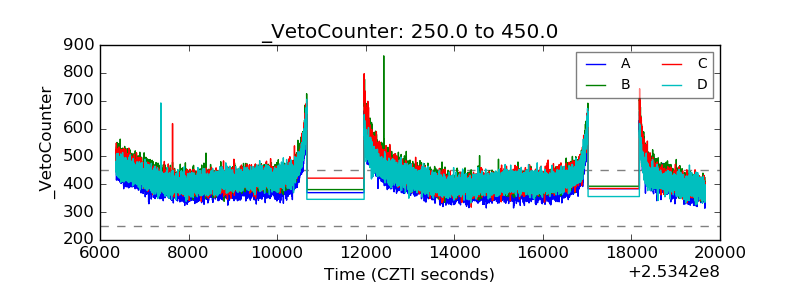 |