| Param | Original file | Final file |
|---|---|---|
| Filename | modeM0/AS1A04_104T02_9000001838_12392cztM0_level2.evt | modeM0/AS1A04_104T02_9000001838_12392cztM0_level2_quad_clean.evt |
| Size (bytes) | 550,327,680 | 113,169,600 |
| Size | 524.8 MB | 107.9 MB |
| Events in quadrant A | 3,737,111 | 772,772 |
| Events in quadrant B | 5,425,391 | 737,833 |
| Events in quadrant C | 2,690,667 | 765,081 |
| Events in quadrant D | 4,389,160 | 714,646 |
| Mode SS | |||
|---|---|---|---|
| Quadrant | BADHDUFLAG | Total packets | Discarded packets |
| A | 0 | 126 | 0 |
| B | 0 | 126 | 0 |
| C | 0 | 126 | 0 |
| D | 0 | 126 | 0 |
| Mode M9 | |||
|---|---|---|---|
| Quadrant | BADHDUFLAG | Total packets | Discarded packets |
| A | 0 | 10 | 0 |
| B | 0 | 10 | 0 |
| C | 0 | 10 | 0 |
| D | 0 | 10 | 0 |
| Mode M0 | |||
|---|---|---|---|
| Quadrant | BADHDUFLAG | Total packets | Discarded packets |
| A | 0 | 15230 | 2 |
| B | 0 | 20247 | 1 |
| C | 0 | 12639 | 1 |
| D | 0 | 17372 | 1 |
| Quadrant | Total seconds | Saturated seconds | Saturation percentage |
|---|---|---|---|
| A | 6262 | 169 | 2.698818% |
| B | 6262 | 905 | 14.452252% |
| C | 6262 | 12 | 0.191632% |
| D | 6262 | 273 | 4.359630% |
Noise dominated data is calculated using 1-second bins in cleaned event files. If a bin has >2000 counts, and if more than 50% of those come from <1% of pixels, then it is considered to be noise-dominated and hence unusable.
| Quadrant | # 1 sec bins | Bins with >0 counts | Bins with >2000 counts | High rate bins dominated by noise | Noise dominated (total time) | Noise dominated (detector-on time) | Marked lightcurve |
|---|---|---|---|---|---|---|---|
| A | 7178 | 6263 | 66 | 66 | 0.92% | 1.05% | 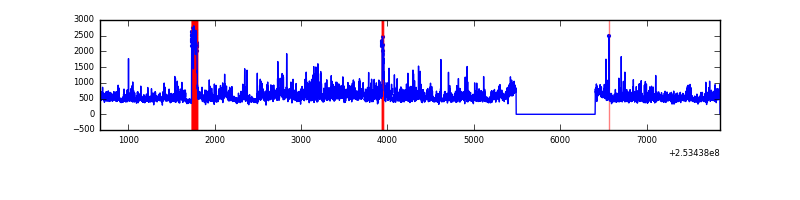 |
| B | 7178 | 6263 | 768 | 768 | 10.70% | 12.26% |  |
| C | 7178 | 6263 | 0 | 0 | 0.00% | 0.00% | 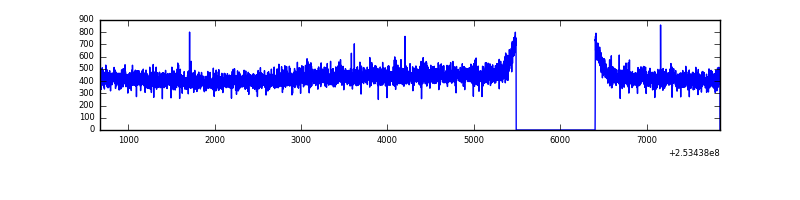 |
| D | 7178 | 6264 | 201 | 201 | 2.80% | 3.21% | 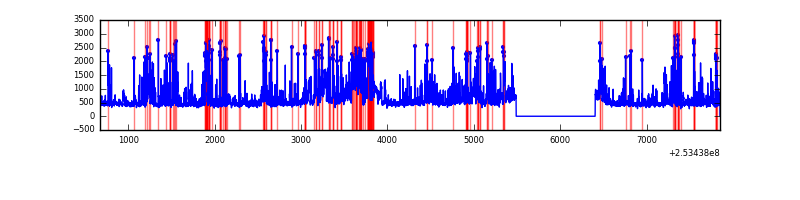 |
Top three noisy pixels from each quadrant. If the there are fewer than three noisy pixels in the level2.evt file, extra rows are filled as -1
| Pixel properties | Quadrant properties | ||||||
|---|---|---|---|---|---|---|---|
| Quadrant | DetID | PixID | Counts | Sigma | Mean | Median | Sigma |
| A | 1 | 162 | 249564 | 1696.14 | 715 | 702 | 146.7 |
| A | 14 | 237 | 222607 | 1512.41 | 715 | 702 | 146.7 |
| A | 13 | 251 | 136465 | 925.31 | 715 | 702 | 146.7 |
| B | 2 | 32 | 1165265 | 9076.34 | 681 | 665 | 128.3 |
| B | 4 | 239 | 1130952 | 8808.92 | 681 | 665 | 128.3 |
| B | 2 | 48 | 340414 | 2647.84 | 681 | 665 | 128.3 |
| C | 13 | 61 | 5192 | 28.43 | 688 | 691 | 158.3 |
| C | 5 | 252 | 3842 | 19.91 | 688 | 691 | 158.3 |
| C | 6 | 96 | 2761 | 13.08 | 688 | 691 | 158.3 |
| D | 1 | 52 | 1170550 | 7272.35 | 677 | 657 | 160.9 |
| D | 7 | 71 | 204837 | 1269.24 | 677 | 657 | 160.9 |
| D | 10 | 199 | 144841 | 896.28 | 677 | 657 | 160.9 |
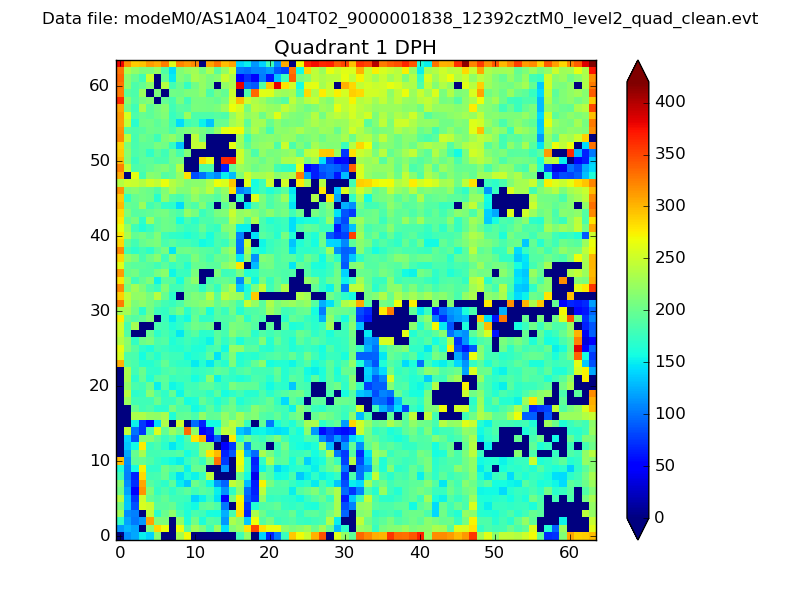
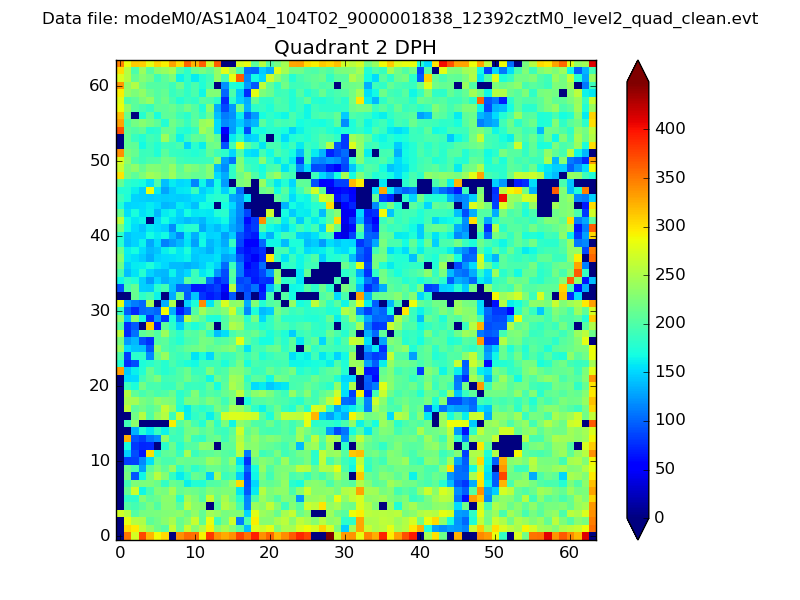
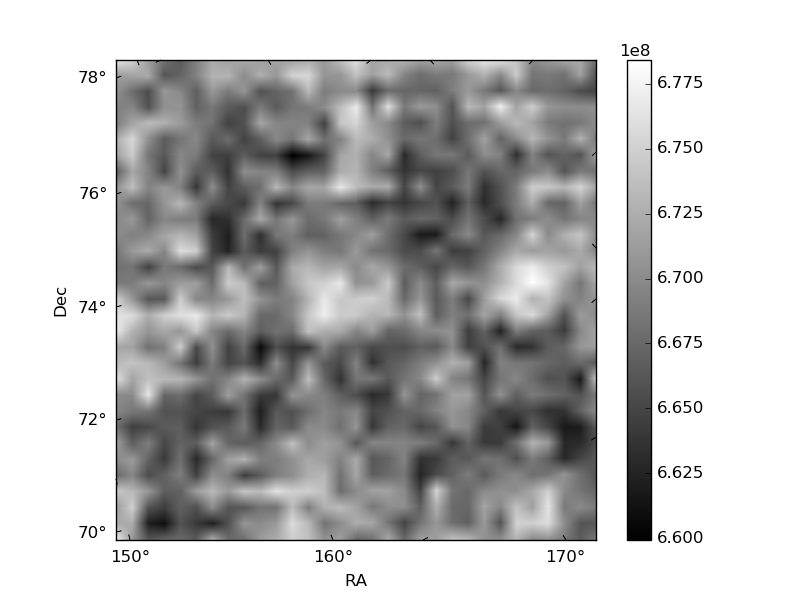
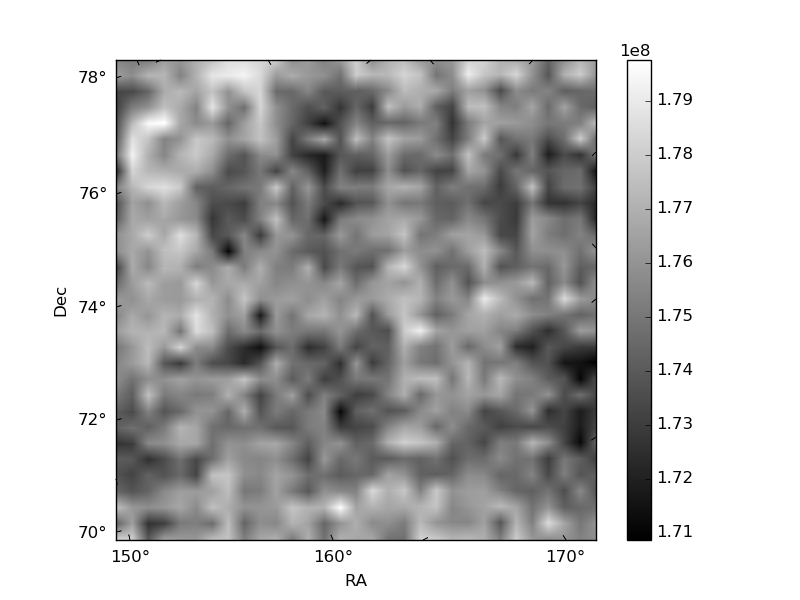
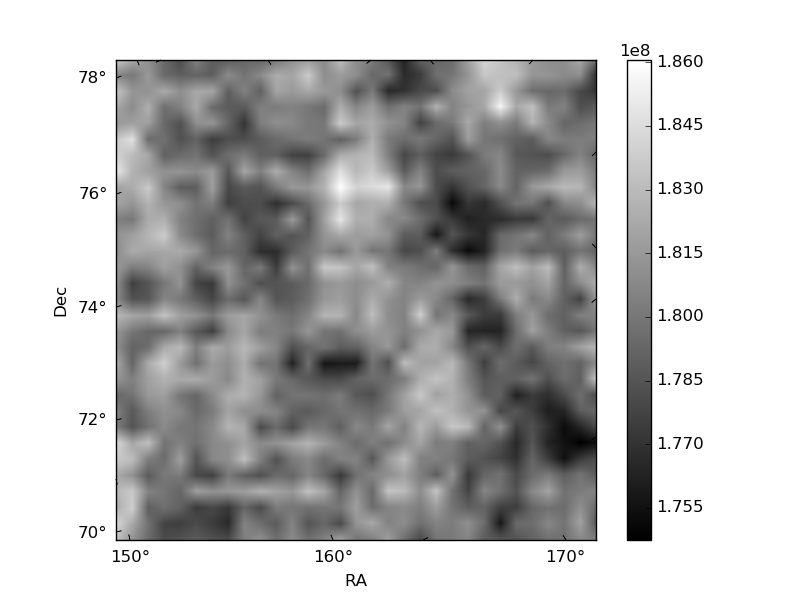
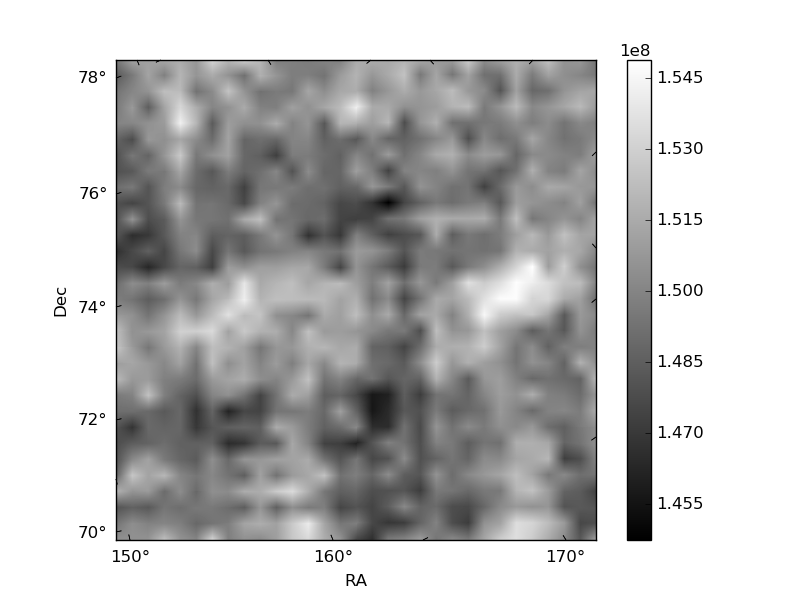
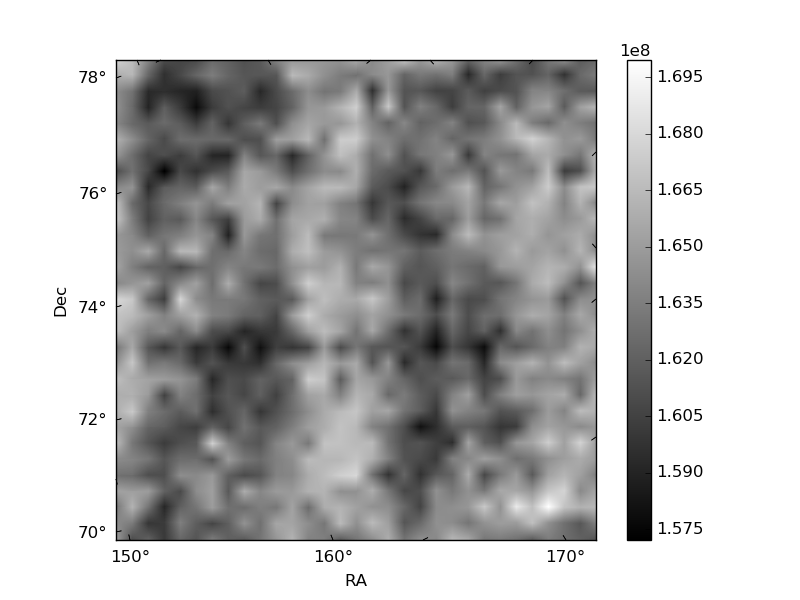
Histogram calculated using DETX and DETY for each event in the final _common_clean file
| Quadrant A | 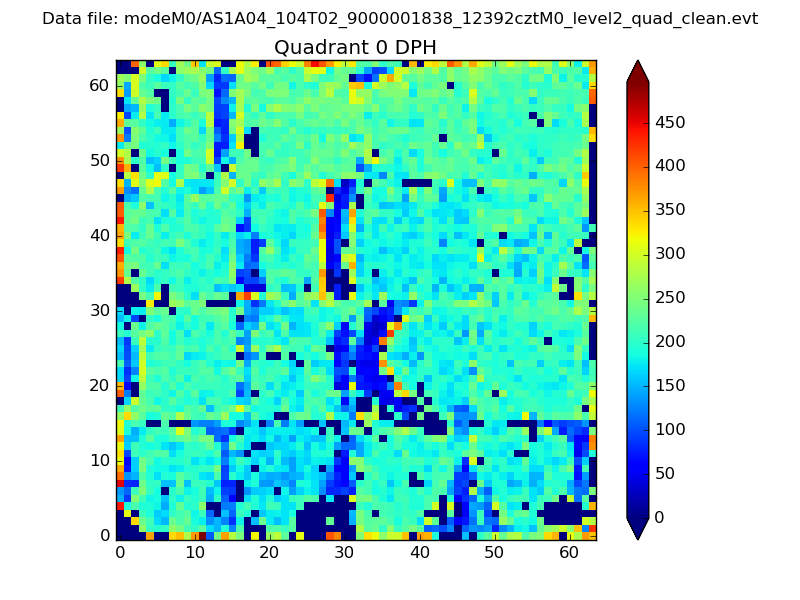 |
 |
Quadrant B |
|---|---|---|---|
| Quadrant D | 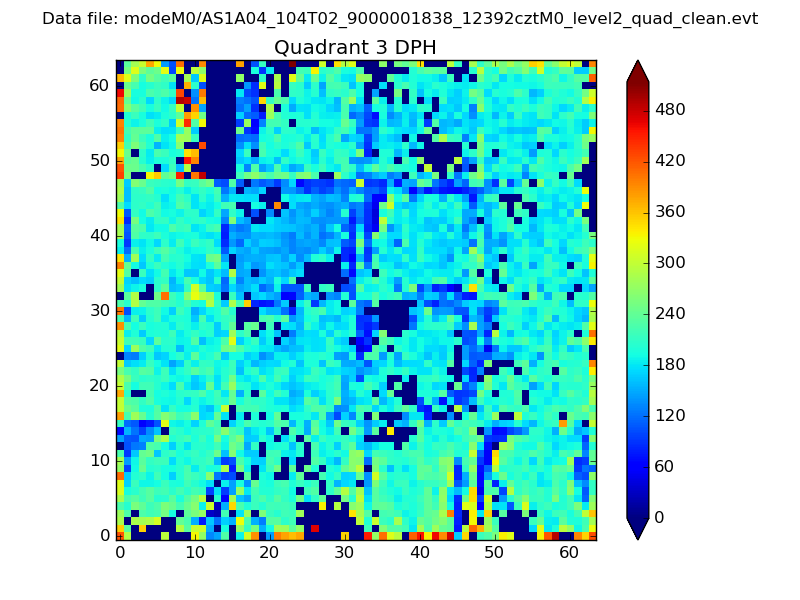 |
 |
Quadrant C |
| Plot type | Count rate plots | Images |
|---|---|---|
| Comparison with Poisson distribution Blue bars denote a histogram of data divided into 1 sec bins. Red curve is a Poisson curve with rate = median count rate of data. |
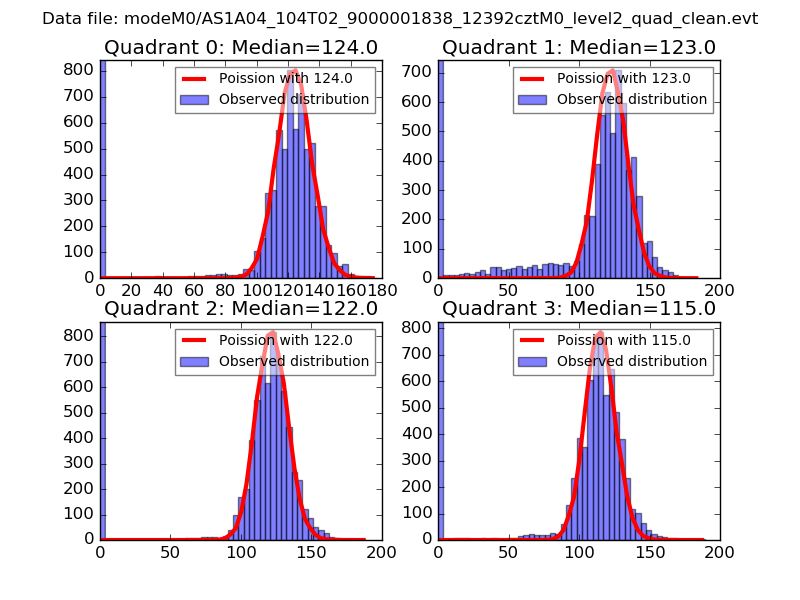 |
 |
| Quadrant-wise count rates Data is divided into 100 sec bins |
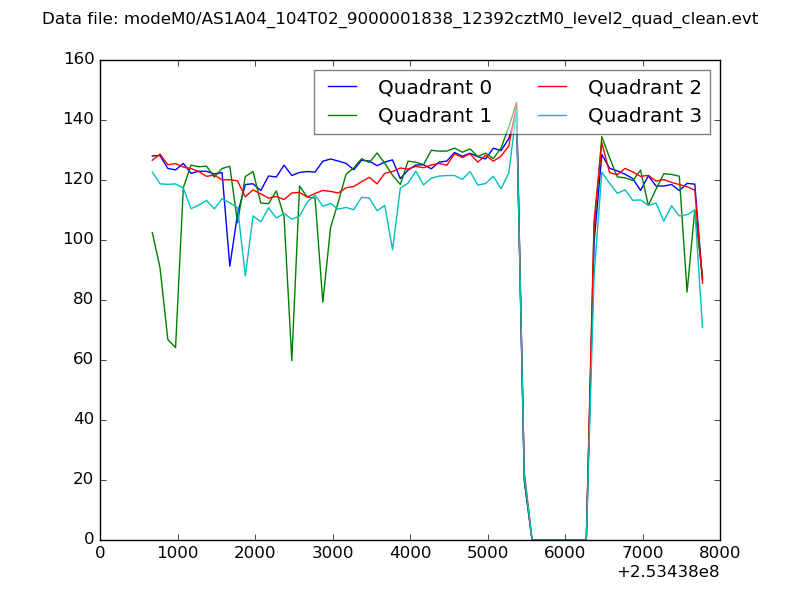 |
|
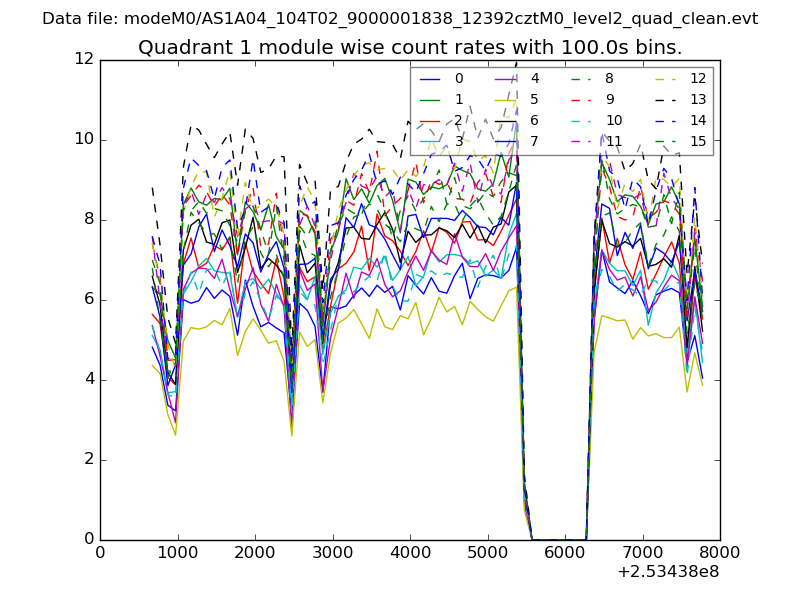
| Module-wise count rates for Quadrant A Data is divided into 100 sec bins |
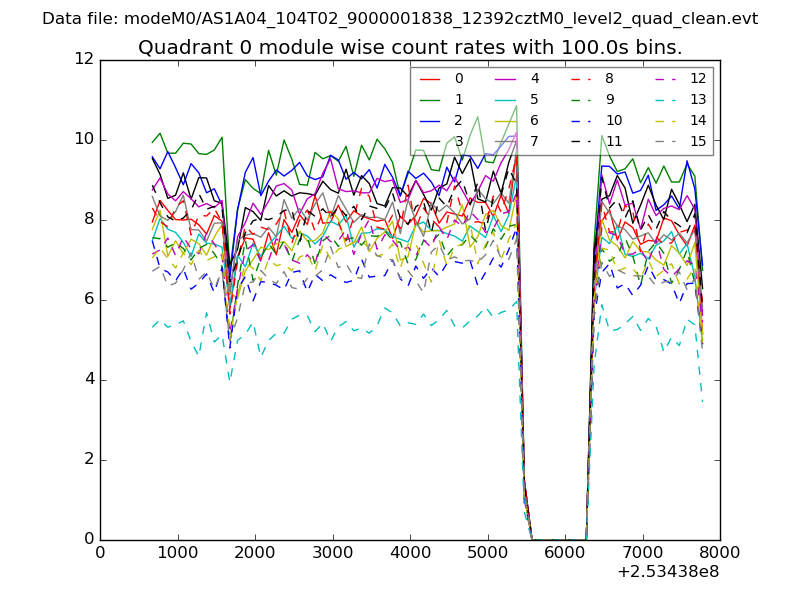 |
 |
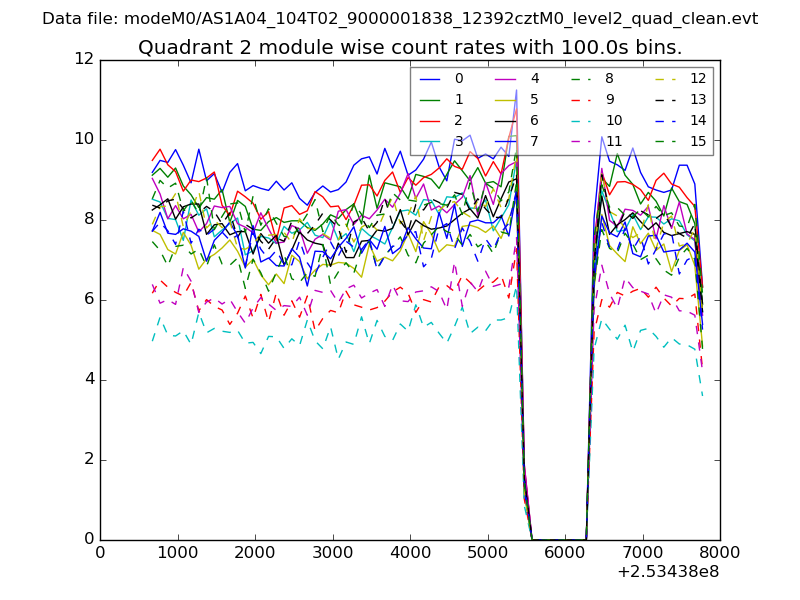
| Module-wise count rates for Quadrant B Data is divided into 100 sec bins |
 |
 |
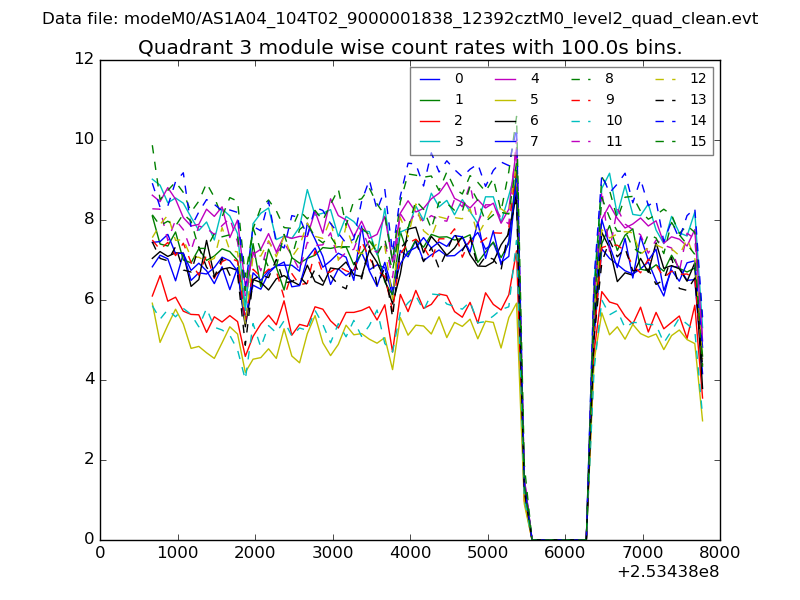
| Module-wise count rates for Quadrant C Data is divided into 100 sec bins |
 |
 |
| Module-wise count rates for Quadrant D Data is divided into 100 sec bins |
 |
 |
| Parameter | Plot |
|---|---|
| CZT HV Monitor | 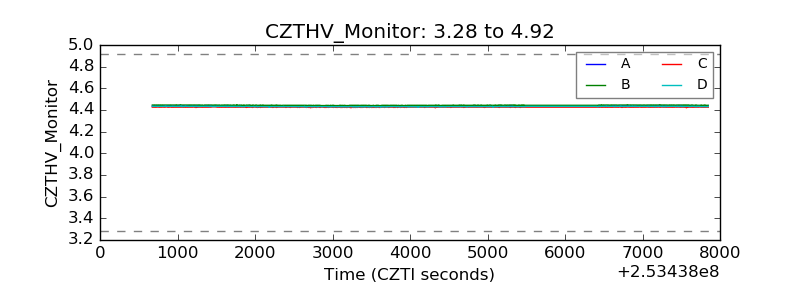 |
| D_VDD | 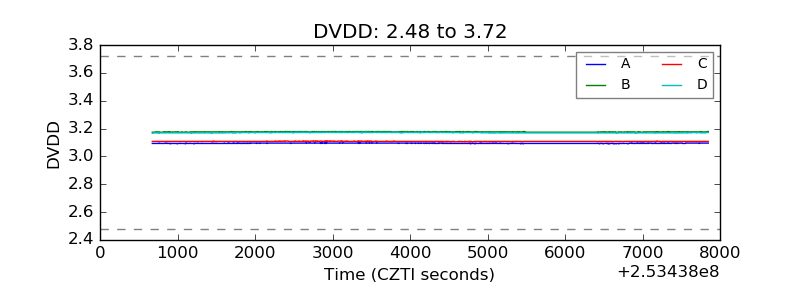 |
| Temperature 1 | 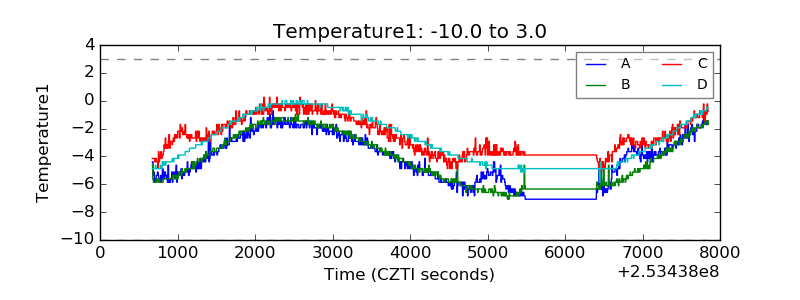 |
| Veto HV Monitor | 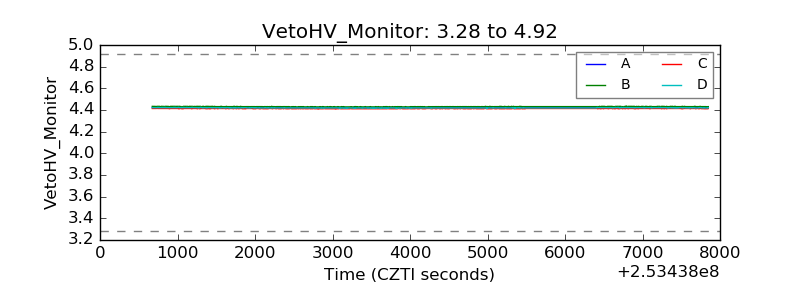 |
| Veto LLD | 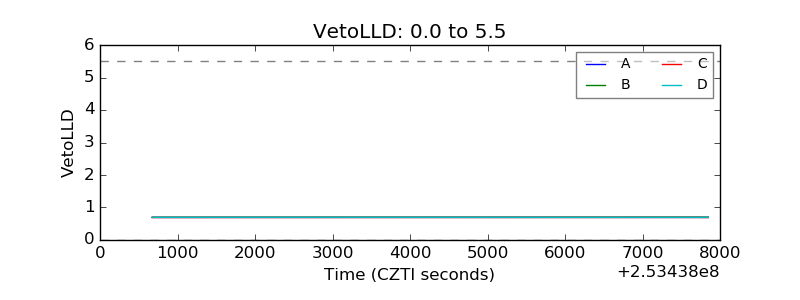 |
| Alpha Counter | 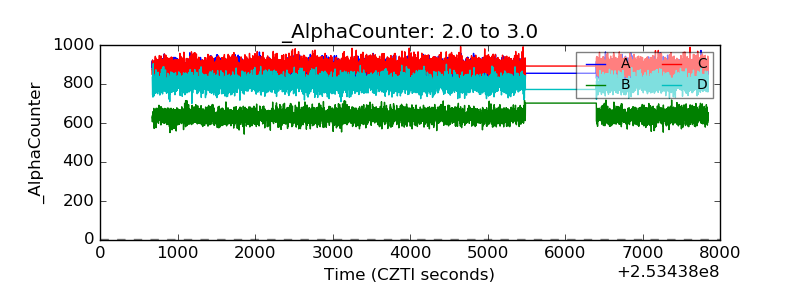 |
| _CPM_Rate | 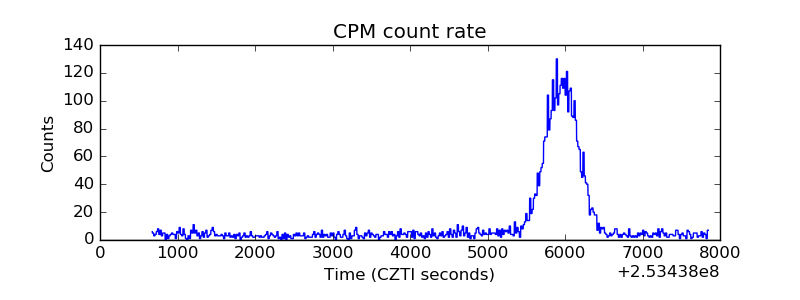 |
| CZT Counter | 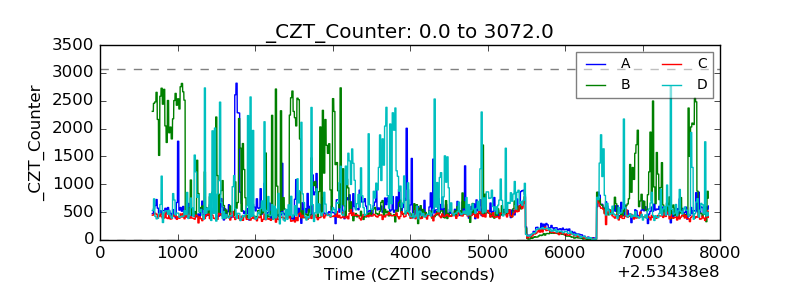 |
| +2.5 Volts monitor |  |
| +5 Volts monitor | 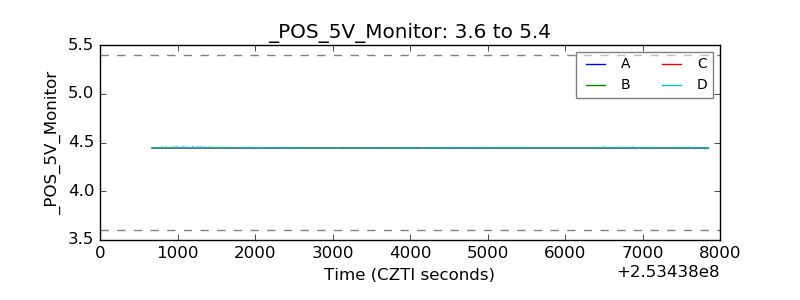 |
| _ROLL_ROT | 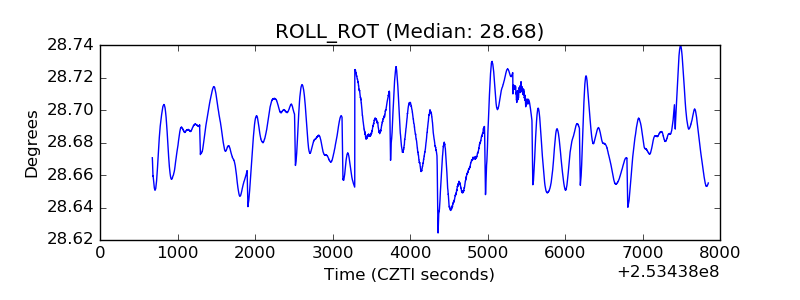 |
| _Roll_DEC | 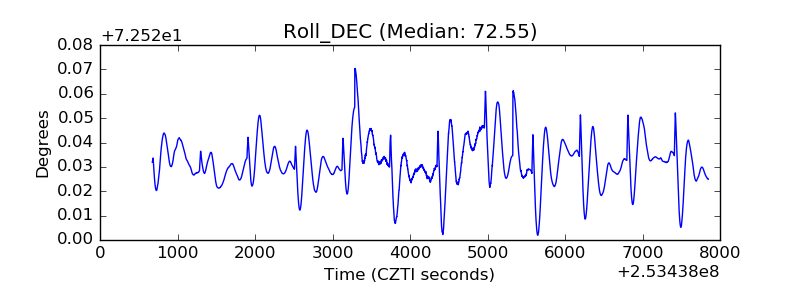 |
| _Roll_RA | 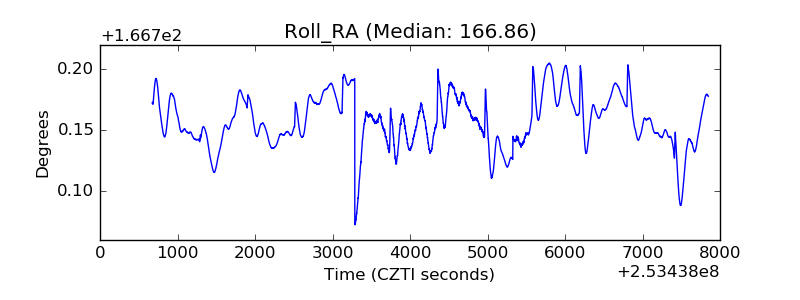 |
| Veto Counter | 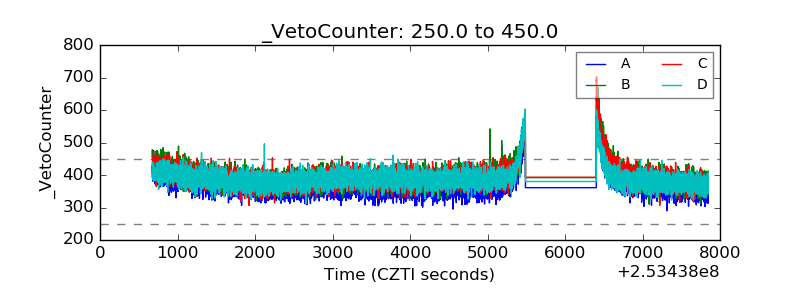 |