| Param | Original file | Final file |
|---|---|---|
| Filename | modeM0/AS1A04_104T02_9000001838_12395cztM0_level2.evt | modeM0/AS1A04_104T02_9000001838_12395cztM0_level2_quad_clean.evt |
| Size (bytes) | 653,100,480 | 122,330,880 |
| Size | 622.8 MB | 116.7 MB |
| Events in quadrant A | 5,524,079 | 814,423 |
| Events in quadrant B | 4,218,224 | 832,150 |
| Events in quadrant C | 3,038,520 | 823,431 |
| Events in quadrant D | 6,524,463 | 746,558 |
| Mode SS | |||
|---|---|---|---|
| Quadrant | BADHDUFLAG | Total packets | Discarded packets |
| A | 0 | 142 | 0 |
| B | 0 | 142 | 0 |
| C | 0 | 142 | 0 |
| D | 0 | 142 | 0 |
| Mode M9 | |||
|---|---|---|---|
| Quadrant | BADHDUFLAG | Total packets | Discarded packets |
| A | 0 | 3 | 0 |
| B | 0 | 3 | 0 |
| C | 0 | 3 | 0 |
| D | 0 | 3 | 0 |
| Mode M0 | |||
|---|---|---|---|
| Quadrant | BADHDUFLAG | Total packets | Discarded packets |
| A | 0 | 21262 | 2 |
| B | 0 | 17091 | 1 |
| C | 0 | 14146 | 1 |
| D | 0 | 24205 | 1 |
| Quadrant | Total seconds | Saturated seconds | Saturation percentage |
|---|---|---|---|
| A | 7003 | 506 | 7.225475% |
| B | 7003 | 387 | 5.526203% |
| C | 7003 | 49 | 0.699700% |
| D | 7003 | 819 | 11.694988% |
Noise dominated data is calculated using 1-second bins in cleaned event files. If a bin has >2000 counts, and if more than 50% of those come from <1% of pixels, then it is considered to be noise-dominated and hence unusable.
| Quadrant | # 1 sec bins | Bins with >0 counts | Bins with >2000 counts | High rate bins dominated by noise | Noise dominated (total time) | Noise dominated (detector-on time) | Marked lightcurve |
|---|---|---|---|---|---|---|---|
| A | 7299 | 7005 | 259 | 259 | 3.55% | 3.70% | 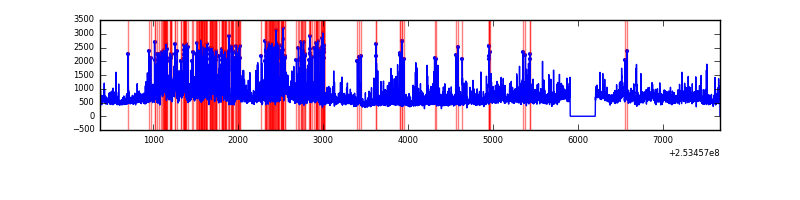 |
| B | 7299 | 7004 | 211 | 211 | 2.89% | 3.01% | 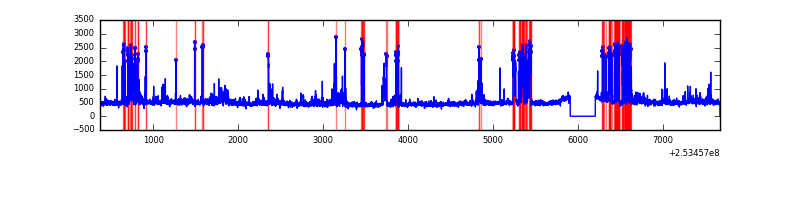 |
| C | 7299 | 7005 | 0 | 0 | 0.00% | 0.00% | 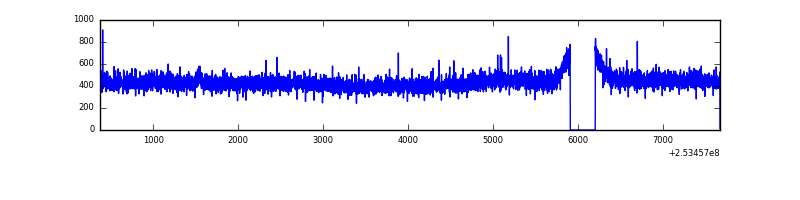 |
| D | 7299 | 7004 | 741 | 741 | 10.15% | 10.58% | 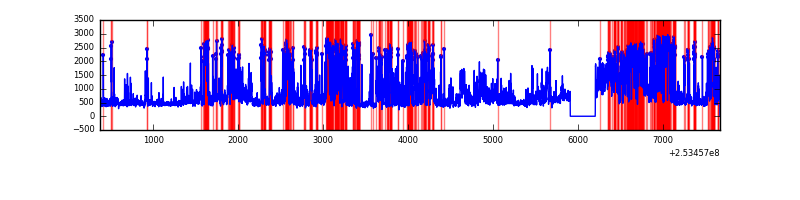 |
Top three noisy pixels from each quadrant. If the there are fewer than three noisy pixels in the level2.evt file, extra rows are filled as -1
| Pixel properties | Quadrant properties | ||||||
|---|---|---|---|---|---|---|---|
| Quadrant | DetID | PixID | Counts | Sigma | Mean | Median | Sigma |
| A | 13 | 251 | 1462226 | 9145.13 | 788 | 772 | 159.8 |
| A | 1 | 162 | 306311 | 1911.92 | 788 | 772 | 159.8 |
| A | 1 | 178 | 176570 | 1100.06 | 788 | 772 | 159.8 |
| B | 4 | 239 | 499726 | 3332.9 | 791 | 771 | 149.7 |
| B | 3 | 64 | 429010 | 2860.53 | 791 | 771 | 149.7 |
| B | 0 | 219 | 60881 | 401.52 | 791 | 771 | 149.7 |
| C | 8 | 112 | 5883 | 28.37 | 776 | 778 | 179.9 |
| C | 13 | 61 | 5728 | 27.51 | 776 | 778 | 179.9 |
| C | 8 | 128 | 3166 | 13.27 | 776 | 778 | 179.9 |
| D | 1 | 52 | 2217459 | 12355.4 | 745 | 723 | 179.4 |
| D | 10 | 199 | 766535 | 4268.4 | 745 | 723 | 179.4 |
| D | 10 | 157 | 367627 | 2045.01 | 745 | 723 | 179.4 |
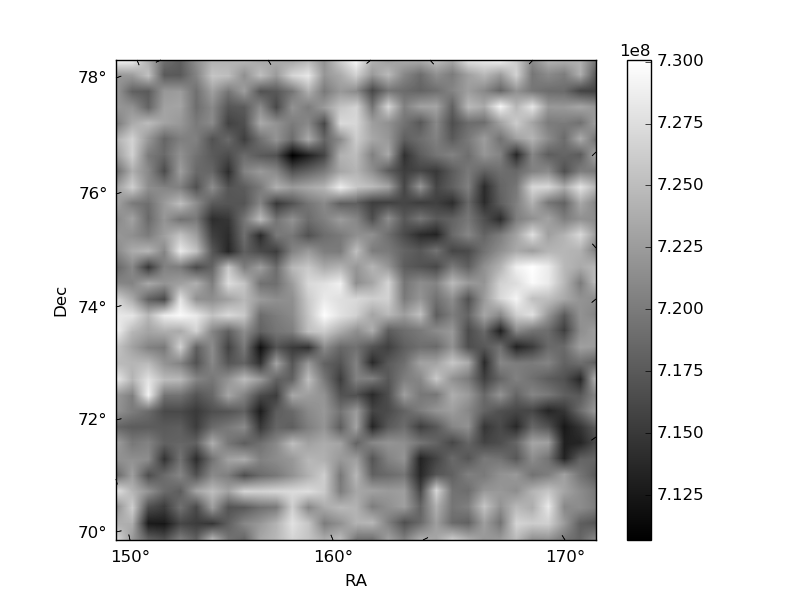
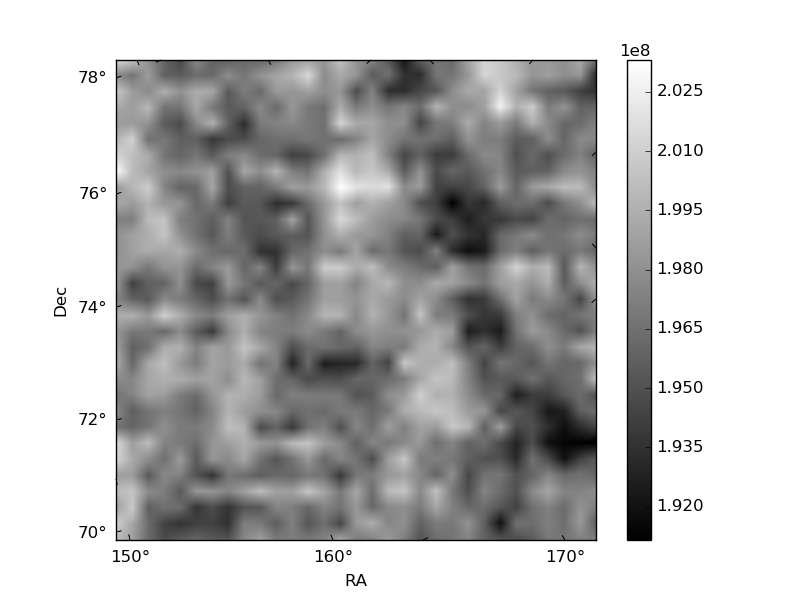
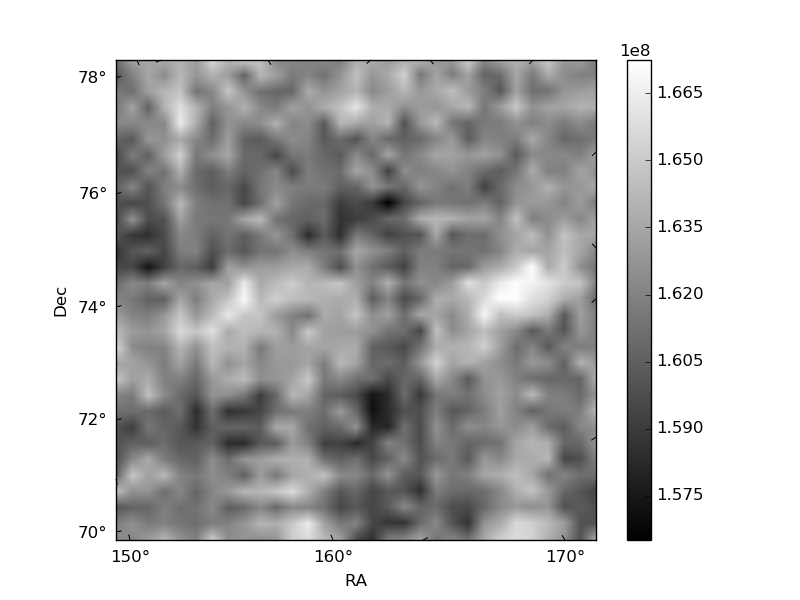
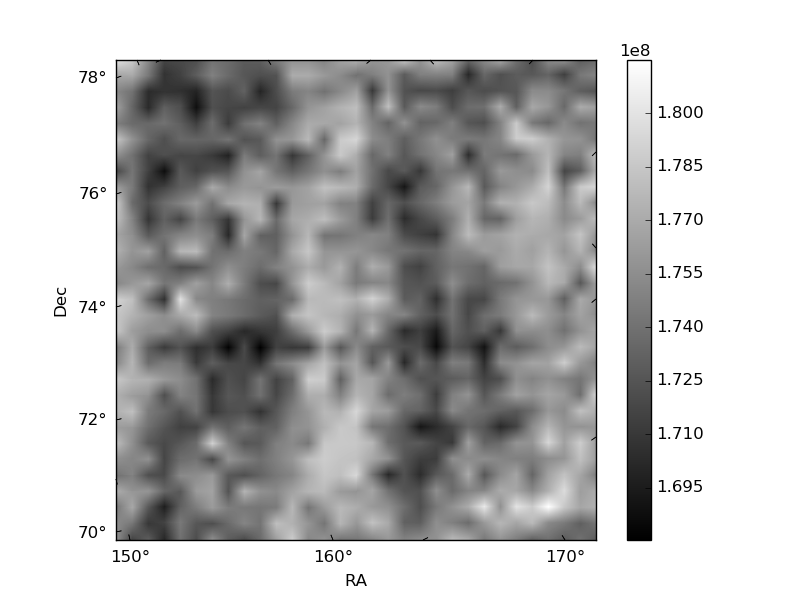
Histogram calculated using DETX and DETY for each event in the final _common_clean file
| Quadrant A | 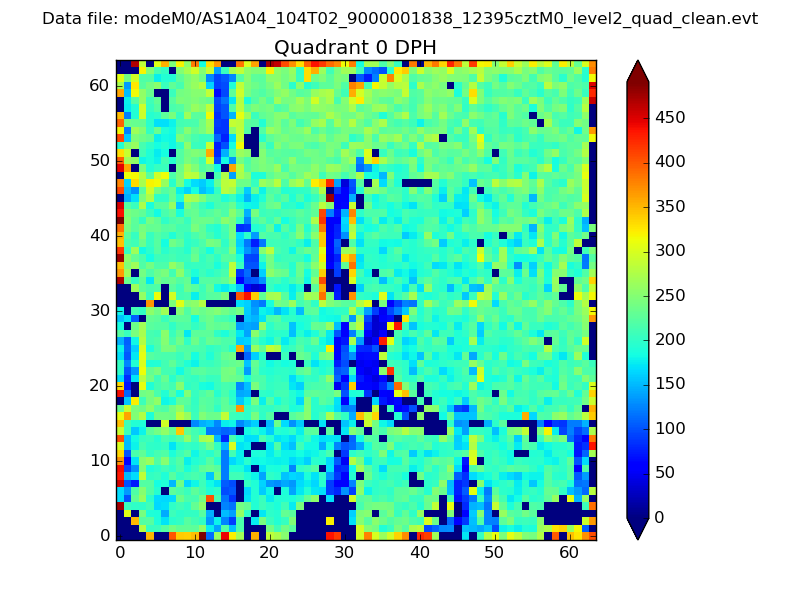 |
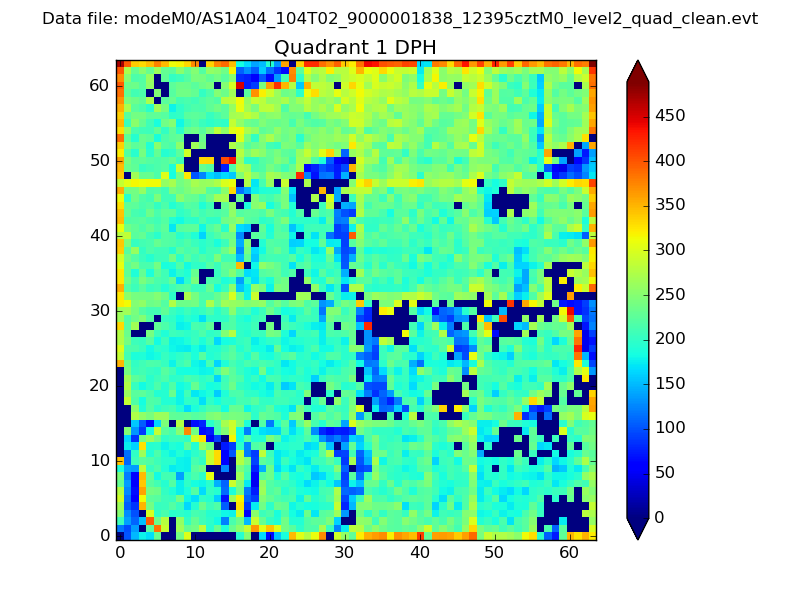 |
Quadrant B |
|---|---|---|---|
| Quadrant D | 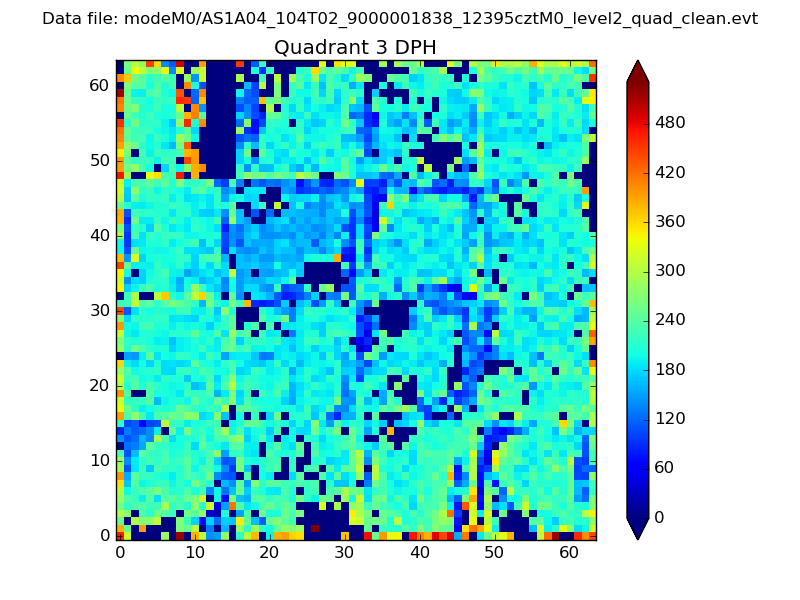 |
 |
Quadrant C |
| Plot type | Count rate plots | Images |
|---|---|---|
| Comparison with Poisson distribution Blue bars denote a histogram of data divided into 1 sec bins. Red curve is a Poisson curve with rate = median count rate of data. |
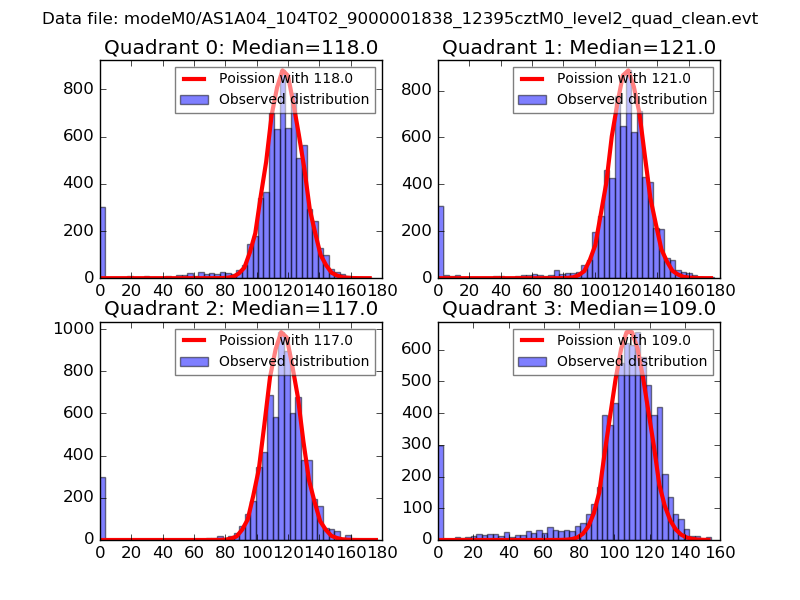 |
 |
| Quadrant-wise count rates Data is divided into 100 sec bins |
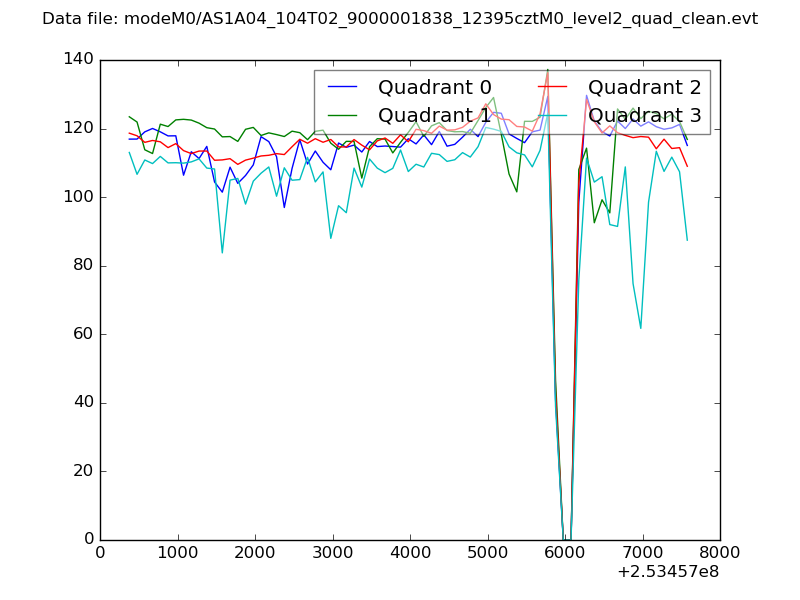 |
|
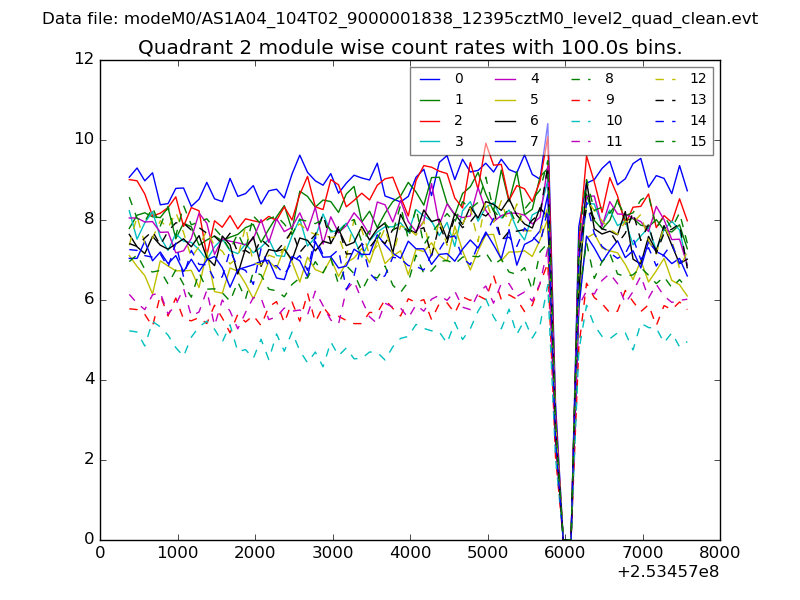
| Module-wise count rates for Quadrant A Data is divided into 100 sec bins |
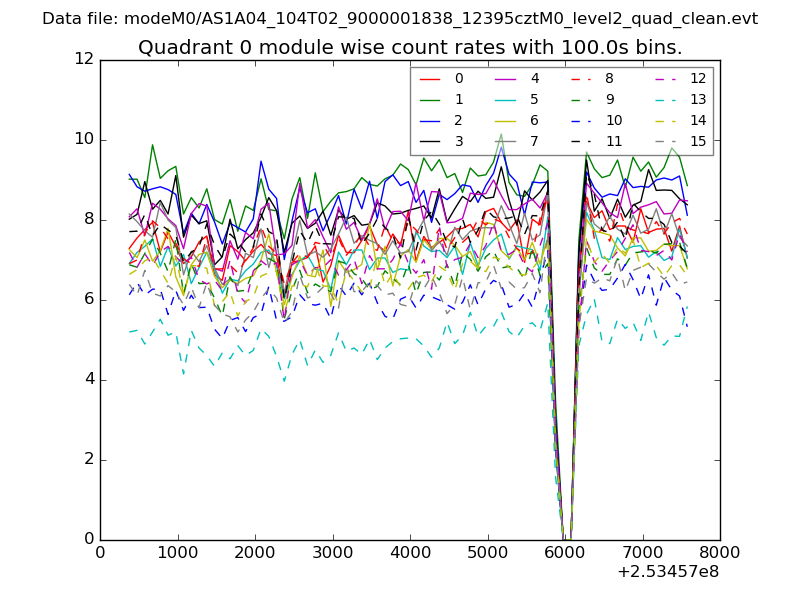 |
 |
| Module-wise count rates for Quadrant B Data is divided into 100 sec bins |
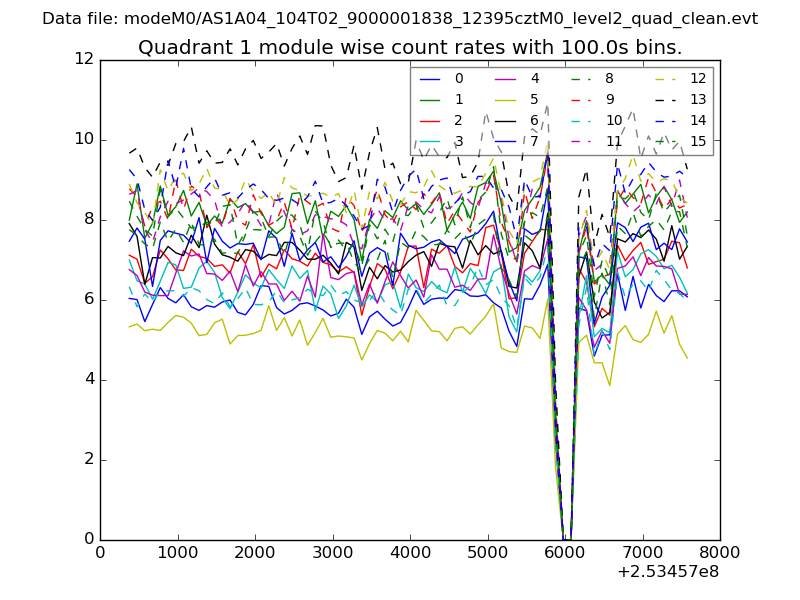 |
 |
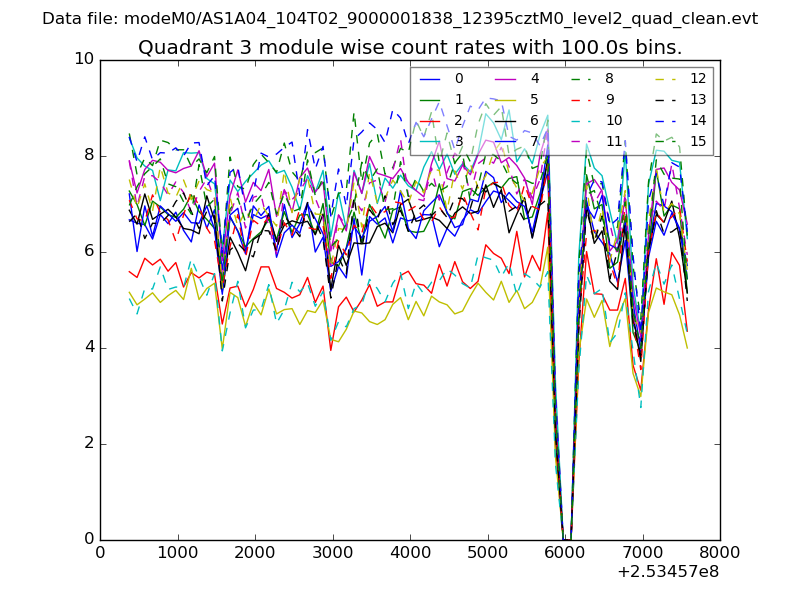
| Module-wise count rates for Quadrant C Data is divided into 100 sec bins |
 |
 |
| Module-wise count rates for Quadrant D Data is divided into 100 sec bins |
 |
 |
| Parameter | Plot |
|---|---|
| CZT HV Monitor | 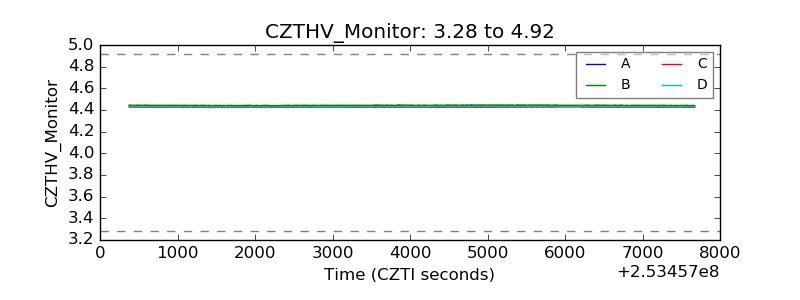 |
| D_VDD | 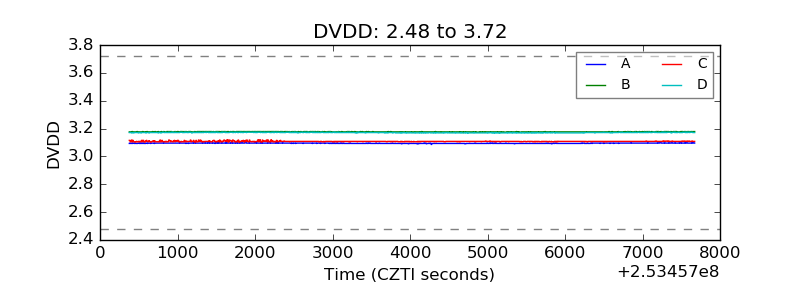 |
| Temperature 1 | 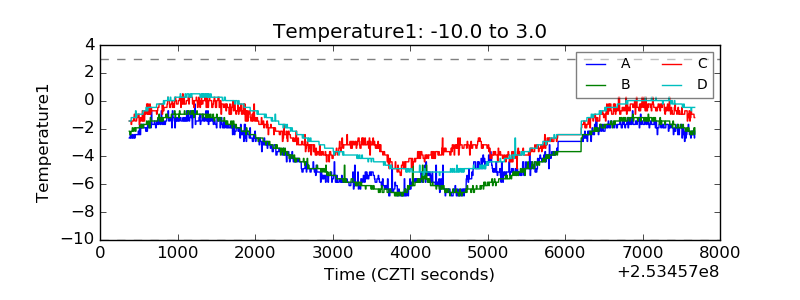 |
| Veto HV Monitor | 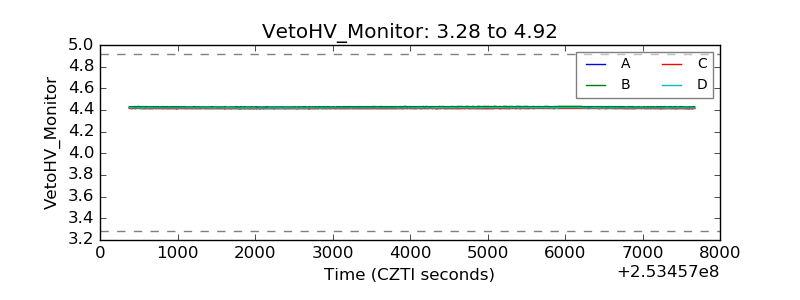 |
| Veto LLD | 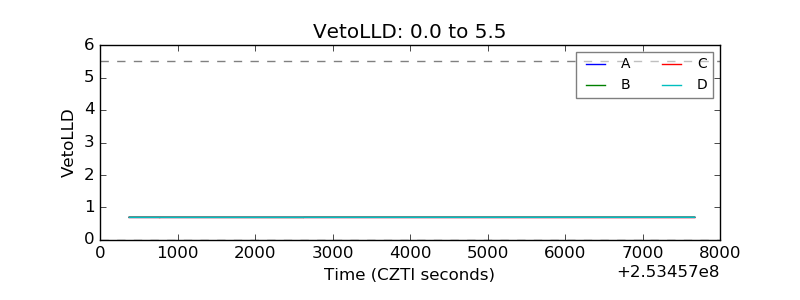 |
| Alpha Counter | 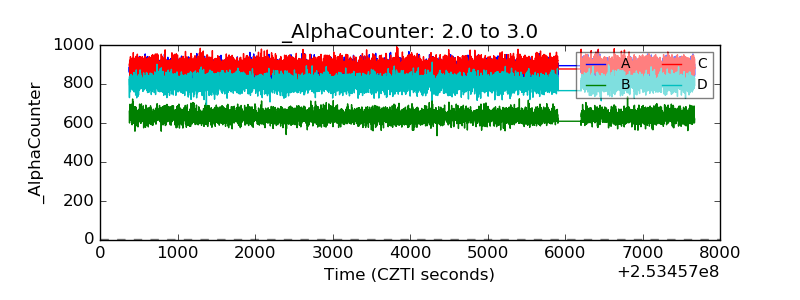 |
| _CPM_Rate | 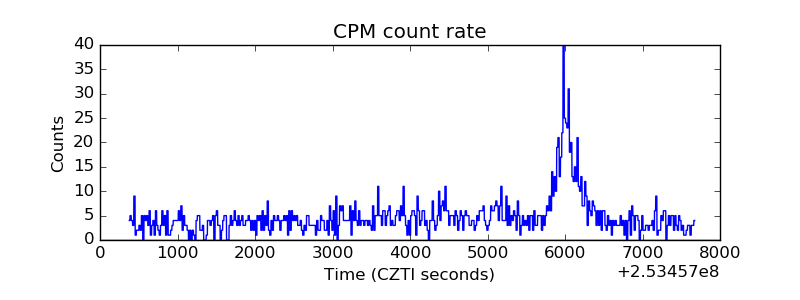 |
| CZT Counter | 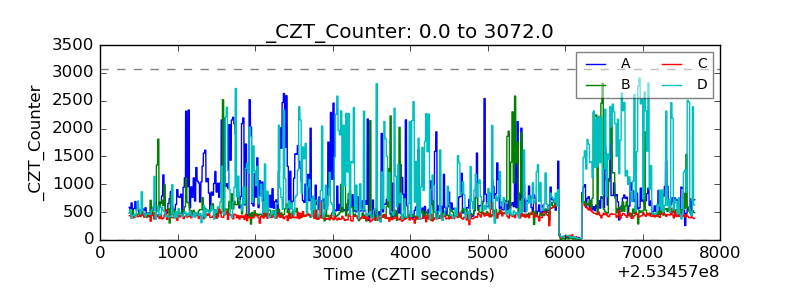 |
| +2.5 Volts monitor |  |
| +5 Volts monitor |  |
| _ROLL_ROT | 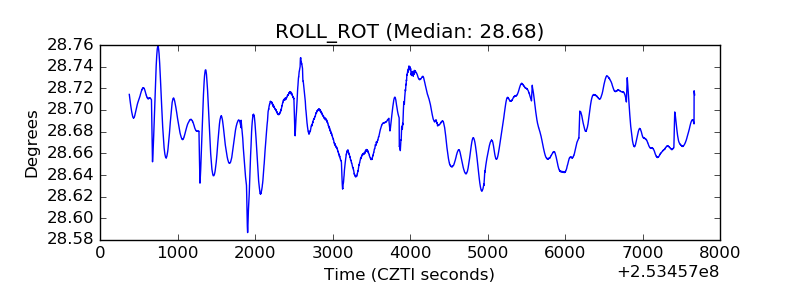 |
| _Roll_DEC | 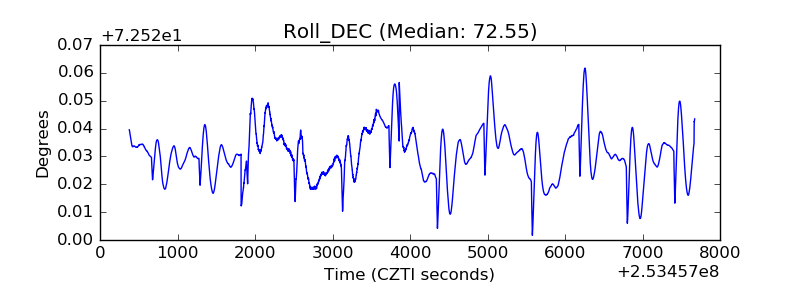 |
| _Roll_RA | 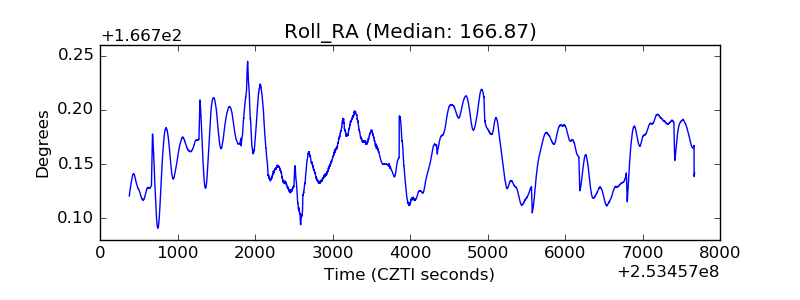 |
| Veto Counter | 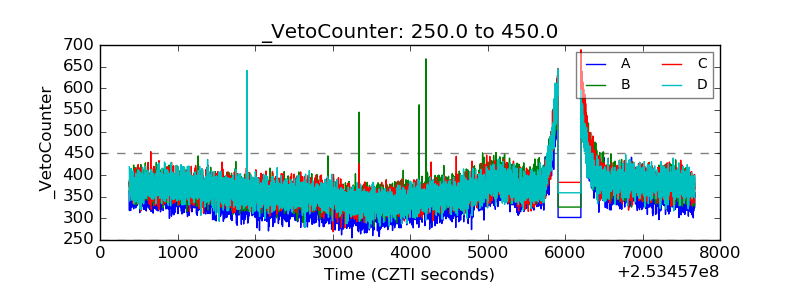 |