| Param | Original file | Final file |
|---|---|---|
| Filename | modeM0/AS1A04_104T02_9000001838_12398cztM0_level2.evt | modeM0/AS1A04_104T02_9000001838_12398cztM0_level2_quad_clean.evt |
| Size (bytes) | 694,814,400 | 119,131,200 |
| Size | 662.6 MB | 113.6 MB |
| Events in quadrant A | 4,632,803 | 820,249 |
| Events in quadrant B | 3,565,264 | 845,952 |
| Events in quadrant C | 2,999,182 | 816,899 |
| Events in quadrant D | 9,378,033 | 642,907 |
| Mode SS | |||
|---|---|---|---|
| Quadrant | BADHDUFLAG | Total packets | Discarded packets |
| A | 0 | 140 | 0 |
| B | 0 | 140 | 0 |
| C | 0 | 140 | 0 |
| D | 0 | 140 | 0 |
| Mode M9 | |||
|---|---|---|---|
| Quadrant | BADHDUFLAG | Total packets | Discarded packets |
| A | 0 | 5 | 0 |
| B | 0 | 5 | 0 |
| C | 0 | 5 | 0 |
| D | 0 | 5 | 0 |
| Mode M0 | |||
|---|---|---|---|
| Quadrant | BADHDUFLAG | Total packets | Discarded packets |
| A | 0 | 18534 | 1 |
| B | 0 | 15142 | 1 |
| C | 0 | 13917 | 1 |
| D | 0 | 32449 | 1 |
| Quadrant | Total seconds | Saturated seconds | Saturation percentage |
|---|---|---|---|
| A | 6905 | 248 | 3.591600% |
| B | 6905 | 61 | 0.883418% |
| C | 6905 | 18 | 0.260681% |
| D | 6905 | 2185 | 31.643736% |
Noise dominated data is calculated using 1-second bins in cleaned event files. If a bin has >2000 counts, and if more than 50% of those come from <1% of pixels, then it is considered to be noise-dominated and hence unusable.
| Quadrant | # 1 sec bins | Bins with >0 counts | Bins with >2000 counts | High rate bins dominated by noise | Noise dominated (total time) | Noise dominated (detector-on time) | Marked lightcurve |
|---|---|---|---|---|---|---|---|
| A | 7406 | 6907 | 135 | 135 | 1.82% | 1.95% | 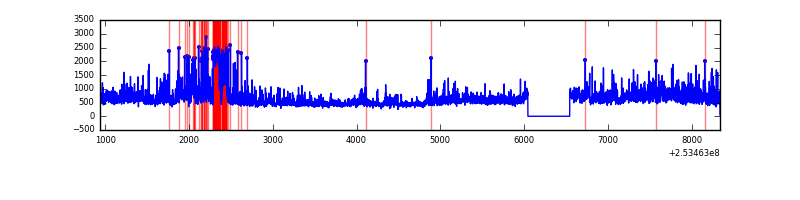 |
| B | 7406 | 6906 | 19 | 19 | 0.26% | 0.28% | 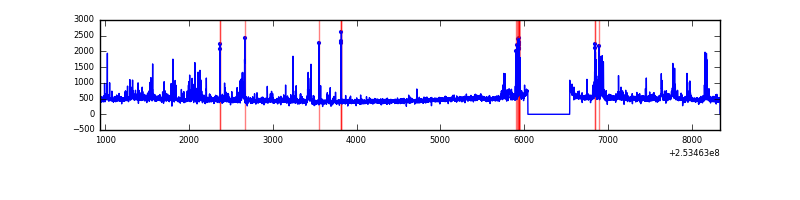 |
| C | 7406 | 6906 | 0 | 0 | 0.00% | 0.00% | 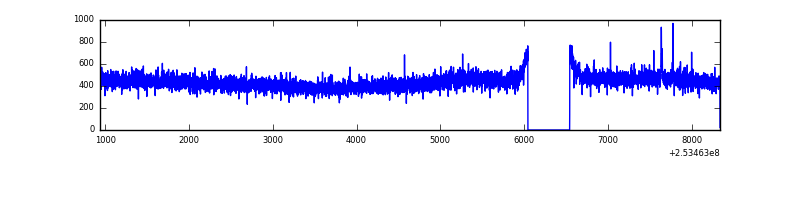 |
| D | 7406 | 6906 | 2179 | 2179 | 29.42% | 31.55% | 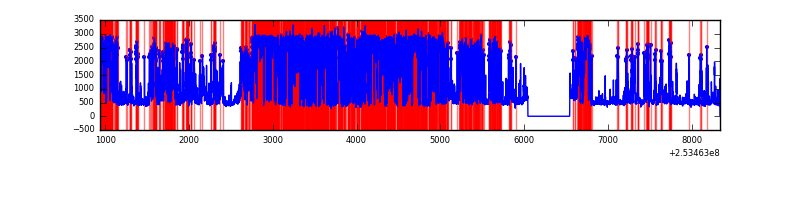 |
Top three noisy pixels from each quadrant. If the there are fewer than three noisy pixels in the level2.evt file, extra rows are filled as -1
| Pixel properties | Quadrant properties | ||||||
|---|---|---|---|---|---|---|---|
| Quadrant | DetID | PixID | Counts | Sigma | Mean | Median | Sigma |
| A | 13 | 251 | 427062 | 2643.01 | 788 | 772 | 161.3 |
| A | 14 | 237 | 369737 | 2287.59 | 788 | 772 | 161.3 |
| A | 1 | 162 | 261201 | 1614.67 | 788 | 772 | 161.3 |
| B | 4 | 239 | 246869 | 1634.53 | 799 | 780 | 150.6 |
| B | 0 | 219 | 58804 | 385.4 | 799 | 780 | 150.6 |
| B | 0 | 197 | 43126 | 281.26 | 799 | 780 | 150.6 |
| C | 13 | 61 | 5699 | 27.47 | 769 | 771 | 179.4 |
| C | 3 | 202 | 1954 | 6.6 | 769 | 771 | 179.4 |
| C | -1 | -1 | -1 | -1.0 | 769 | 771 | 179.4 |
| D | 1 | 52 | 5863939 | 36628.87 | 660 | 639 | 160.1 |
| D | 10 | 157 | 491485 | 3066.39 | 660 | 639 | 160.1 |
| D | 10 | 199 | 324131 | 2020.9 | 660 | 639 | 160.1 |
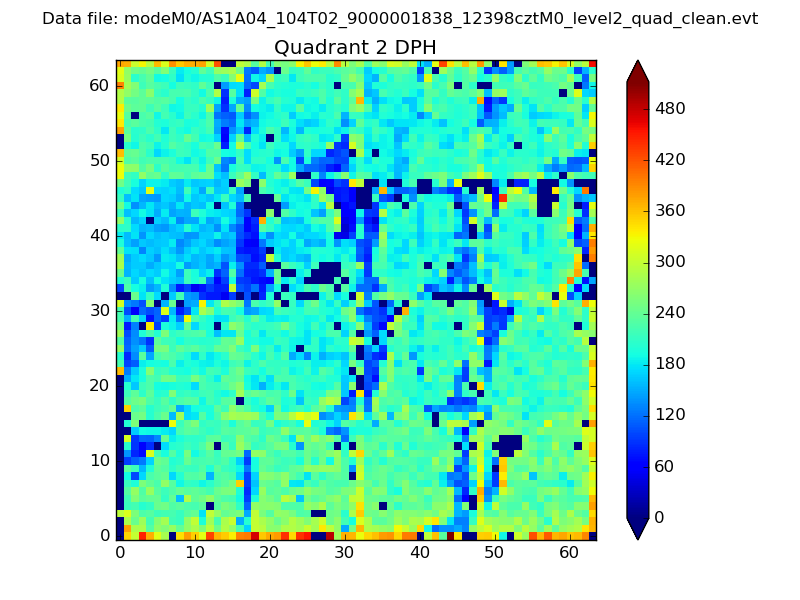
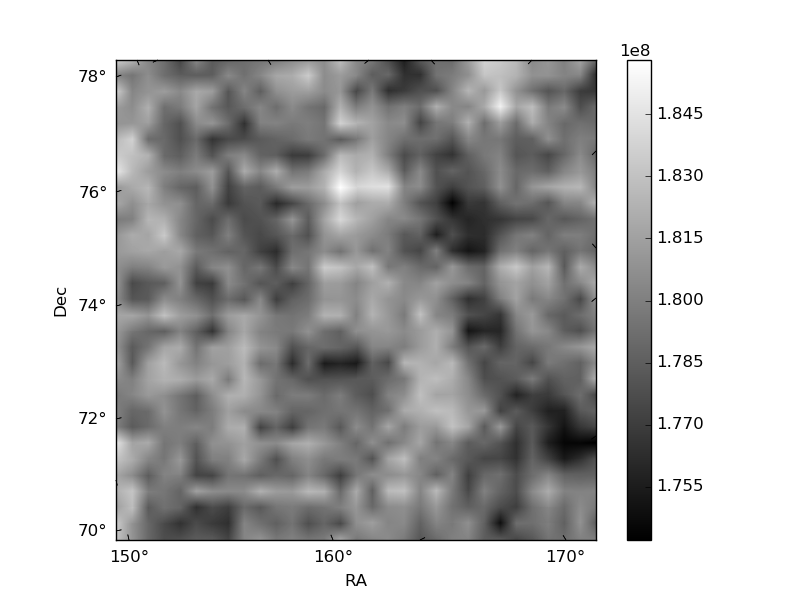
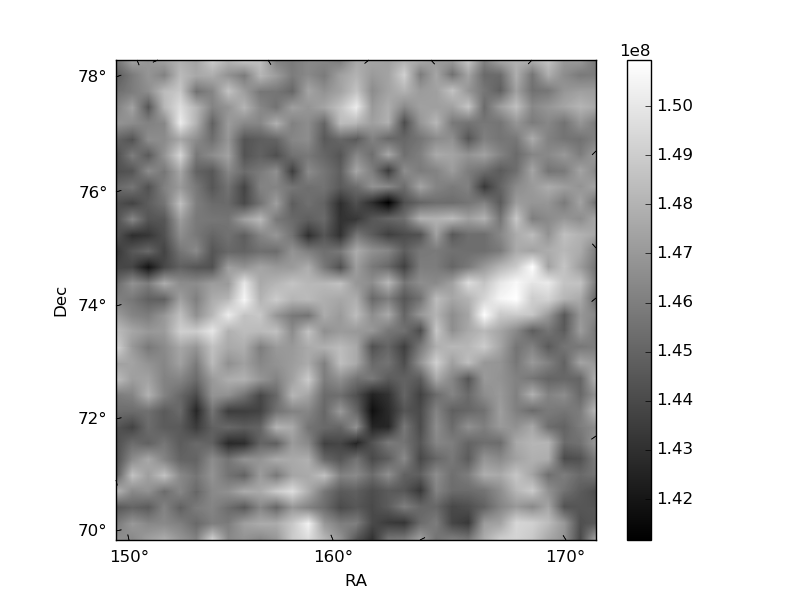
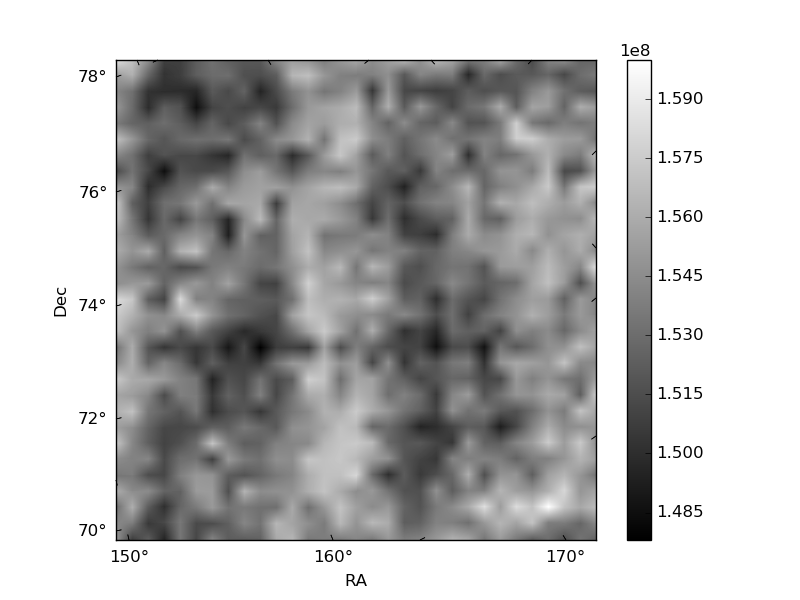
Histogram calculated using DETX and DETY for each event in the final _common_clean file
| Quadrant A | 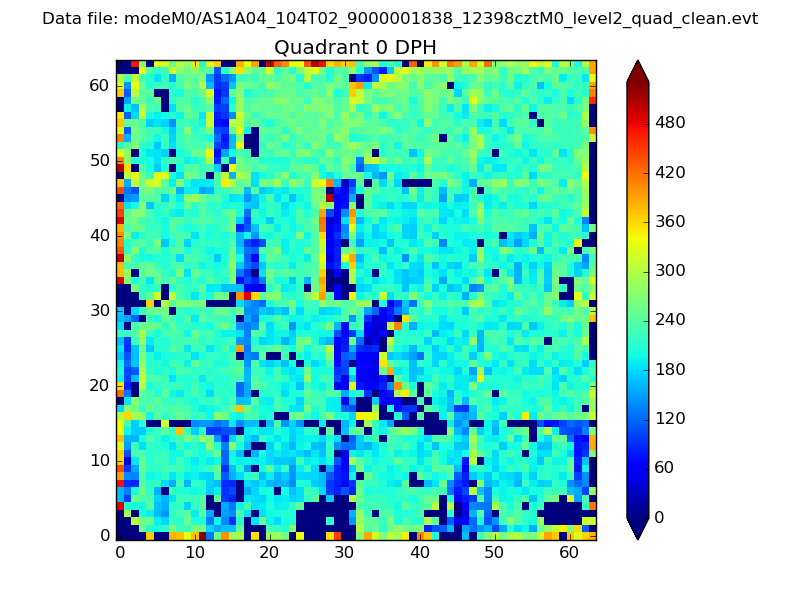 |
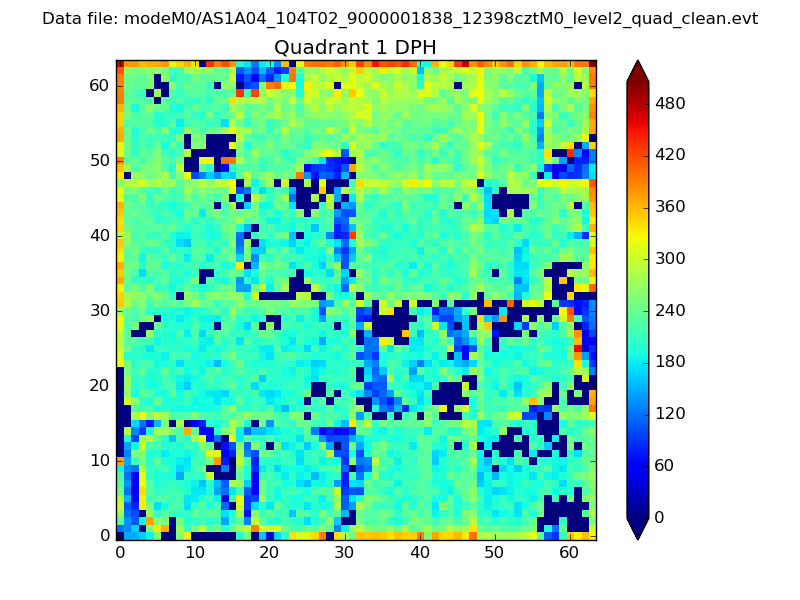 |
Quadrant B |
|---|---|---|---|
| Quadrant D | 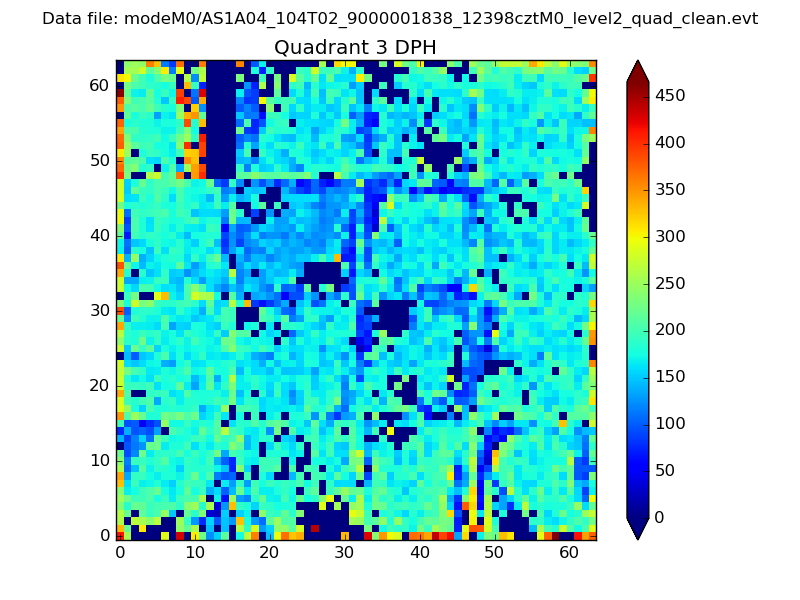 |
 |
Quadrant C |
| Plot type | Count rate plots | Images |
|---|---|---|
| Comparison with Poisson distribution Blue bars denote a histogram of data divided into 1 sec bins. Red curve is a Poisson curve with rate = median count rate of data. |
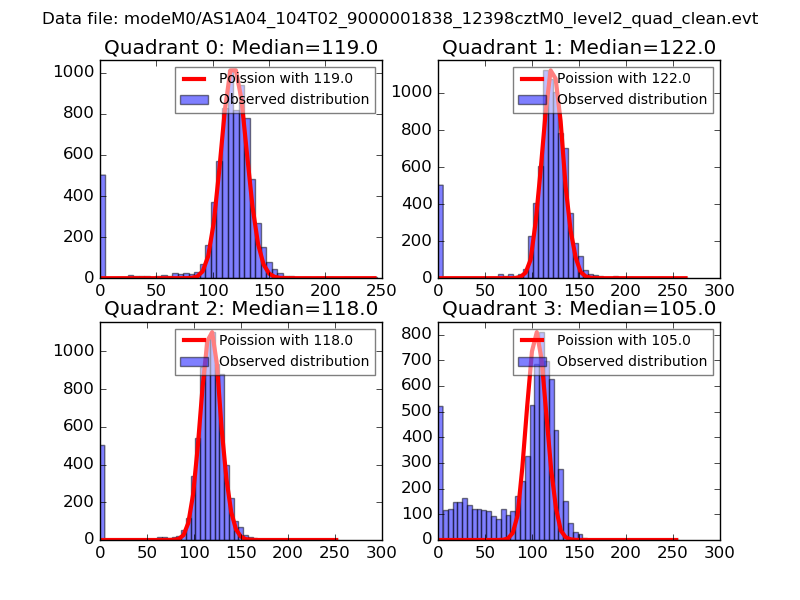 |
 |
| Quadrant-wise count rates Data is divided into 100 sec bins |
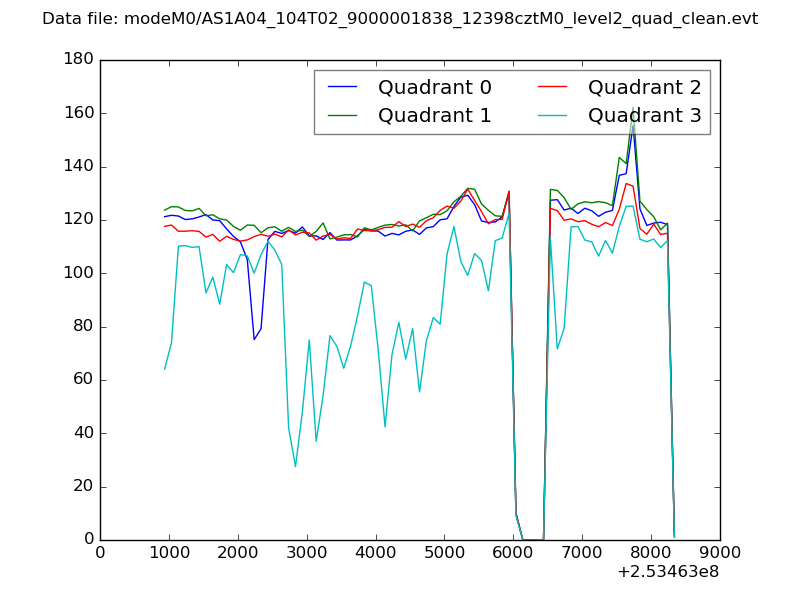 |
|
| Module-wise count rates for Quadrant A Data is divided into 100 sec bins |
 |
 |
| Module-wise count rates for Quadrant B Data is divided into 100 sec bins |
 |
 |
| Module-wise count rates for Quadrant C Data is divided into 100 sec bins |
 |
 |
| Module-wise count rates for Quadrant D Data is divided into 100 sec bins |
 |
 |
| Parameter | Plot |
|---|---|
| CZT HV Monitor | 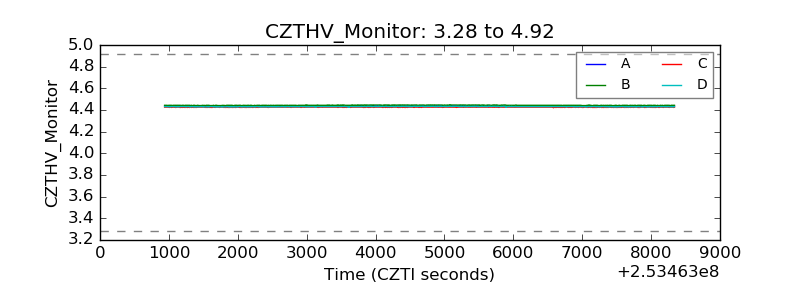 |
| D_VDD | 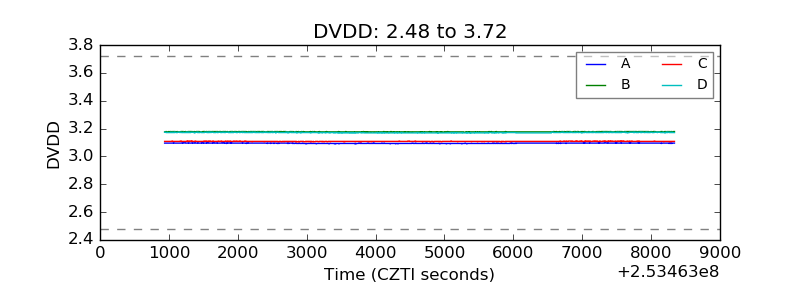 |
| Temperature 1 | 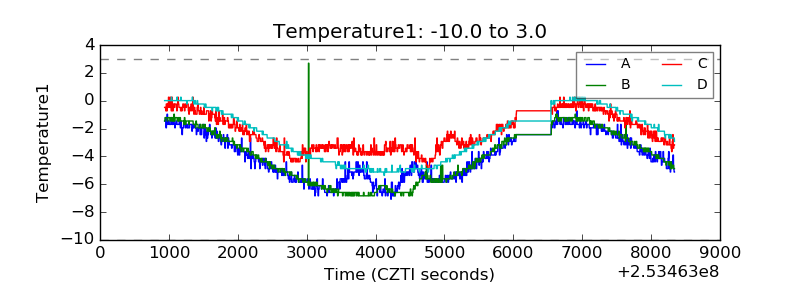 |
| Veto HV Monitor | 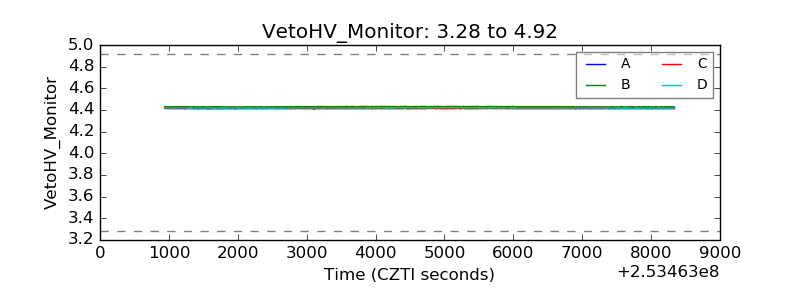 |
| Veto LLD |  |
| Alpha Counter | 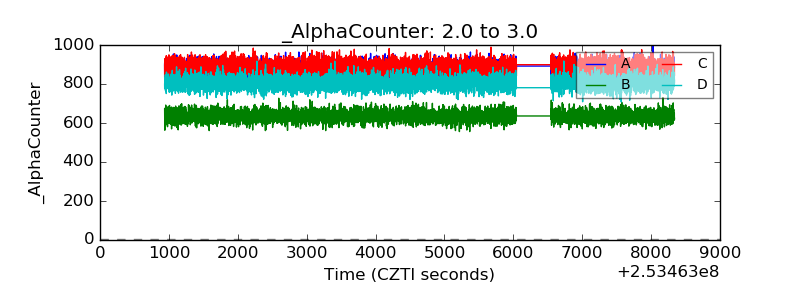 |
| _CPM_Rate | 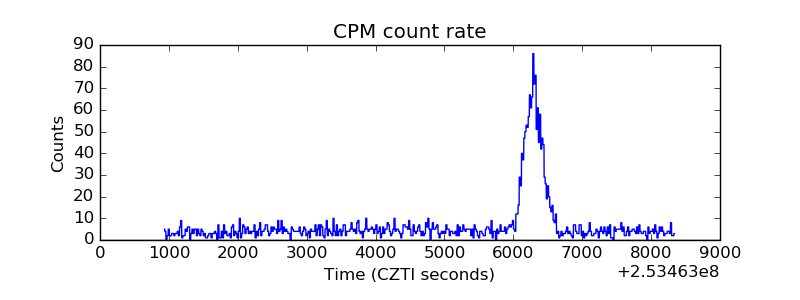 |
| CZT Counter | 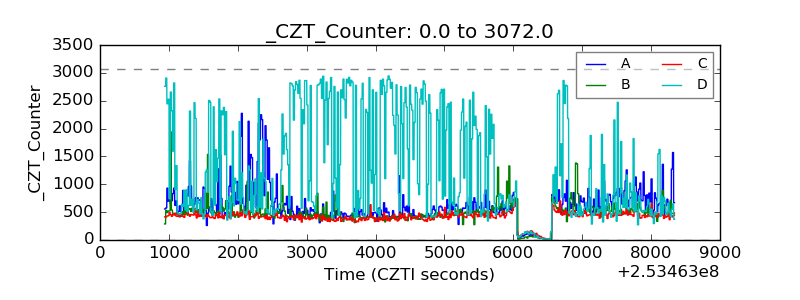 |
| +2.5 Volts monitor |  |
| +5 Volts monitor |  |
| _ROLL_ROT | 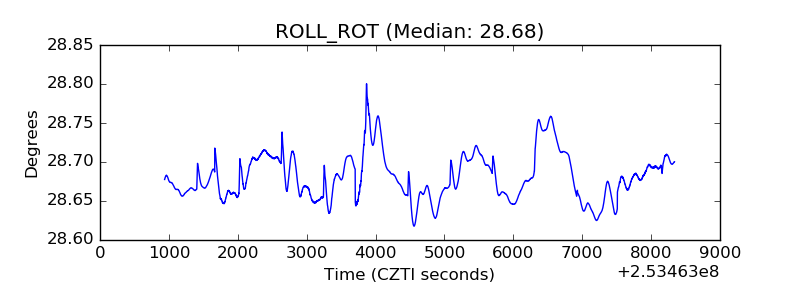 |
| _Roll_DEC | 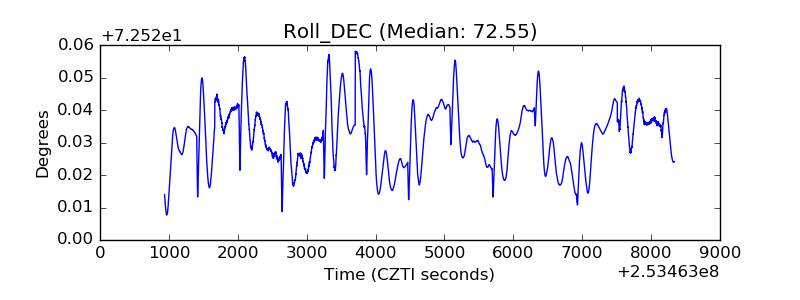 |
| _Roll_RA | 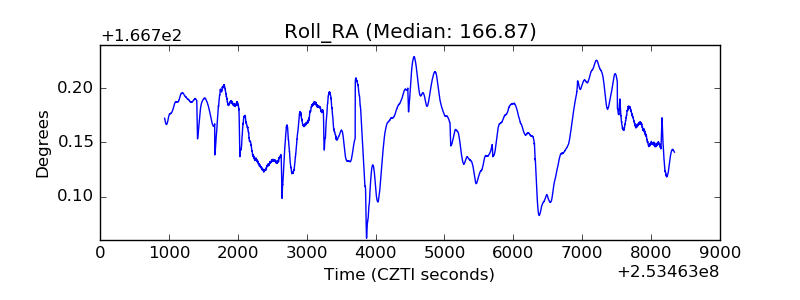 |
| Veto Counter | 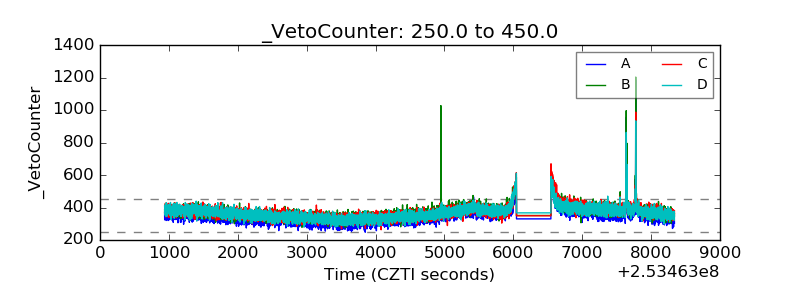 |