| Param | Original file | Final file |
|---|---|---|
| Filename | modeM0/AS1G08_083T02_9000001840_12398cztM0_level2.evt | modeM0/AS1G08_083T02_9000001840_12398cztM0_level2_quad_clean.evt |
| Size (bytes) | 434,367,360 | 63,933,120 |
| Size | 414.2 MB | 61.0 MB |
| Events in quadrant A | 3,289,128 | 402,228 |
| Events in quadrant B | 2,778,716 | 406,141 |
| Events in quadrant C | 2,258,734 | 404,764 |
| Events in quadrant D | 4,483,827 | 367,158 |
| Mode M9 | |||
|---|---|---|---|
| Quadrant | BADHDUFLAG | Total packets | Discarded packets |
| A | 0 | 7 | 0 |
| B | 0 | 7 | 0 |
| C | 0 | 7 | 0 |
| D | 0 | 7 | 0 |
| Mode SS | |||
|---|---|---|---|
| Quadrant | BADHDUFLAG | Total packets | Discarded packets |
| A | 0 | 102 | 0 |
| B | 0 | 102 | 0 |
| C | 0 | 102 | 0 |
| D | 0 | 102 | 0 |
| Mode M0 | |||
|---|---|---|---|
| Quadrant | BADHDUFLAG | Total packets | Discarded packets |
| A | 0 | 13325 | 2 |
| B | 0 | 11600 | 1 |
| C | 0 | 10272 | 1 |
| D | 0 | 16737 | 1 |
| Quadrant | Total seconds | Saturated seconds | Saturation percentage |
|---|---|---|---|
| A | 5074 | 160 | 3.153331% |
| B | 5074 | 119 | 2.345290% |
| C | 5074 | 17 | 0.335041% |
| D | 5074 | 601 | 11.844698% |
Noise dominated data is calculated using 1-second bins in cleaned event files. If a bin has >2000 counts, and if more than 50% of those come from <1% of pixels, then it is considered to be noise-dominated and hence unusable.
| Quadrant | # 1 sec bins | Bins with >0 counts | Bins with >2000 counts | High rate bins dominated by noise | Noise dominated (total time) | Noise dominated (detector-on time) | Marked lightcurve |
|---|---|---|---|---|---|---|---|
| A | 5730 | 5076 | 38 | 38 | 0.66% | 0.75% | 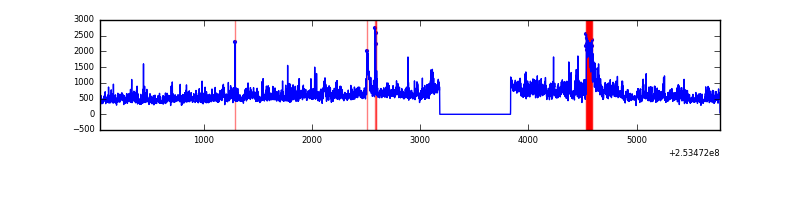 |
| B | 5730 | 5076 | 64 | 64 | 1.12% | 1.26% | 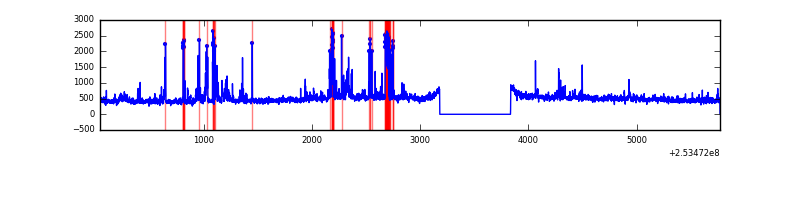 |
| C | 5730 | 5075 | 0 | 0 | 0.00% | 0.00% | 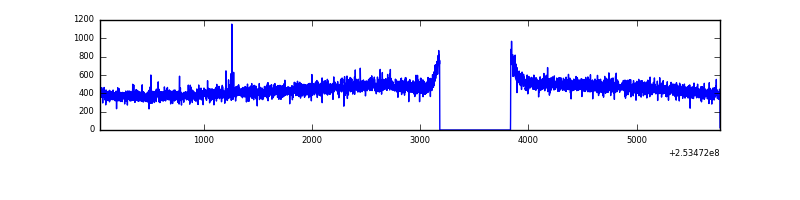 |
| D | 5730 | 5075 | 646 | 646 | 11.27% | 12.73% | 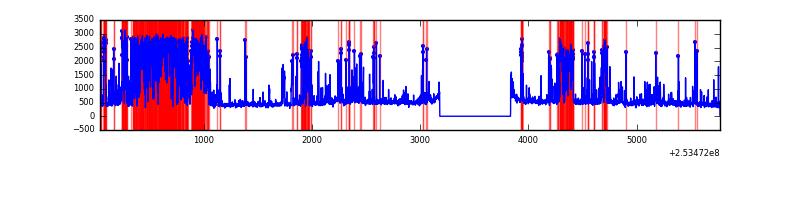 |
Top three noisy pixels from each quadrant. If the there are fewer than three noisy pixels in the level2.evt file, extra rows are filled as -1
| Pixel properties | Quadrant properties | ||||||
|---|---|---|---|---|---|---|---|
| Quadrant | DetID | PixID | Counts | Sigma | Mean | Median | Sigma |
| A | 1 | 162 | 218930 | 1804.37 | 591 | 577 | 121.0 |
| A | 14 | 237 | 171611 | 1413.35 | 591 | 577 | 121.0 |
| A | 13 | 251 | 147394 | 1213.23 | 591 | 577 | 121.0 |
| B | 4 | 239 | 330995 | 2883.17 | 592 | 579 | 114.6 |
| B | 0 | 187 | 25429 | 216.84 | 592 | 579 | 114.6 |
| B | 0 | 189 | 24003 | 204.4 | 592 | 579 | 114.6 |
| C | 13 | 61 | 4242 | 26.98 | 578 | 579 | 135.8 |
| C | 14 | 234 | 2150 | 11.57 | 578 | 579 | 135.8 |
| C | 3 | 202 | 1489 | 6.7 | 578 | 579 | 135.8 |
| D | 1 | 52 | 1807077 | 13053.64 | 558 | 540 | 138.4 |
| D | 10 | 199 | 333835 | 2408.32 | 558 | 540 | 138.4 |
| D | 10 | 157 | 43435 | 309.95 | 558 | 540 | 138.4 |
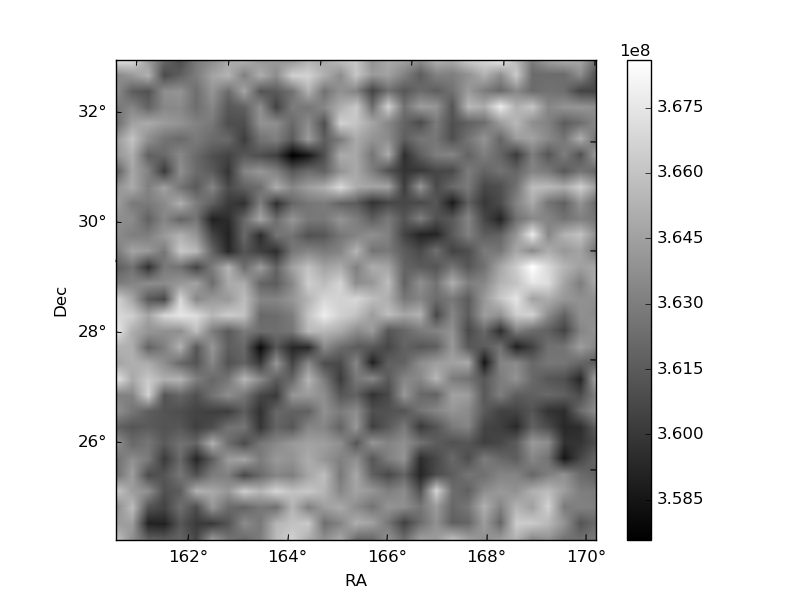
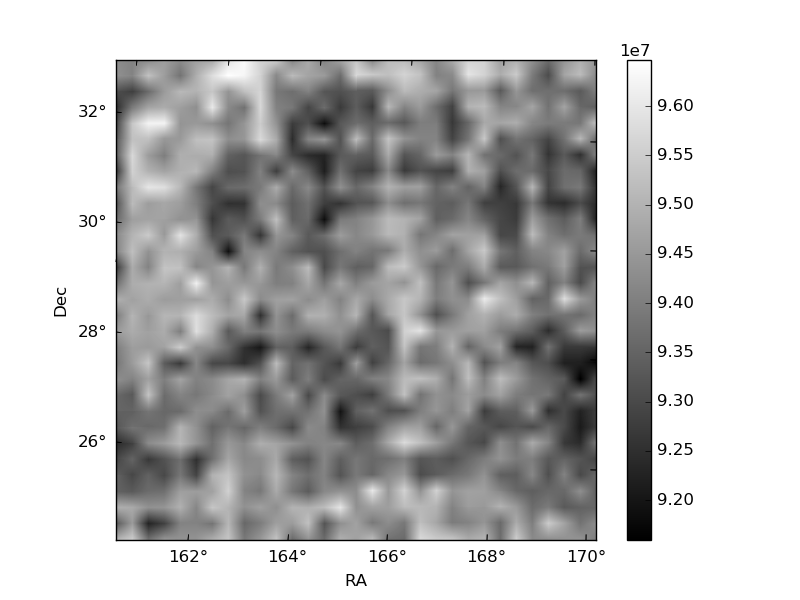
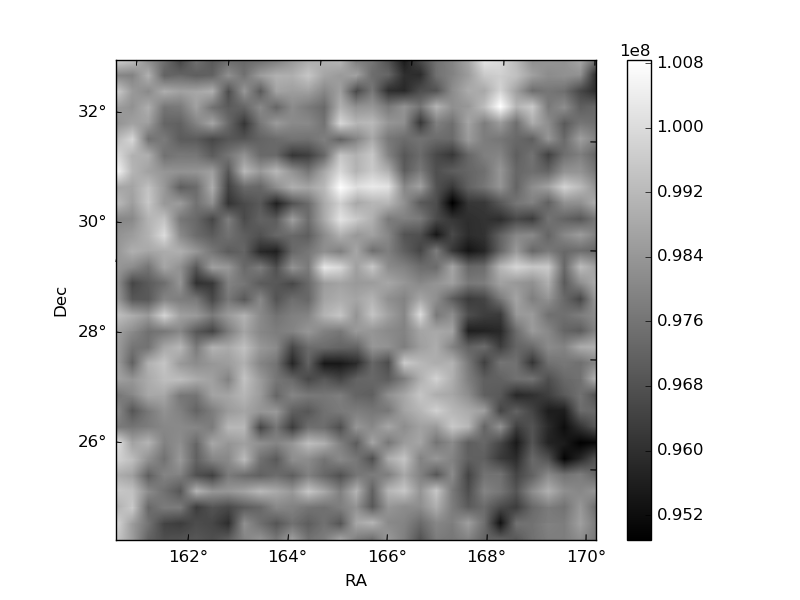
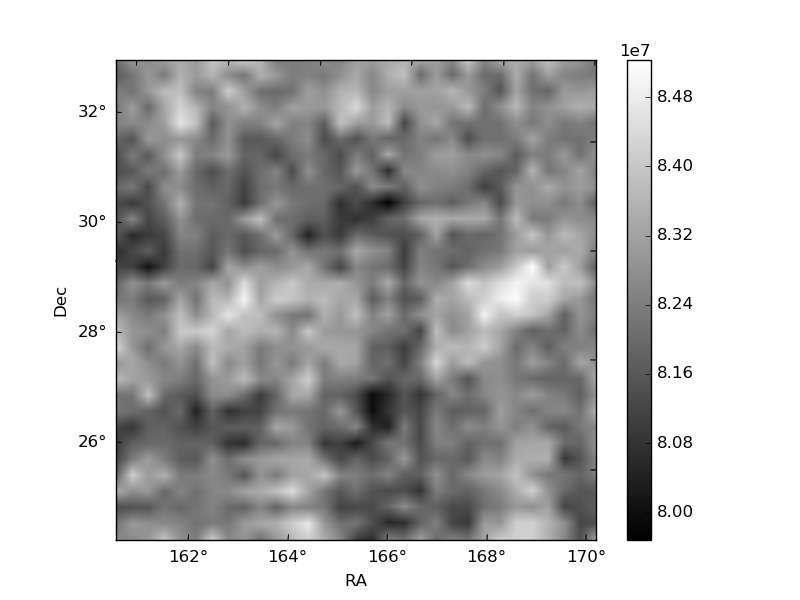
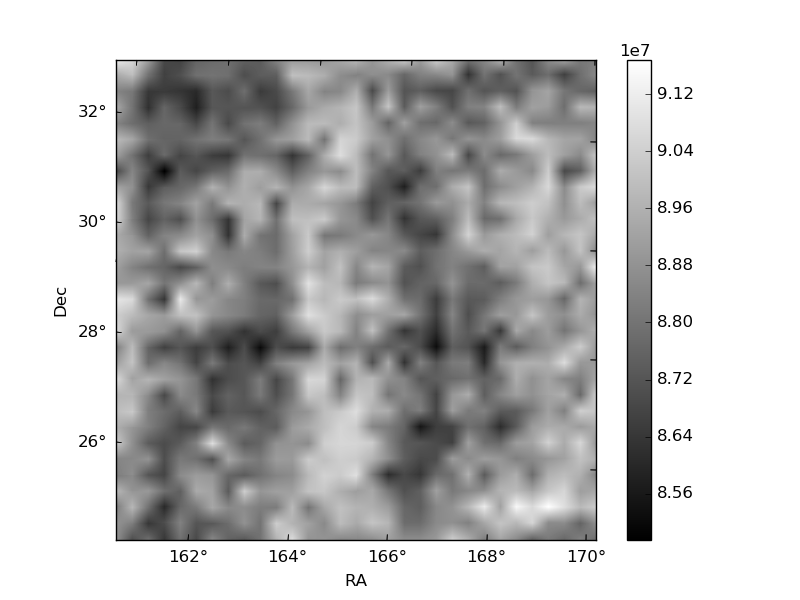
Histogram calculated using DETX and DETY for each event in the final _common_clean file
| Quadrant A | 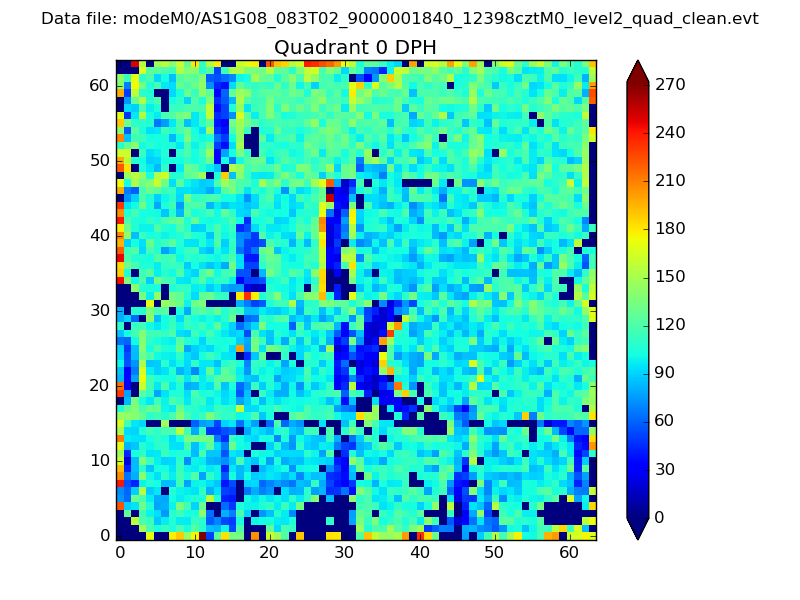 |
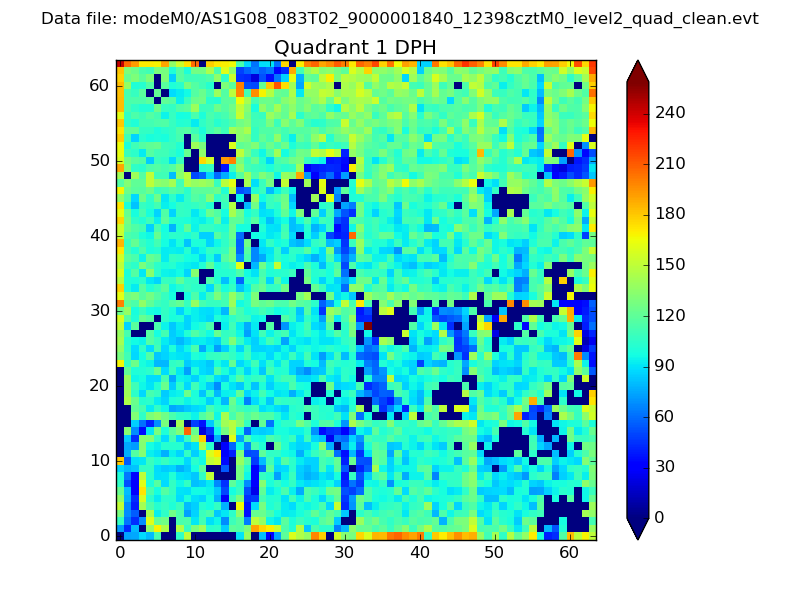 |
Quadrant B |
|---|---|---|---|
| Quadrant D |  |
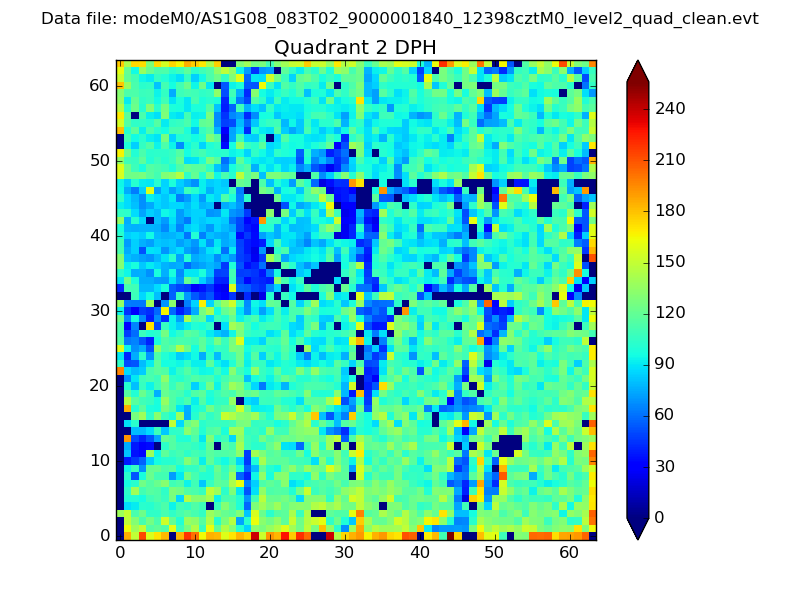 |
Quadrant C |
| Plot type | Count rate plots | Images |
|---|---|---|
| Comparison with Poisson distribution Blue bars denote a histogram of data divided into 1 sec bins. Red curve is a Poisson curve with rate = median count rate of data. |
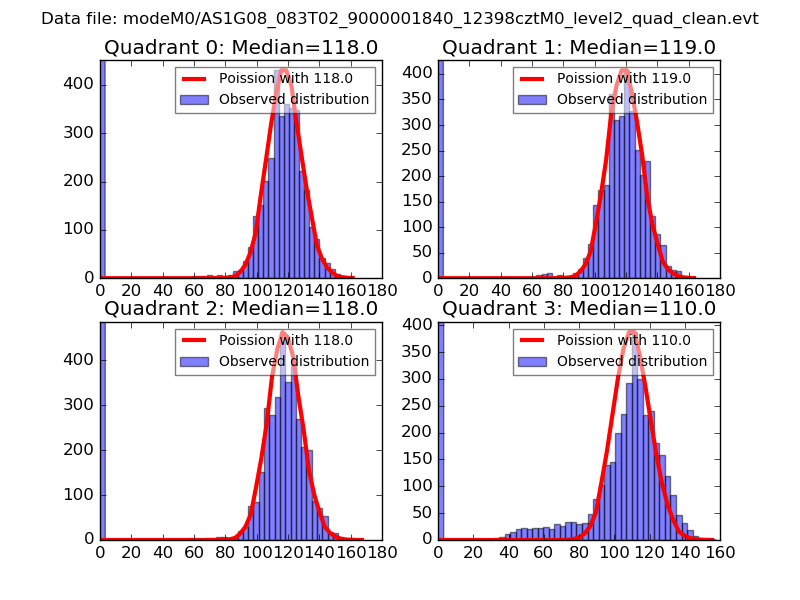 |
 |
| Quadrant-wise count rates Data is divided into 100 sec bins |
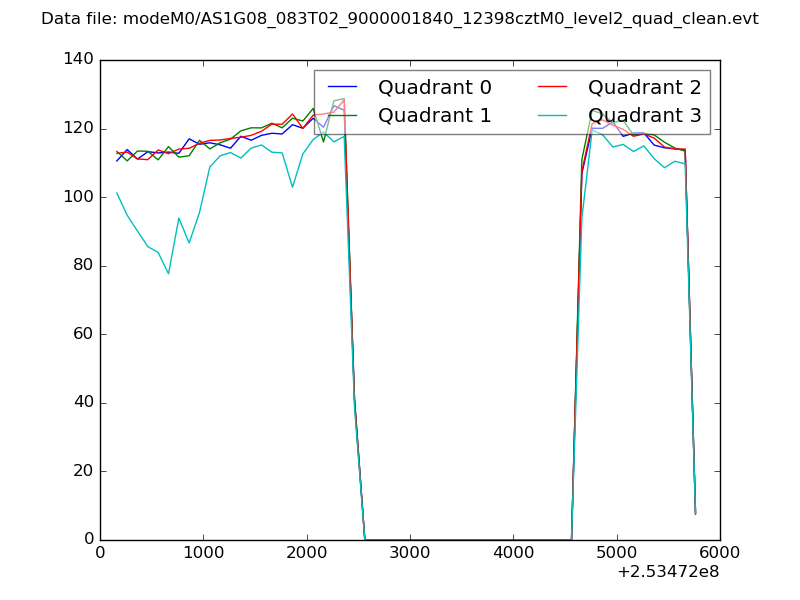 |
|
| Module-wise count rates for Quadrant A Data is divided into 100 sec bins |
 |
 |
| Module-wise count rates for Quadrant B Data is divided into 100 sec bins |
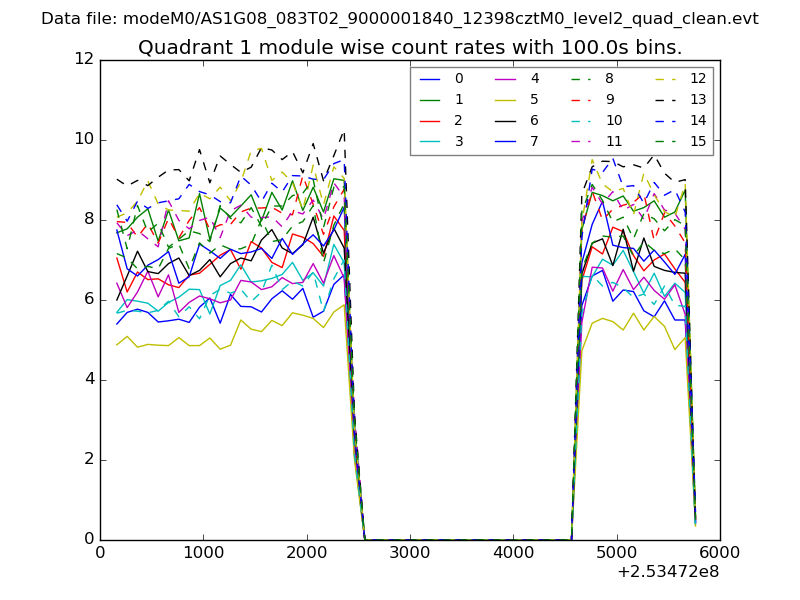 |
 |
| Module-wise count rates for Quadrant C Data is divided into 100 sec bins |
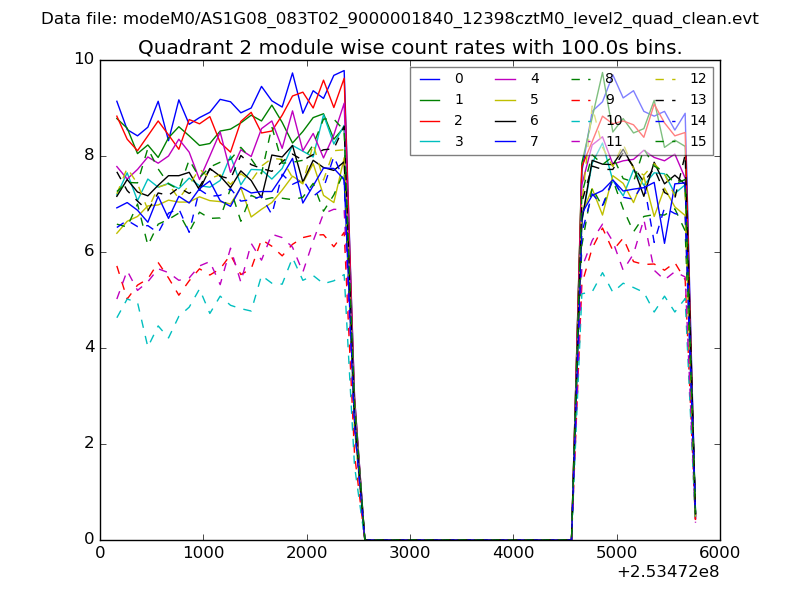 |
 |
| Module-wise count rates for Quadrant D Data is divided into 100 sec bins |
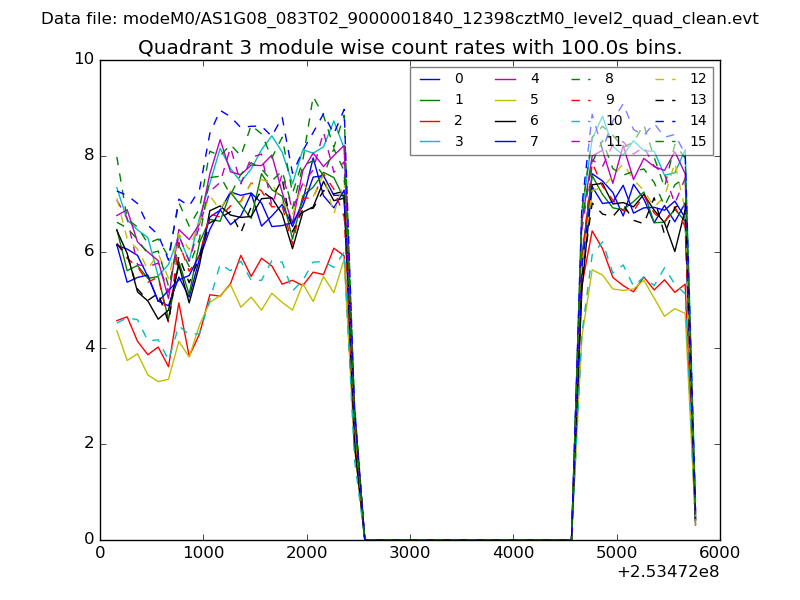 |
 |
| Parameter | Plot |
|---|---|
| CZT HV Monitor | 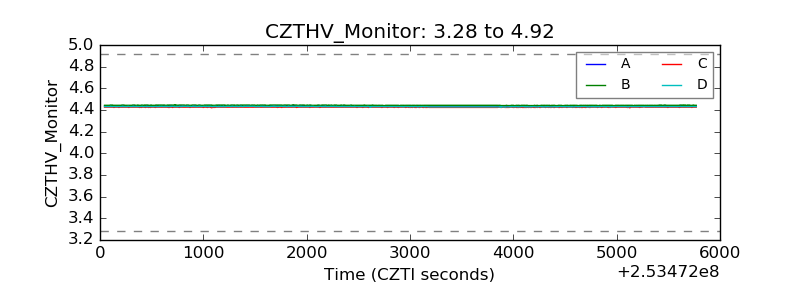 |
| D_VDD | 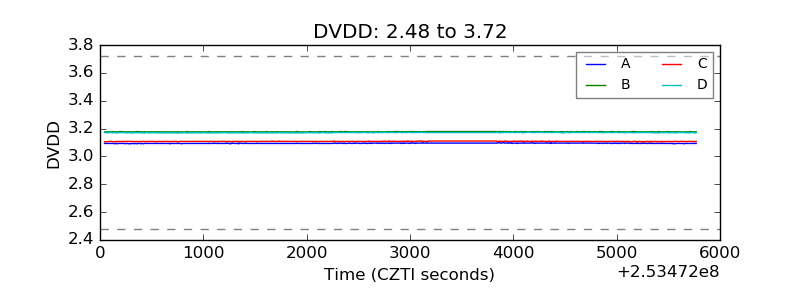 |
| Temperature 1 | 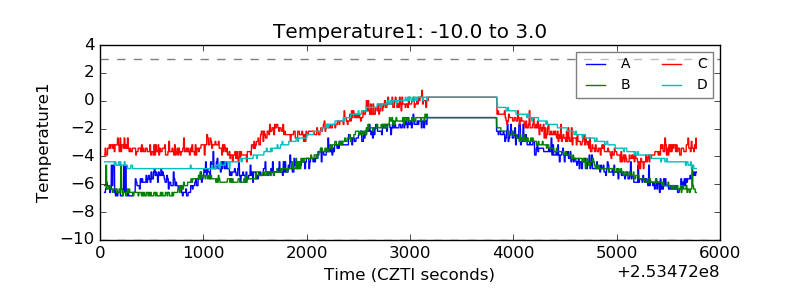 |
| Veto HV Monitor |  |
| Veto LLD | 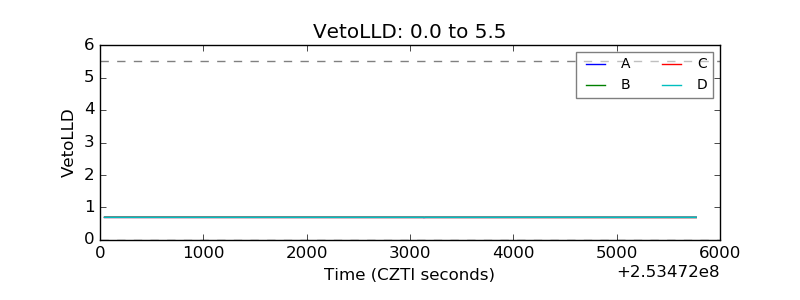 |
| Alpha Counter | 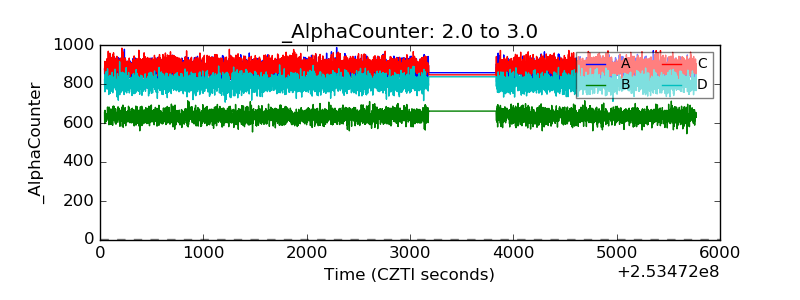 |
| _CPM_Rate | 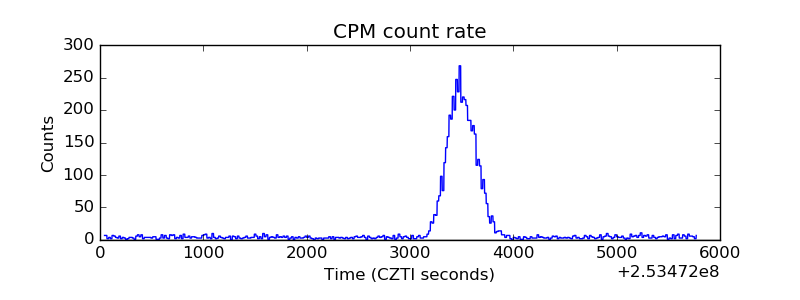 |
| CZT Counter | 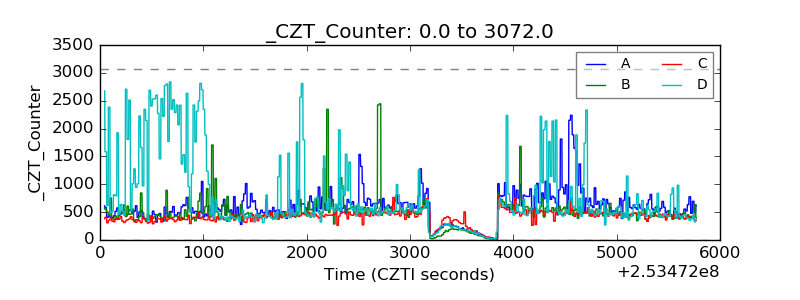 |
| +2.5 Volts monitor |  |
| +5 Volts monitor |  |
| _ROLL_ROT | 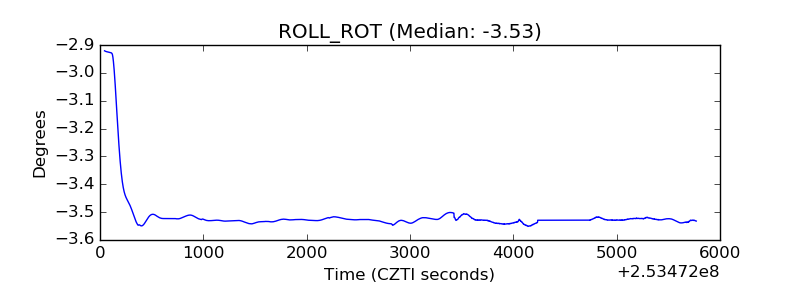 |
| _Roll_DEC | 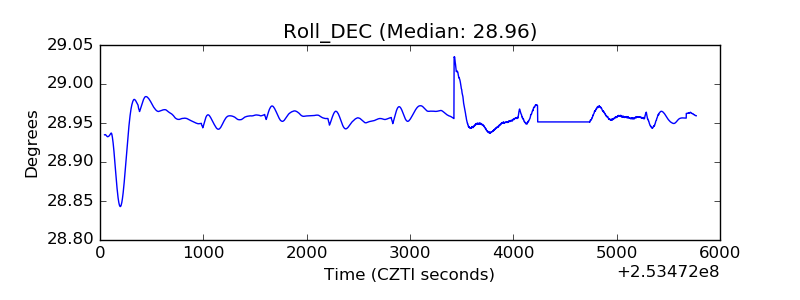 |
| _Roll_RA | 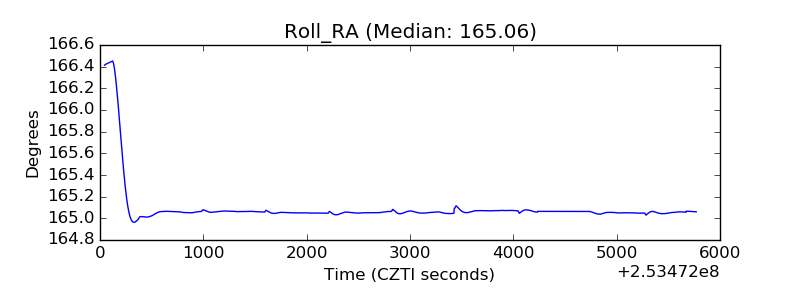 |
| Veto Counter | 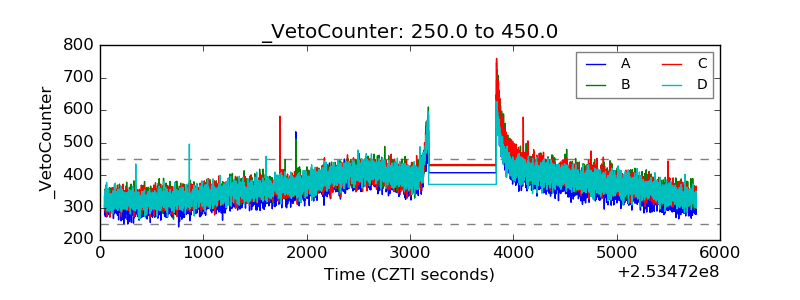 |