| Param | Original file | Final file |
|---|---|---|
| Filename | modeM0/AS1G08_083T02_9000001840_12399cztM0_level2.evt | modeM0/AS1G08_083T02_9000001840_12399cztM0_level2_quad_clean.evt |
| Size (bytes) | 868,026,240 | 163,923,840 |
| Size | 827.8 MB | 156.3 MB |
| Events in quadrant A | 7,479,806 | 1,043,953 |
| Events in quadrant B | 6,374,152 | 1,067,253 |
| Events in quadrant C | 5,044,791 | 1,058,804 |
| Events in quadrant D | 6,612,410 | 1,000,101 |
| Mode M9 | |||
|---|---|---|---|
| Quadrant | BADHDUFLAG | Total packets | Discarded packets |
| A | 0 | 18 | 0 |
| B | 0 | 18 | 0 |
| C | 0 | 18 | 0 |
| D | 0 | 18 | 0 |
| Mode SS | |||
|---|---|---|---|
| Quadrant | BADHDUFLAG | Total packets | Discarded packets |
| A | 0 | 234 | 0 |
| B | 0 | 234 | 0 |
| C | 0 | 234 | 0 |
| D | 0 | 234 | 0 |
| Mode M0 | |||
|---|---|---|---|
| Quadrant | BADHDUFLAG | Total packets | Discarded packets |
| A | 0 | 30220 | 3 |
| B | 0 | 26738 | 2 |
| C | 0 | 23300 | 2 |
| D | 0 | 27599 | 2 |
| Quadrant | Total seconds | Saturated seconds | Saturation percentage |
|---|---|---|---|
| A | 11486 | 252 | 2.193975% |
| B | 11486 | 248 | 2.159150% |
| C | 11486 | 25 | 0.217656% |
| D | 11486 | 246 | 2.141738% |
Noise dominated data is calculated using 1-second bins in cleaned event files. If a bin has >2000 counts, and if more than 50% of those come from <1% of pixels, then it is considered to be noise-dominated and hence unusable.
| Quadrant | # 1 sec bins | Bins with >0 counts | Bins with >2000 counts | High rate bins dominated by noise | Noise dominated (total time) | Noise dominated (detector-on time) | Marked lightcurve |
|---|---|---|---|---|---|---|---|
| A | 13327 | 11488 | 42 | 42 | 0.32% | 0.37% | 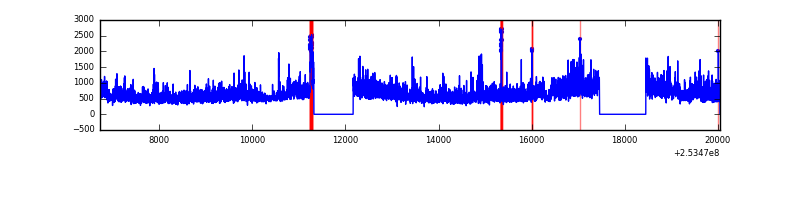 |
| B | 13327 | 11488 | 155 | 155 | 1.16% | 1.35% | 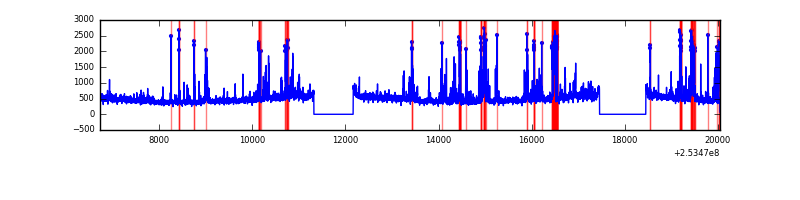 |
| C | 13327 | 11488 | 0 | 0 | 0.00% | 0.00% | 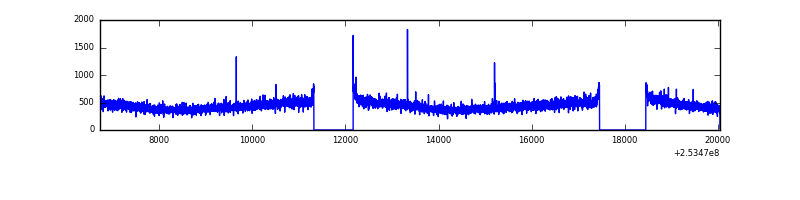 |
| D | 13327 | 11489 | 243 | 243 | 1.82% | 2.12% | 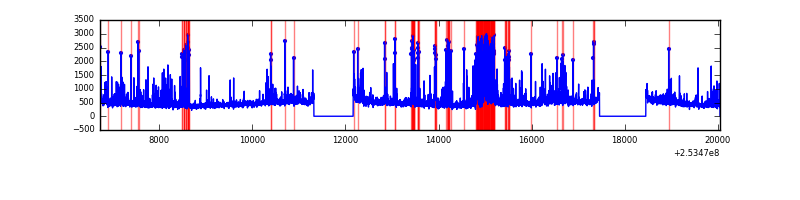 |
Top three noisy pixels from each quadrant. If the there are fewer than three noisy pixels in the level2.evt file, extra rows are filled as -1
| Pixel properties | Quadrant properties | ||||||
|---|---|---|---|---|---|---|---|
| Quadrant | DetID | PixID | Counts | Sigma | Mean | Median | Sigma |
| A | 1 | 162 | 595230 | 2225.42 | 1312 | 1286 | 266.9 |
| A | 13 | 251 | 406241 | 1517.31 | 1312 | 1286 | 266.9 |
| A | 1 | 178 | 341936 | 1276.37 | 1312 | 1286 | 266.9 |
| B | 4 | 239 | 945157 | 3738.05 | 1326 | 1294 | 252.5 |
| B | 0 | 230 | 91703 | 358.05 | 1326 | 1294 | 252.5 |
| B | 0 | 219 | 80558 | 313.92 | 1326 | 1294 | 252.5 |
| C | 8 | 112 | 10156 | 29.61 | 1290 | 1296 | 299.2 |
| C | 13 | 61 | 9408 | 27.11 | 1290 | 1296 | 299.2 |
| C | 14 | 234 | 5601 | 14.39 | 1290 | 1296 | 299.2 |
| D | 10 | 50 | 638246 | 2080.2 | 1270 | 1232 | 306.2 |
| D | 1 | 52 | 419869 | 1367.08 | 1270 | 1232 | 306.2 |
| D | 10 | 199 | 240168 | 780.26 | 1270 | 1232 | 306.2 |
Histogram calculated using DETX and DETY for each event in the final _common_clean file
| Quadrant A |  |
 |
Quadrant B |
|---|---|---|---|
| Quadrant D | 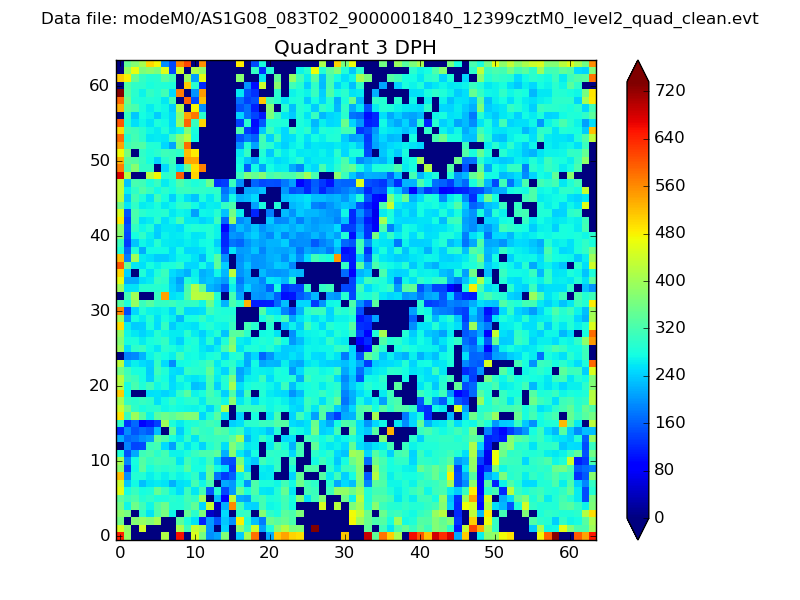 |
 |
Quadrant C |
| Plot type | Count rate plots | Images |
|---|---|---|
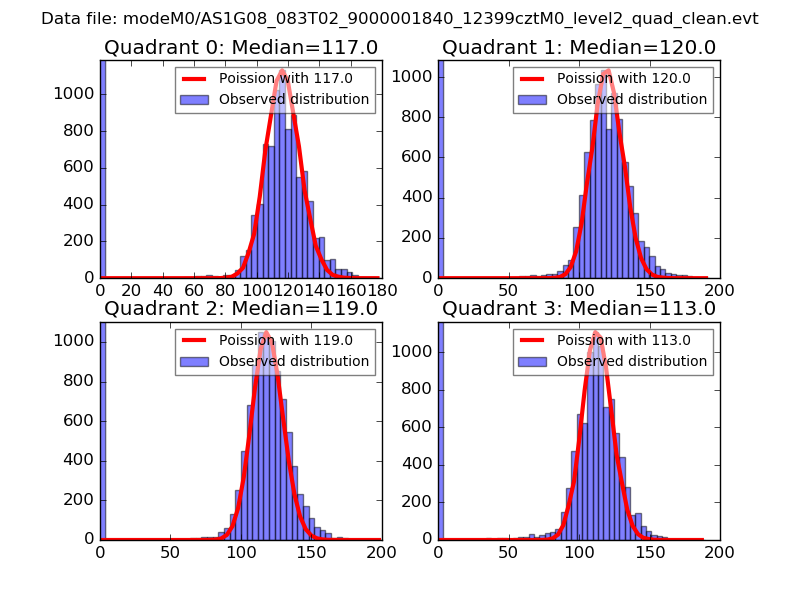
| Comparison with Poisson distribution Blue bars denote a histogram of data divided into 1 sec bins. Red curve is a Poisson curve with rate = median count rate of data. |
 |
 |
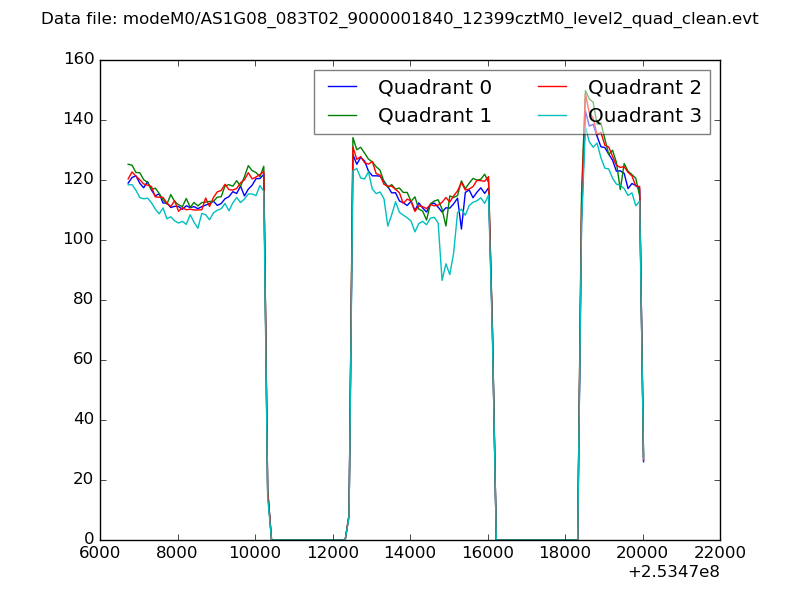
| Quadrant-wise count rates Data is divided into 100 sec bins |
 |
|
| Module-wise count rates for Quadrant A Data is divided into 100 sec bins |
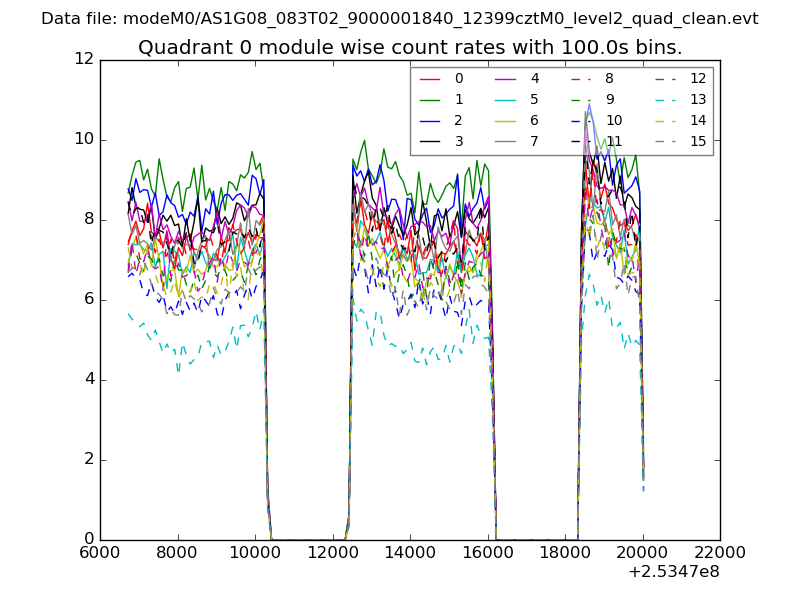 |
 |
| Module-wise count rates for Quadrant B Data is divided into 100 sec bins |
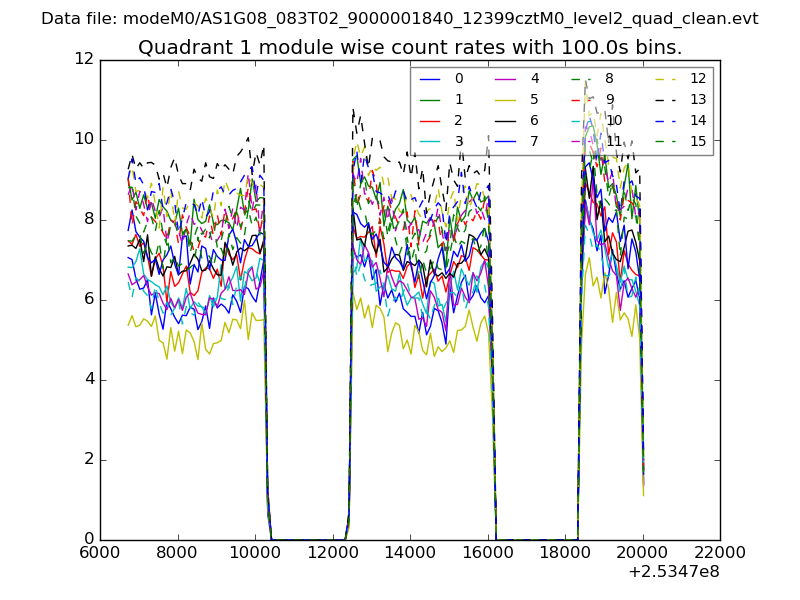 |
 |
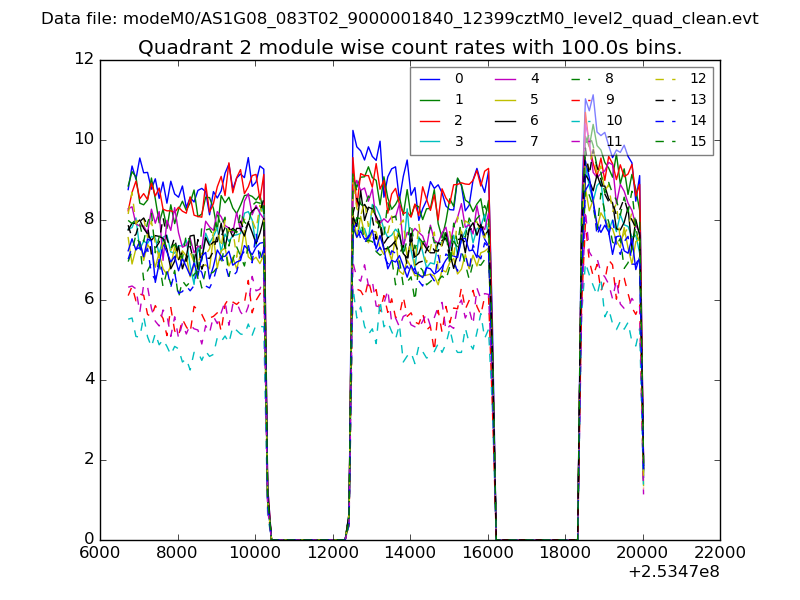
| Module-wise count rates for Quadrant C Data is divided into 100 sec bins |
 |
 |
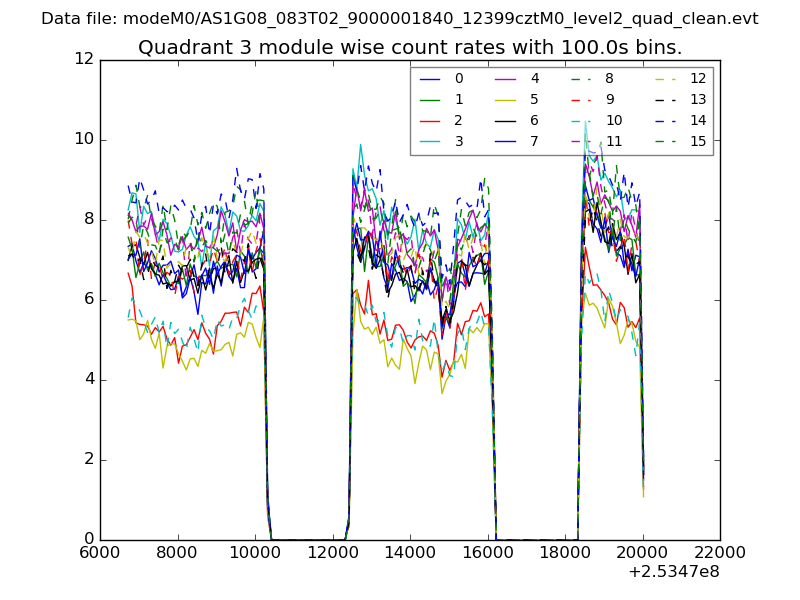
| Module-wise count rates for Quadrant D Data is divided into 100 sec bins |
 |
 |
| Parameter | Plot |
|---|---|
| CZT HV Monitor | 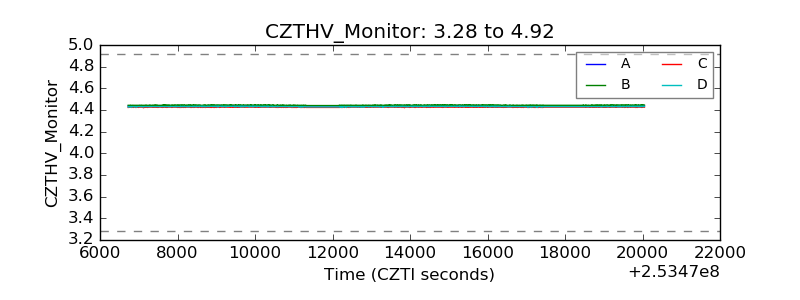 |
| D_VDD | 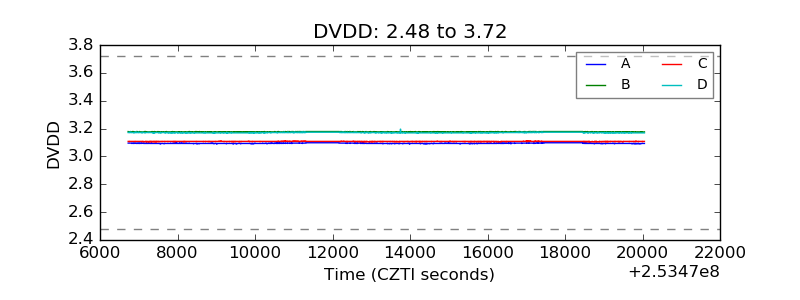 |
| Temperature 1 | 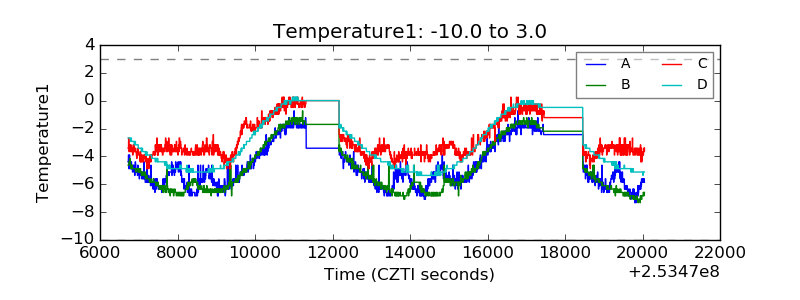 |
| Veto HV Monitor |  |
| Veto LLD | 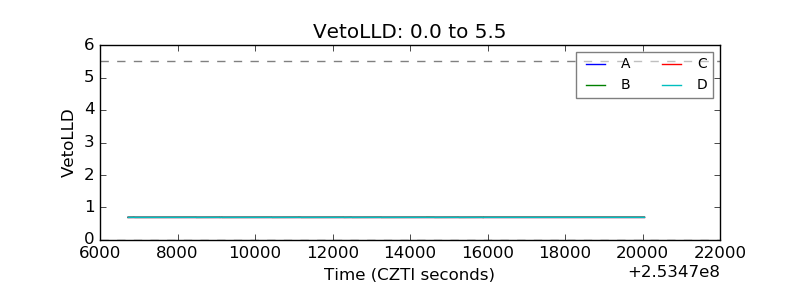 |
| Alpha Counter | 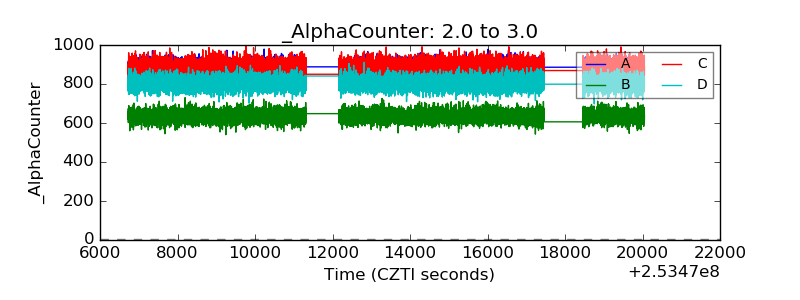 |
| _CPM_Rate | 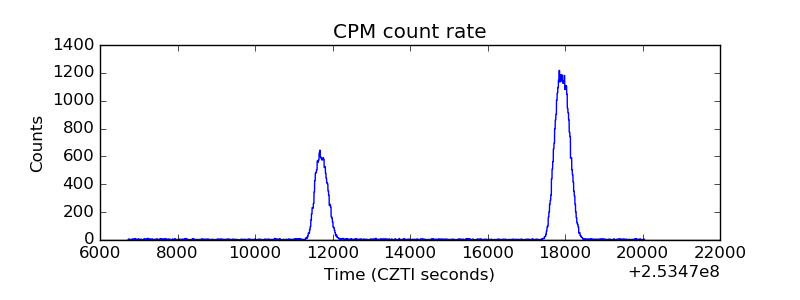 |
| CZT Counter |  |
| +2.5 Volts monitor |  |
| +5 Volts monitor |  |
| _ROLL_ROT | 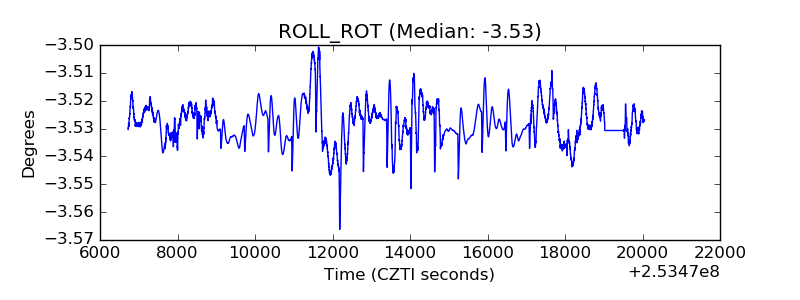 |
| _Roll_DEC | 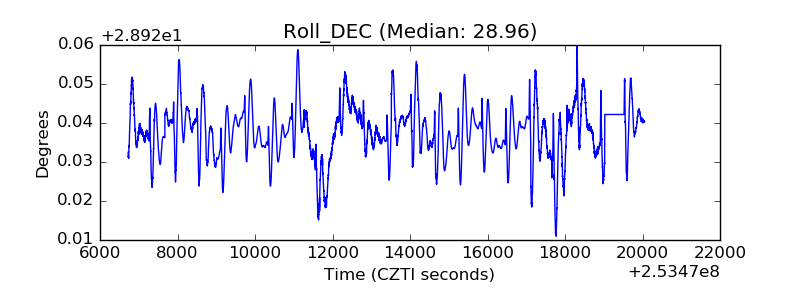 |
| _Roll_RA |  |
| Veto Counter | 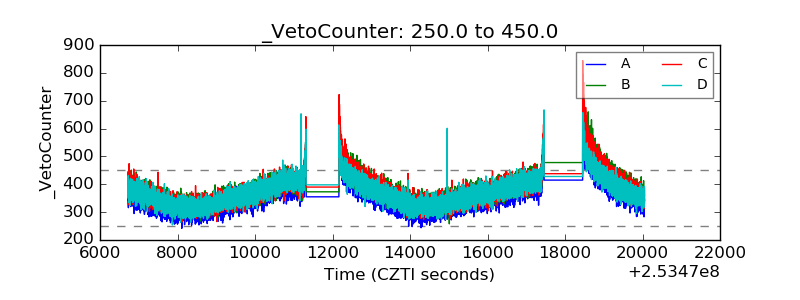 |