| Param | Original file | Final file |
|---|---|---|
| Filename | modeM0/AS1G08_083T02_9000001840_12401cztM0_level2.evt | modeM0/AS1G08_083T02_9000001840_12401cztM0_level2_quad_clean.evt |
| Size (bytes) | 521,700,480 | 97,168,320 |
| Size | 497.5 MB | 92.7 MB |
| Events in quadrant A | 4,782,865 | 614,471 |
| Events in quadrant B | 3,863,456 | 636,468 |
| Events in quadrant C | 3,050,703 | 630,439 |
| Events in quadrant D | 3,647,038 | 593,003 |
| Mode M9 | |||
|---|---|---|---|
| Quadrant | BADHDUFLAG | Total packets | Discarded packets |
| A | 0 | 21 | 0 |
| B | 0 | 21 | 0 |
| C | 0 | 21 | 0 |
| D | 0 | 21 | 0 |
| Mode SS | |||
|---|---|---|---|
| Quadrant | BADHDUFLAG | Total packets | Discarded packets |
| A | 0 | 136 | 0 |
| B | 0 | 136 | 0 |
| C | 0 | 136 | 0 |
| D | 0 | 136 | 0 |
| Mode M0 | |||
|---|---|---|---|
| Quadrant | BADHDUFLAG | Total packets | Discarded packets |
| A | 0 | 18984 | 3 |
| B | 0 | 15952 | 2 |
| C | 0 | 13765 | 2 |
| D | 0 | 15618 | 2 |
| Quadrant | Total seconds | Saturated seconds | Saturation percentage |
|---|---|---|---|
| A | 6722 | 200 | 2.975305% |
| B | 6722 | 156 | 2.320738% |
| C | 6722 | 14 | 0.208271% |
| D | 6722 | 84 | 1.249628% |
Noise dominated data is calculated using 1-second bins in cleaned event files. If a bin has >2000 counts, and if more than 50% of those come from <1% of pixels, then it is considered to be noise-dominated and hence unusable.
| Quadrant | # 1 sec bins | Bins with >0 counts | Bins with >2000 counts | High rate bins dominated by noise | Noise dominated (total time) | Noise dominated (detector-on time) | Marked lightcurve |
|---|---|---|---|---|---|---|---|
| A | 8843 | 6725 | 31 | 31 | 0.35% | 0.46% | 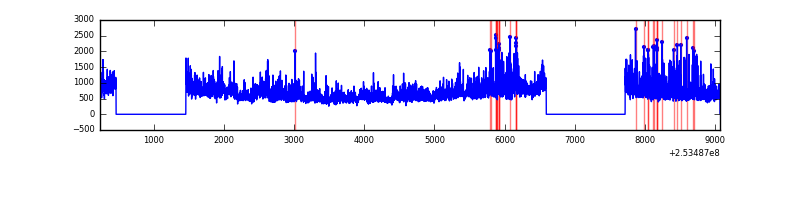 |
| B | 8843 | 6724 | 85 | 85 | 0.96% | 1.26% | 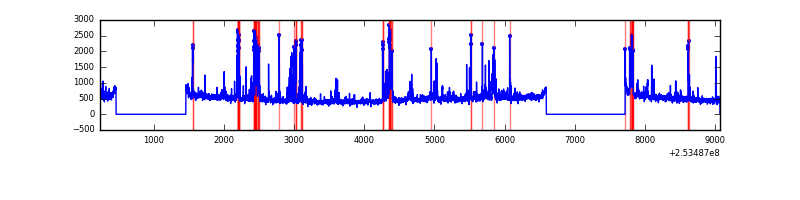 |
| C | 8843 | 6725 | 0 | 0 | 0.00% | 0.00% | 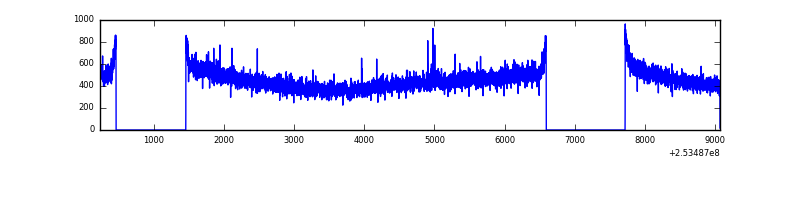 |
| D | 8843 | 6725 | 76 | 76 | 0.86% | 1.13% | 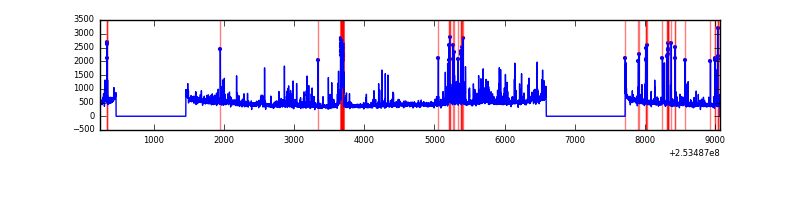 |
Top three noisy pixels from each quadrant. If the there are fewer than three noisy pixels in the level2.evt file, extra rows are filled as -1
| Pixel properties | Quadrant properties | ||||||
|---|---|---|---|---|---|---|---|
| Quadrant | DetID | PixID | Counts | Sigma | Mean | Median | Sigma |
| A | 13 | 251 | 666251 | 4099.73 | 795 | 776 | 162.3 |
| A | 1 | 162 | 324265 | 1992.89 | 795 | 776 | 162.3 |
| A | 1 | 178 | 191578 | 1175.46 | 795 | 776 | 162.3 |
| B | 4 | 239 | 535047 | 3480.67 | 806 | 785 | 153.5 |
| B | 0 | 230 | 74239 | 478.55 | 806 | 785 | 153.5 |
| B | 0 | 219 | 46789 | 299.71 | 806 | 785 | 153.5 |
| C | 13 | 61 | 5688 | 26.95 | 781 | 782 | 182.1 |
| C | 14 | 234 | 4143 | 18.46 | 781 | 782 | 182.1 |
| C | 15 | 208 | 2823 | 11.21 | 781 | 782 | 182.1 |
| D | 10 | 199 | 168307 | 908.31 | 767 | 747 | 184.5 |
| D | 14 | 34 | 142273 | 767.18 | 767 | 747 | 184.5 |
| D | 10 | 50 | 109448 | 589.25 | 767 | 747 | 184.5 |
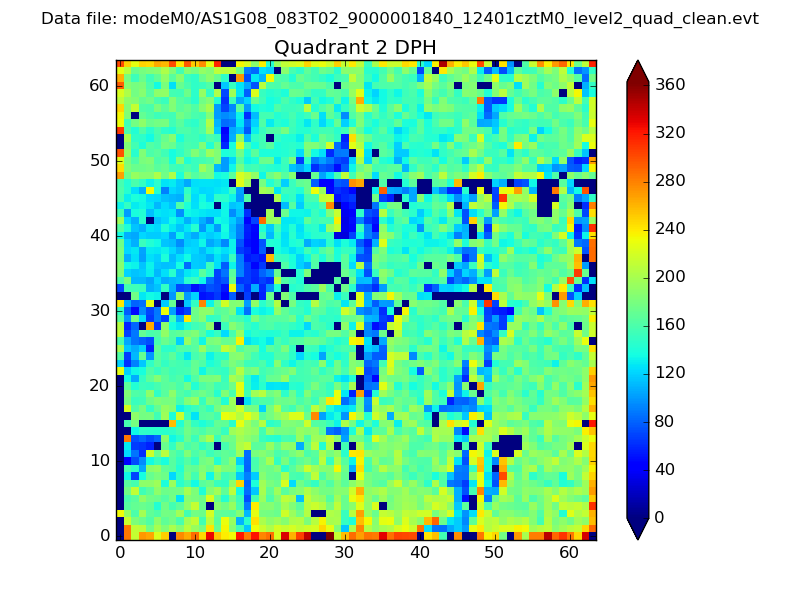
Histogram calculated using DETX and DETY for each event in the final _common_clean file
| Quadrant A | 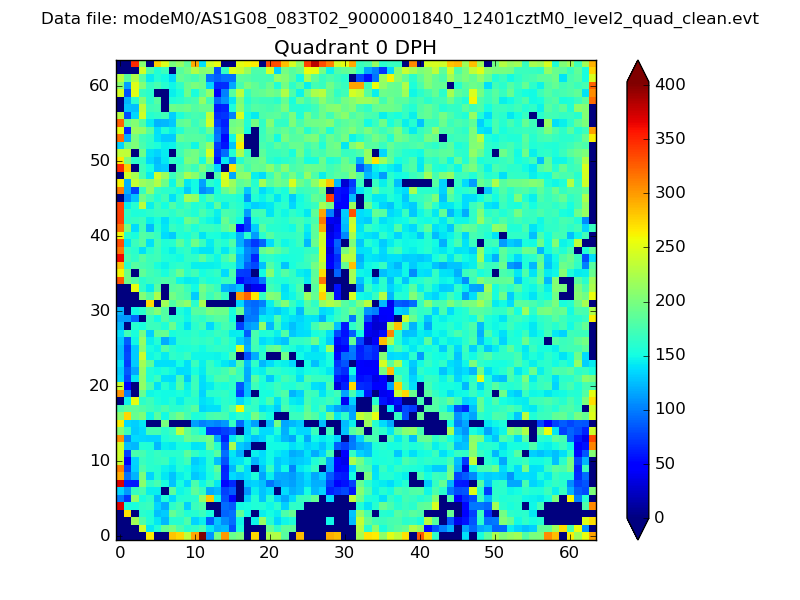 |
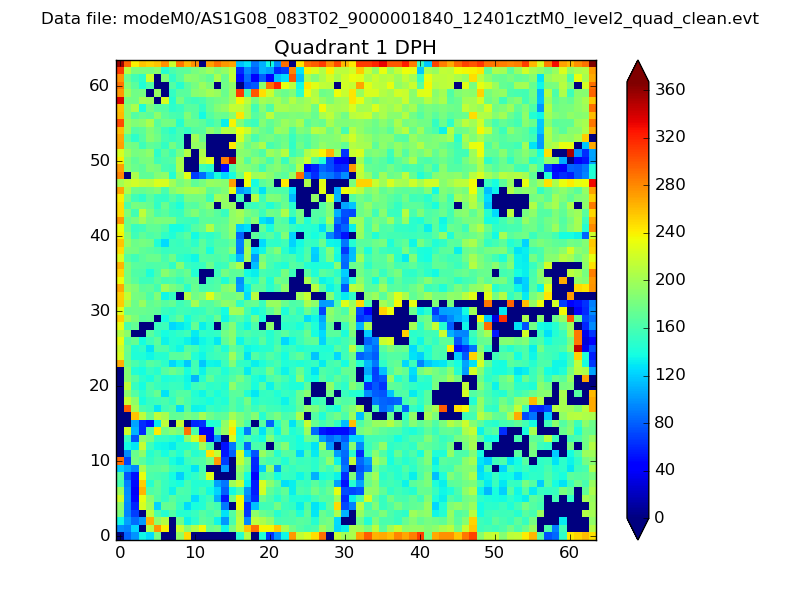 |
Quadrant B |
|---|---|---|---|
| Quadrant D | 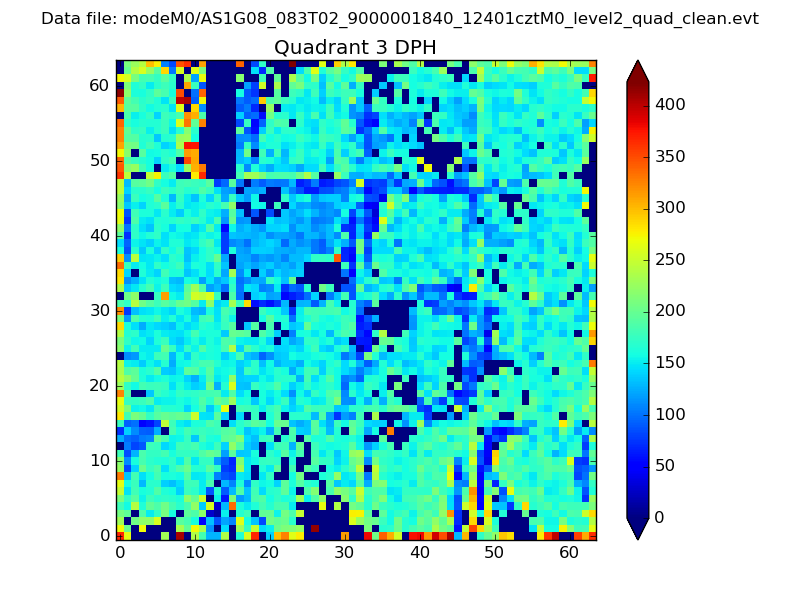 |
 |
Quadrant C |
| Plot type | Count rate plots | Images |
|---|---|---|
| Comparison with Poisson distribution Blue bars denote a histogram of data divided into 1 sec bins. Red curve is a Poisson curve with rate = median count rate of data. |
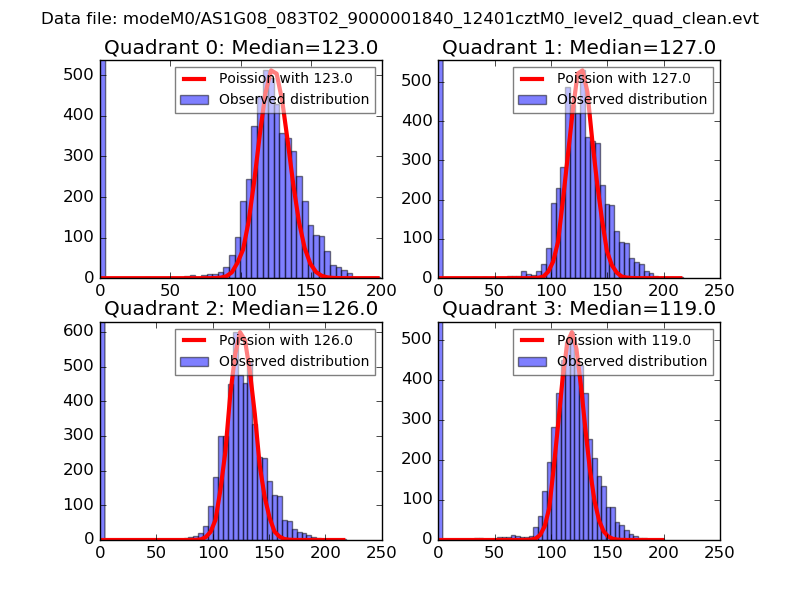 |
 |
| Quadrant-wise count rates Data is divided into 100 sec bins |
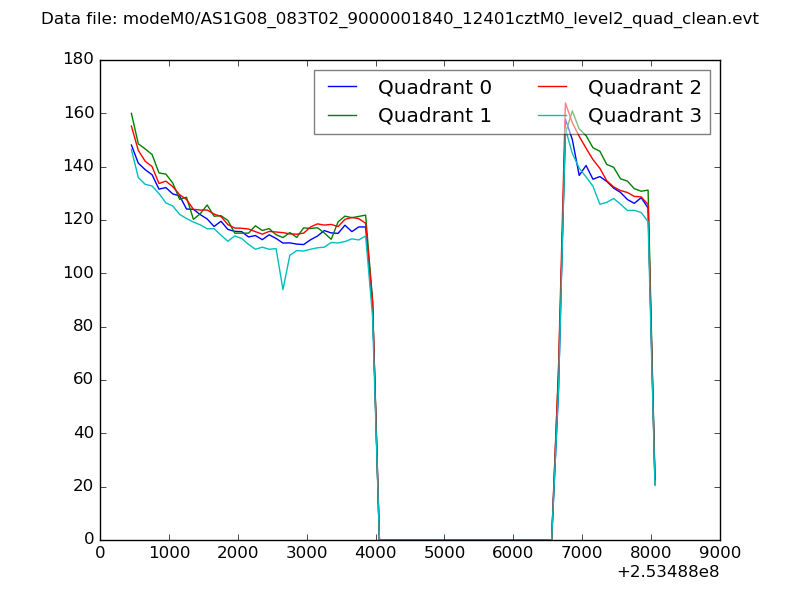 |
|
| Module-wise count rates for Quadrant A Data is divided into 100 sec bins |
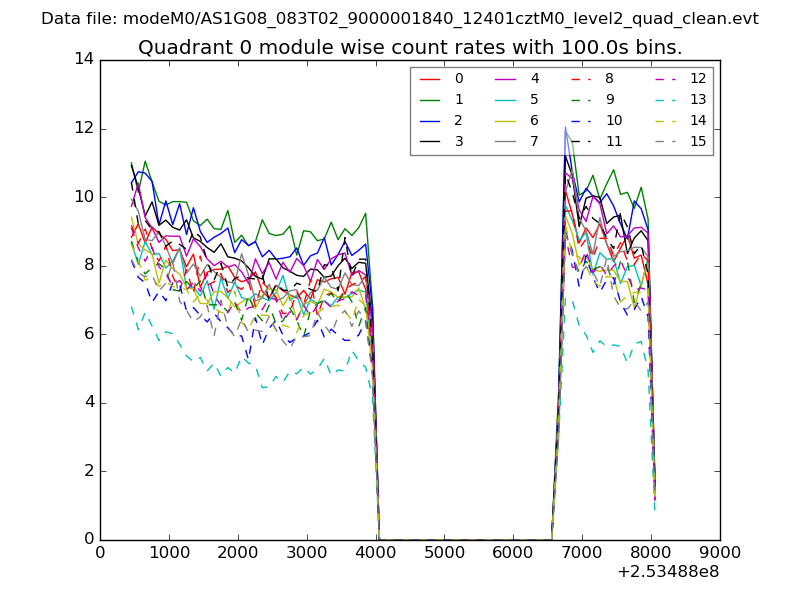 |
 |
| Module-wise count rates for Quadrant B Data is divided into 100 sec bins |
 |
 |
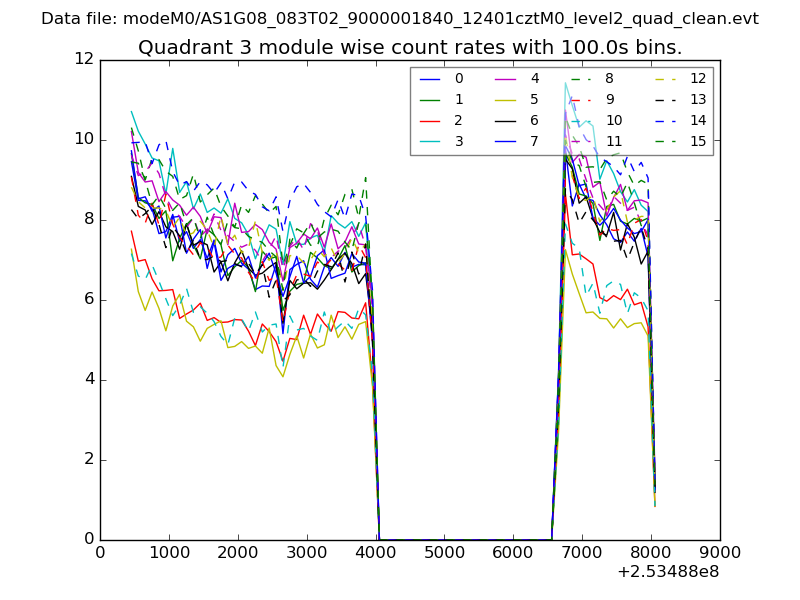
| Module-wise count rates for Quadrant C Data is divided into 100 sec bins |
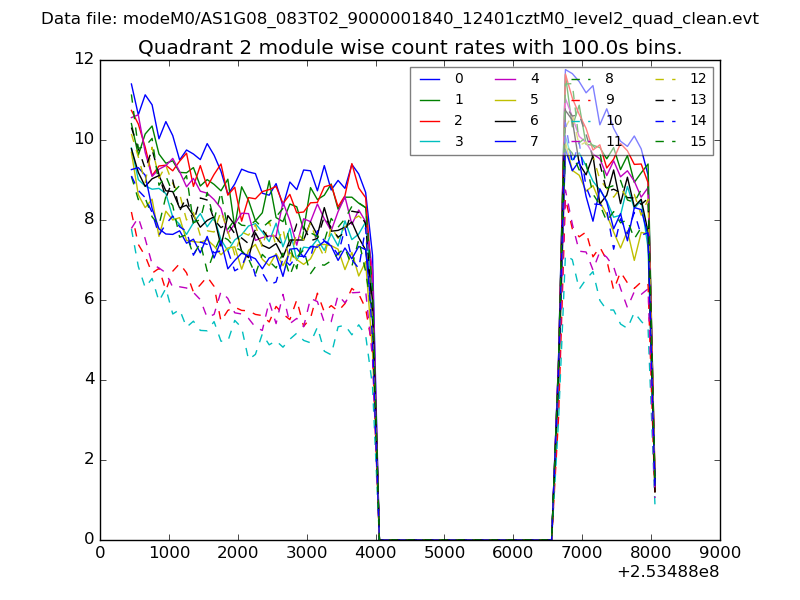 |
 |
| Module-wise count rates for Quadrant D Data is divided into 100 sec bins |
 |
 |
| Parameter | Plot |
|---|---|
| CZT HV Monitor | 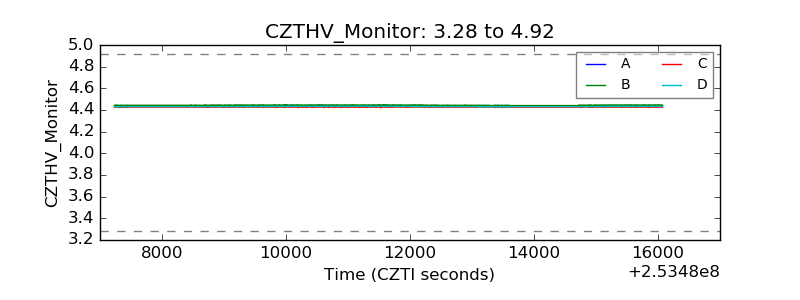 |
| D_VDD | 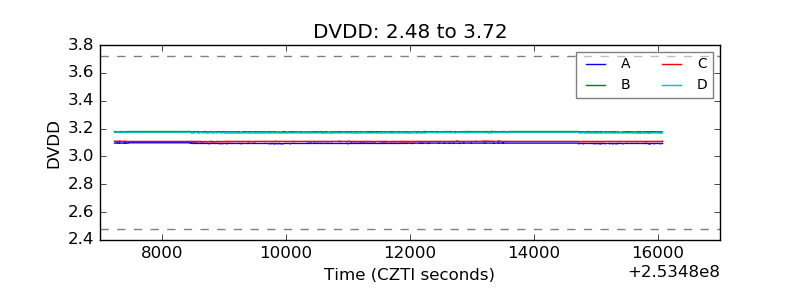 |
| Temperature 1 | 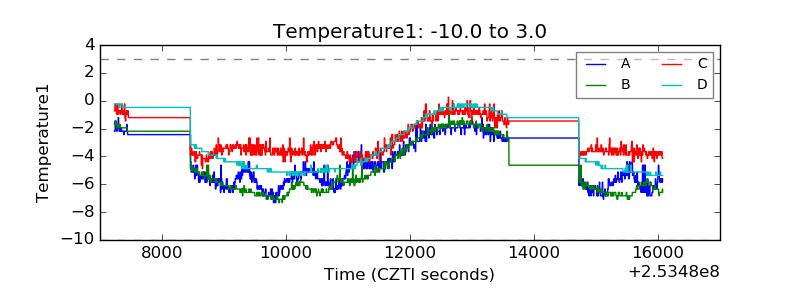 |
| Veto HV Monitor | 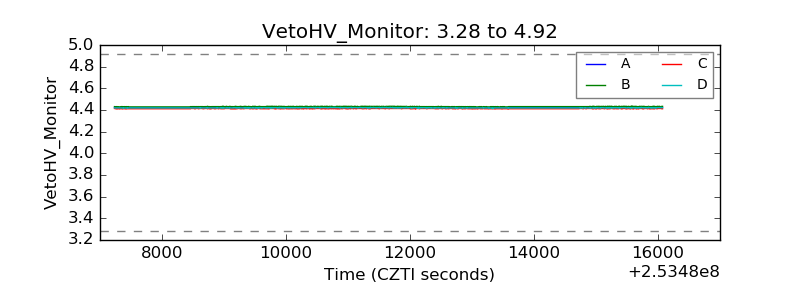 |
| Veto LLD | 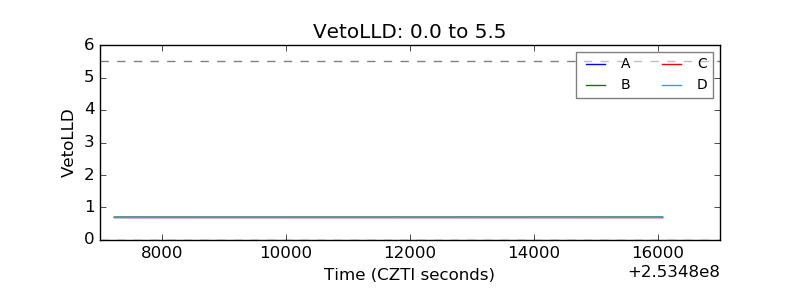 |
| Alpha Counter | 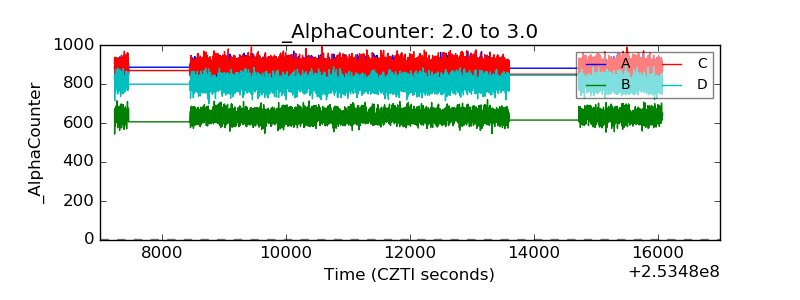 |
| _CPM_Rate | 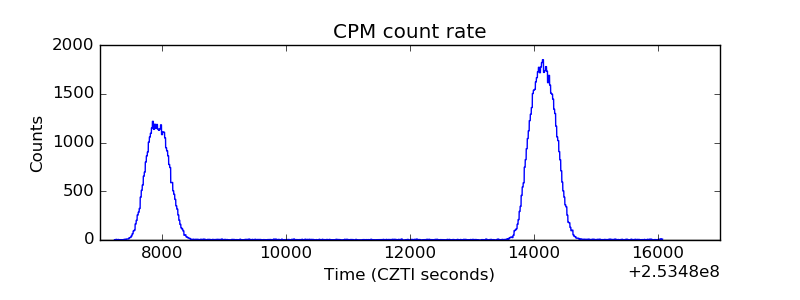 |
| CZT Counter | 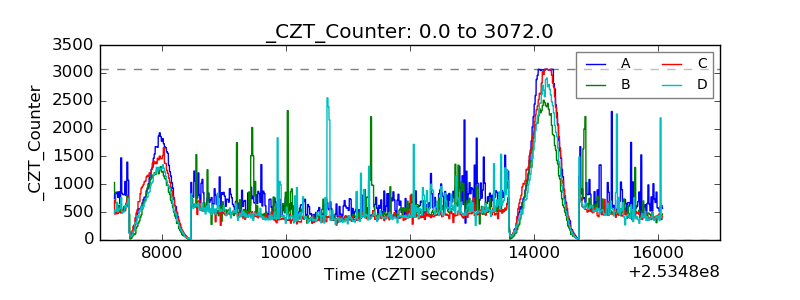 |
| +2.5 Volts monitor |  |
| +5 Volts monitor | 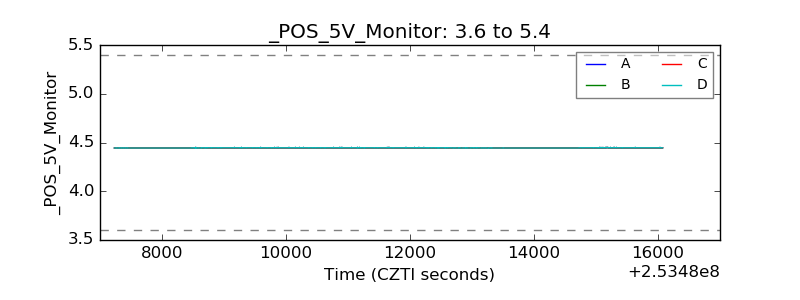 |
| _ROLL_ROT | 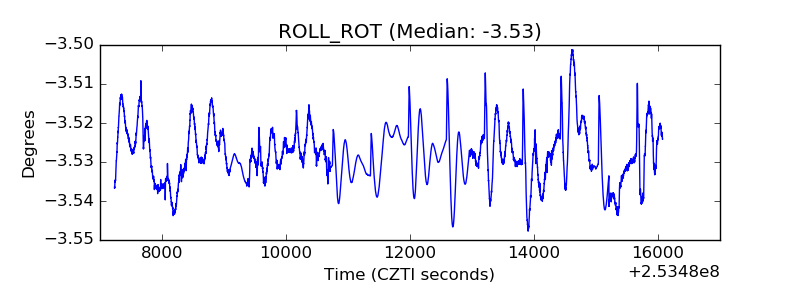 |
| _Roll_DEC | 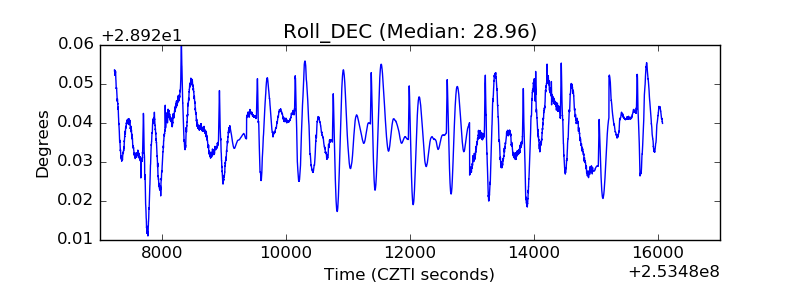 |
| _Roll_RA | 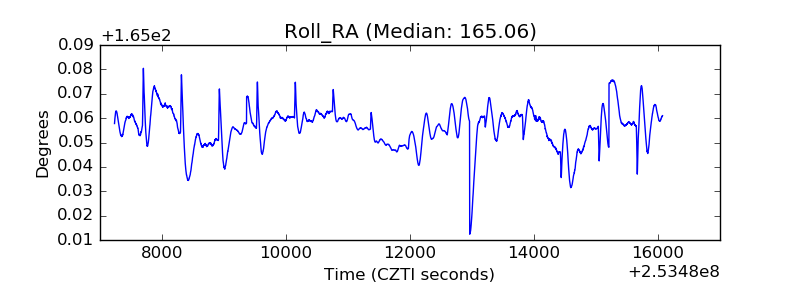 |
| Veto Counter | 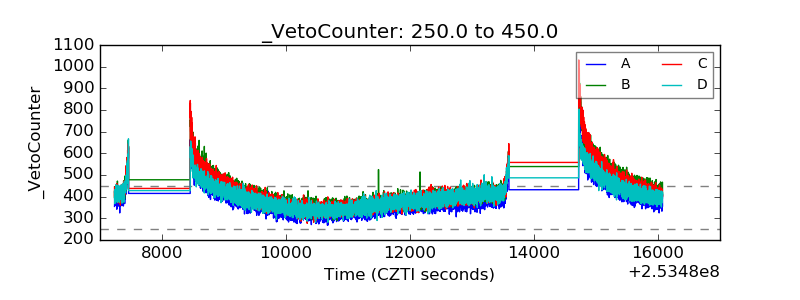 |