| Param | Original file | Final file |
|---|---|---|
| Filename | modeM0/AS1G08_083T02_9000001840_12403cztM0_level2.evt | modeM0/AS1G08_083T02_9000001840_12403cztM0_level2_quad_clean.evt |
| Size (bytes) | 1,705,109,760 | 298,336,320 |
| Size | 1.6 GB | 284.5 MB |
| Events in quadrant A | 15,582,169 | 1,873,484 |
| Events in quadrant B | 12,249,720 | 1,940,909 |
| Events in quadrant C | 10,012,299 | 1,909,415 |
| Events in quadrant D | 12,303,762 | 1,790,421 |
| Mode M9 | |||
|---|---|---|---|
| Quadrant | BADHDUFLAG | Total packets | Discarded packets |
| A | 0 | 46 | 0 |
| B | 0 | 46 | 0 |
| C | 0 | 46 | 0 |
| D | 0 | 46 | 0 |
| Mode SS | |||
|---|---|---|---|
| Quadrant | BADHDUFLAG | Total packets | Discarded packets |
| A | 0 | 450 | 0 |
| B | 0 | 450 | 0 |
| C | 0 | 450 | 0 |
| D | 0 | 450 | 0 |
| Mode M0 | |||
|---|---|---|---|
| Quadrant | BADHDUFLAG | Total packets | Discarded packets |
| A | 0 | 61918 | 6 |
| B | 0 | 50868 | 5 |
| C | 0 | 45166 | 5 |
| D | 0 | 51679 | 5 |
| Quadrant | Total seconds | Saturated seconds | Saturation percentage |
|---|---|---|---|
| A | 22106 | 576 | 2.605627% |
| B | 22106 | 396 | 1.791369% |
| C | 22106 | 49 | 0.221659% |
| D | 22106 | 357 | 1.614946% |
Noise dominated data is calculated using 1-second bins in cleaned event files. If a bin has >2000 counts, and if more than 50% of those come from <1% of pixels, then it is considered to be noise-dominated and hence unusable.
| Quadrant | # 1 sec bins | Bins with >0 counts | Bins with >2000 counts | High rate bins dominated by noise | Noise dominated (total time) | Noise dominated (detector-on time) | Marked lightcurve |
|---|---|---|---|---|---|---|---|
| A | 26747 | 22110 | 167 | 167 | 0.62% | 0.76% | 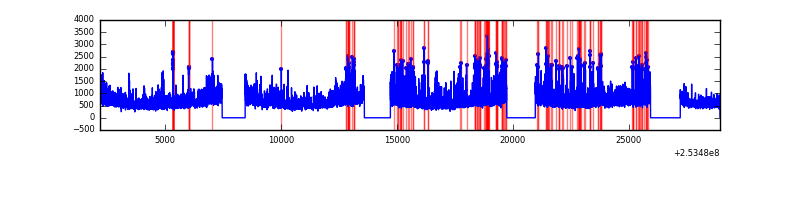 |
| B | 26747 | 22109 | 237 | 237 | 0.89% | 1.07% | 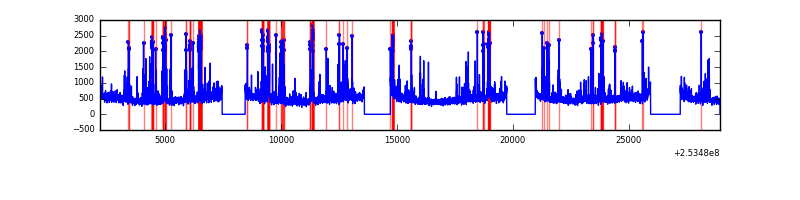 |
| C | 26747 | 22111 | 6 | 6 | 0.02% | 0.03% | 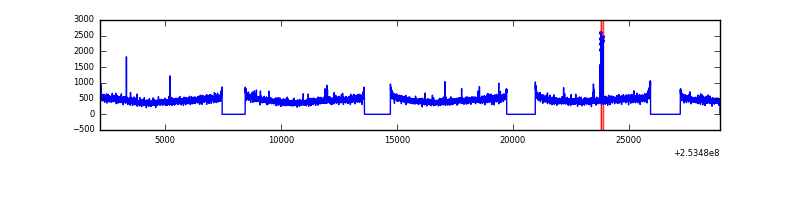 |
| D | 26747 | 22111 | 355 | 355 | 1.33% | 1.61% | 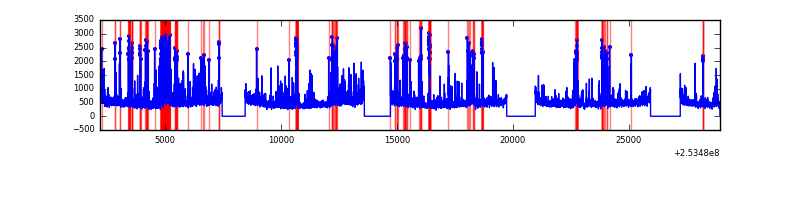 |
Top three noisy pixels from each quadrant. If the there are fewer than three noisy pixels in the level2.evt file, extra rows are filled as -1
| Pixel properties | Quadrant properties | ||||||
|---|---|---|---|---|---|---|---|
| Quadrant | DetID | PixID | Counts | Sigma | Mean | Median | Sigma |
| A | 13 | 251 | 2165190 | 4123.75 | 2609 | 2562 | 524.4 |
| A | 1 | 162 | 1079918 | 2054.33 | 2609 | 2562 | 524.4 |
| A | 1 | 178 | 626888 | 1190.48 | 2609 | 2562 | 524.4 |
| B | 4 | 239 | 1511419 | 3065.45 | 2637 | 2579 | 492.2 |
| B | 0 | 219 | 120799 | 240.18 | 2637 | 2579 | 492.2 |
| B | 0 | 230 | 108042 | 214.26 | 2637 | 2579 | 492.2 |
| C | 15 | 208 | 45069 | 72.39 | 2554 | 2567 | 587.1 |
| C | 13 | 61 | 18919 | 27.85 | 2554 | 2567 | 587.1 |
| C | 14 | 234 | 10783 | 13.99 | 2554 | 2567 | 587.1 |
| D | 10 | 50 | 830542 | 1385.09 | 2519 | 2449 | 597.9 |
| D | 10 | 199 | 631900 | 1052.84 | 2519 | 2449 | 597.9 |
| D | 1 | 52 | 403602 | 670.98 | 2519 | 2449 | 597.9 |
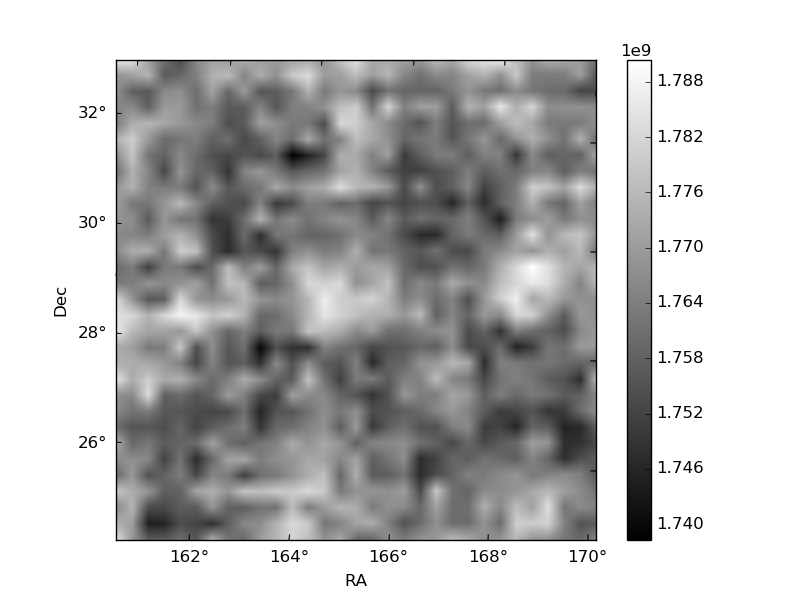
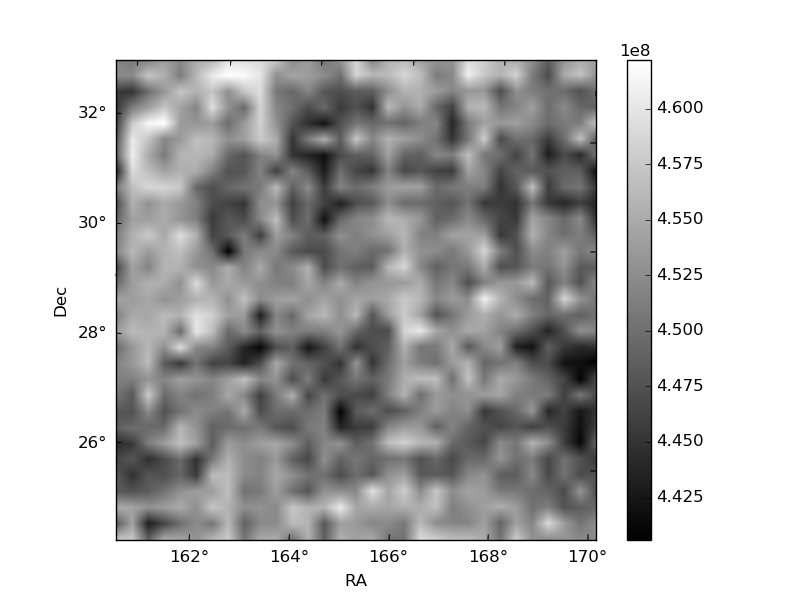
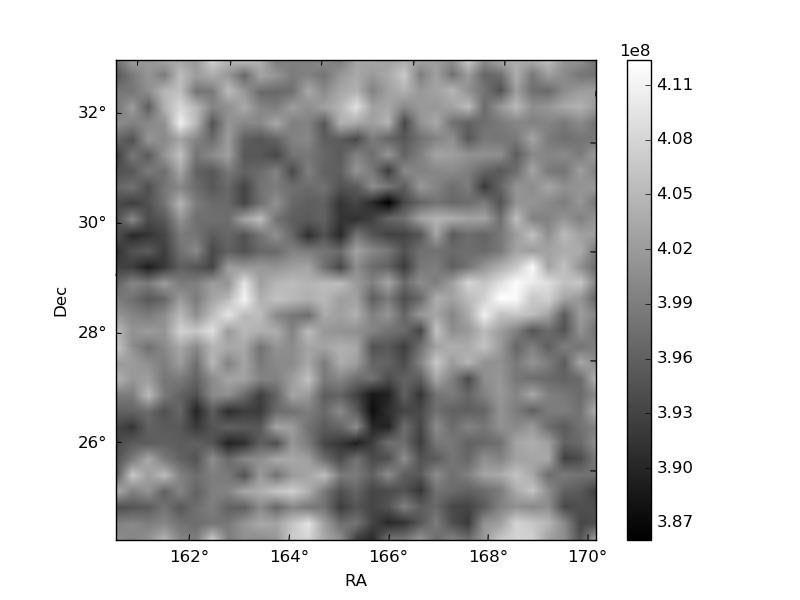
Histogram calculated using DETX and DETY for each event in the final _common_clean file
| Quadrant A | 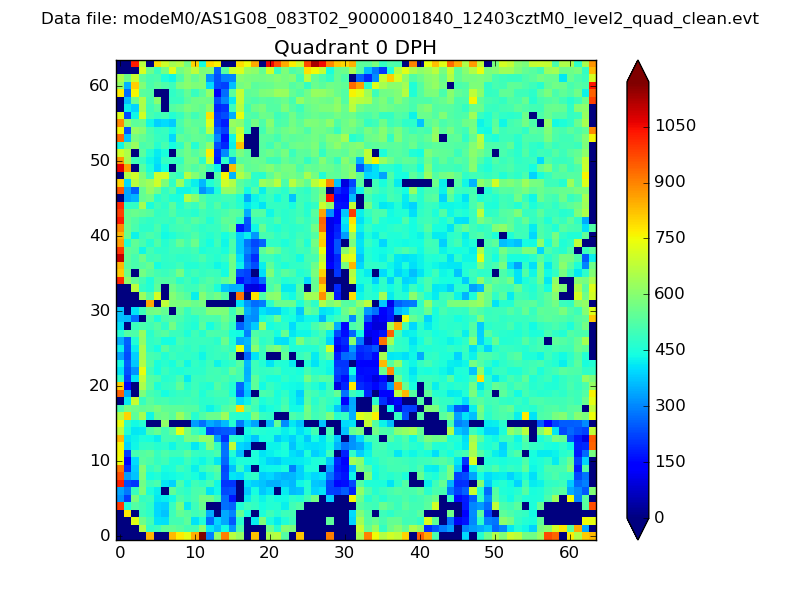 |
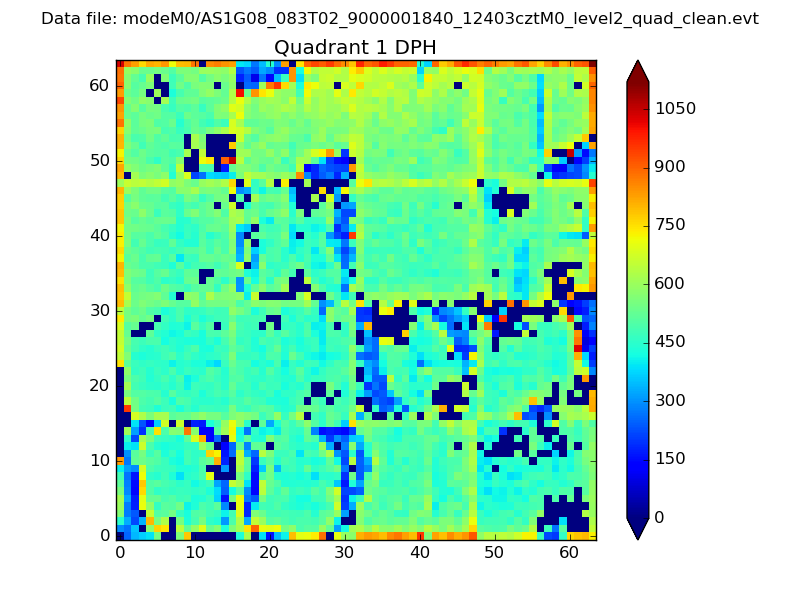 |
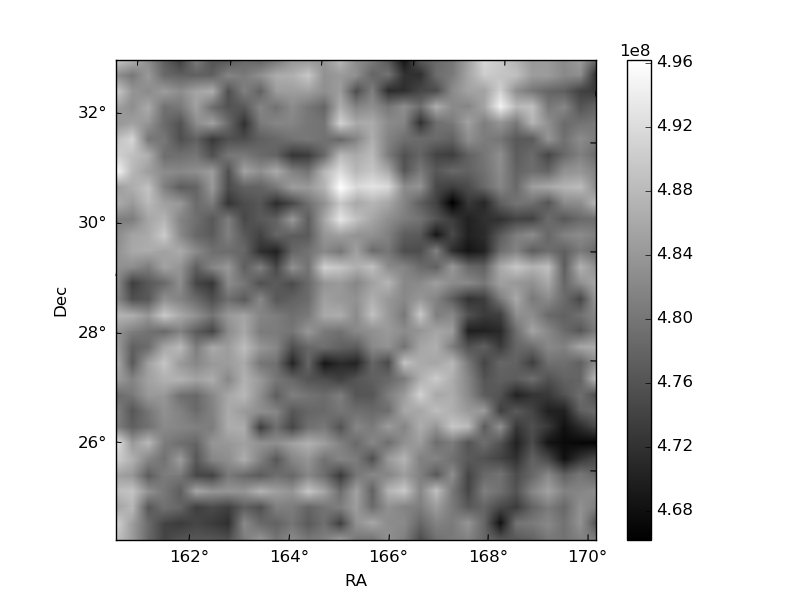
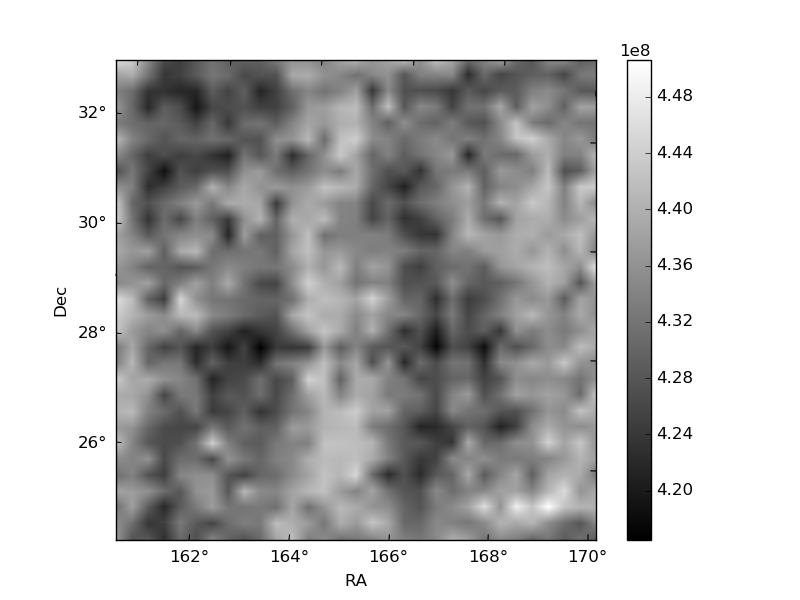
Quadrant B |
|---|---|---|---|
| Quadrant D | 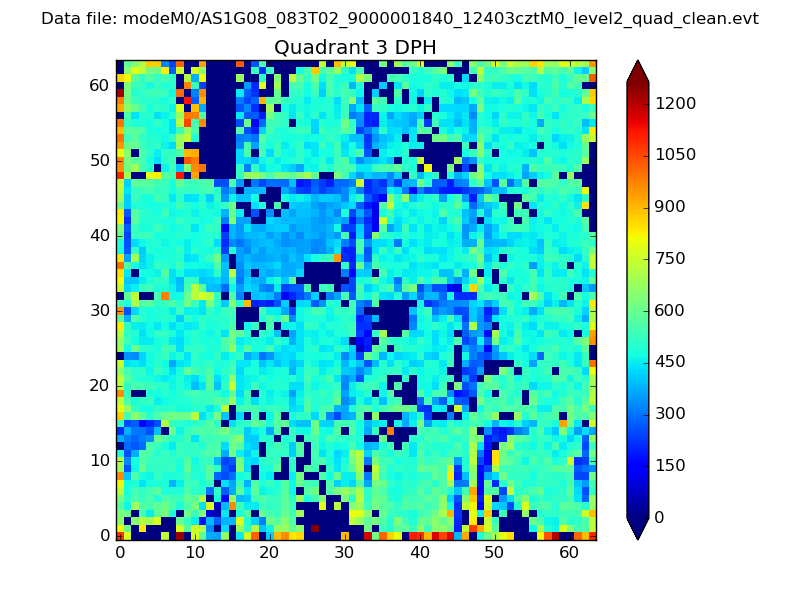 |
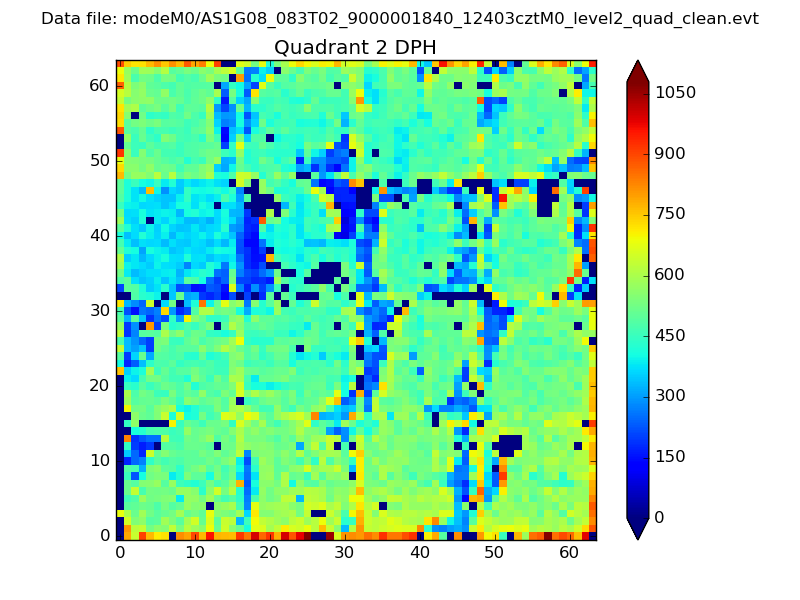 |
Quadrant C |
| Plot type | Count rate plots | Images |
|---|---|---|
| Comparison with Poisson distribution Blue bars denote a histogram of data divided into 1 sec bins. Red curve is a Poisson curve with rate = median count rate of data. |
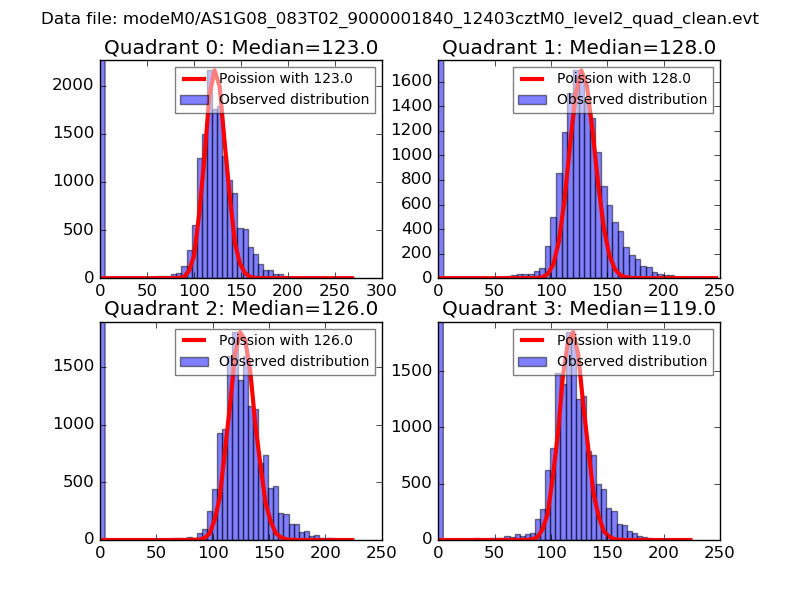 |
 |
| Quadrant-wise count rates Data is divided into 100 sec bins |
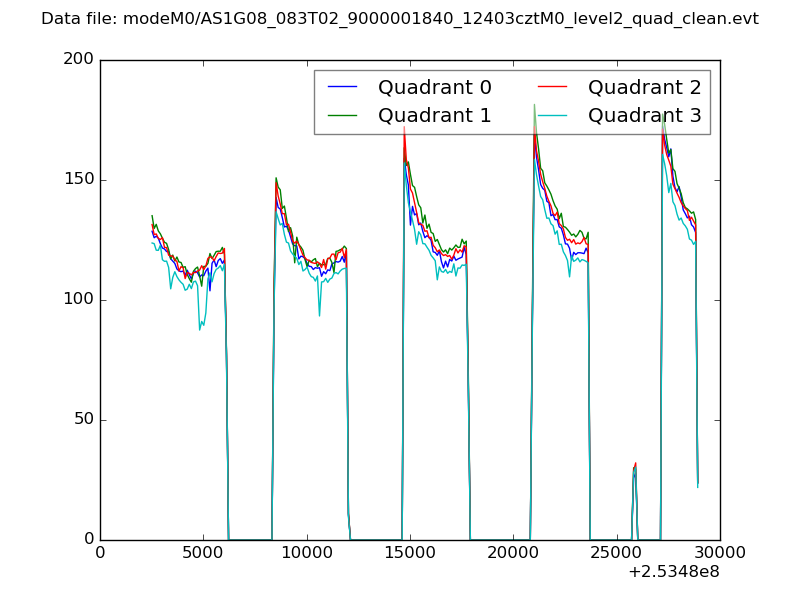 |
|
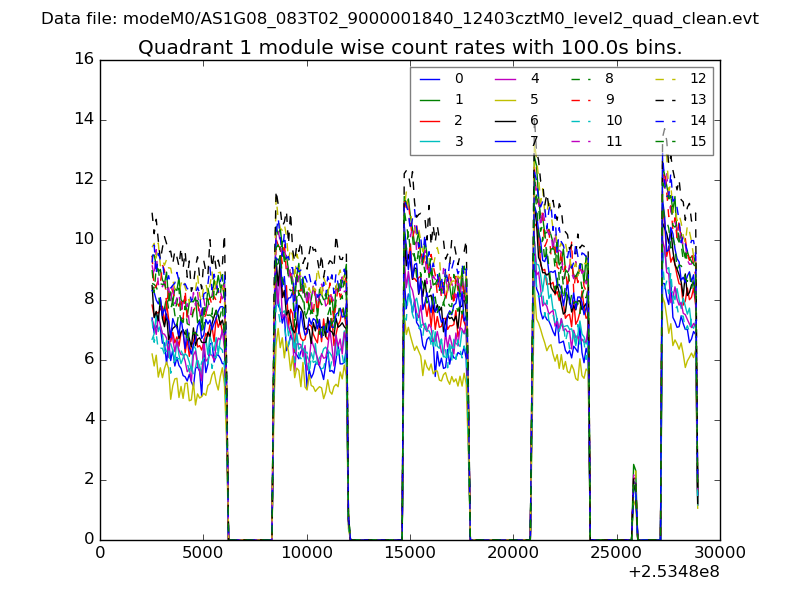
| Module-wise count rates for Quadrant A Data is divided into 100 sec bins |
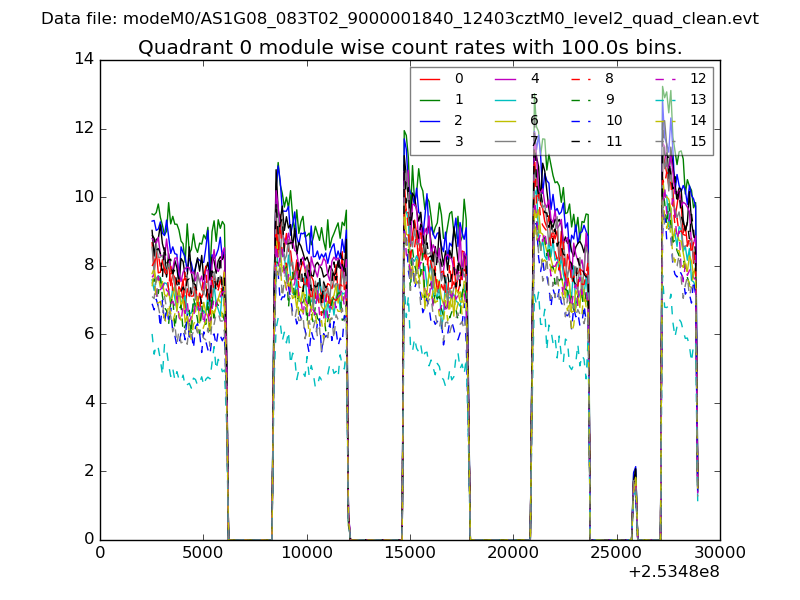 |
 |
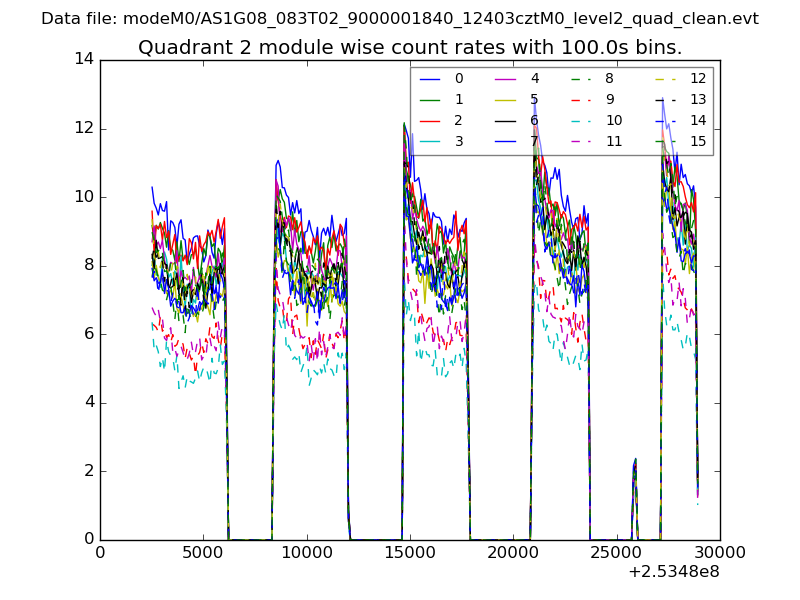
| Module-wise count rates for Quadrant B Data is divided into 100 sec bins |
 |
 |
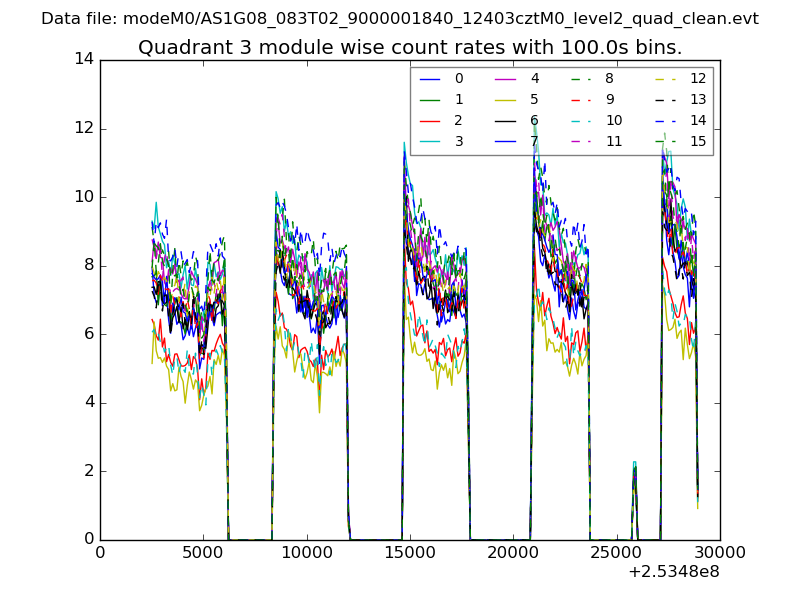
| Module-wise count rates for Quadrant C Data is divided into 100 sec bins |
 |
 |
| Module-wise count rates for Quadrant D Data is divided into 100 sec bins |
 |
 |
| Parameter | Plot |
|---|---|
| CZT HV Monitor | 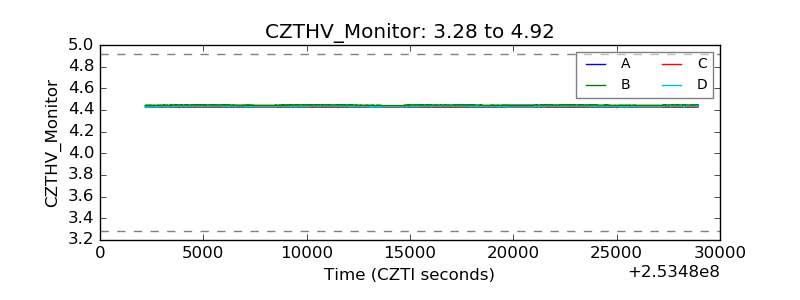 |
| D_VDD | 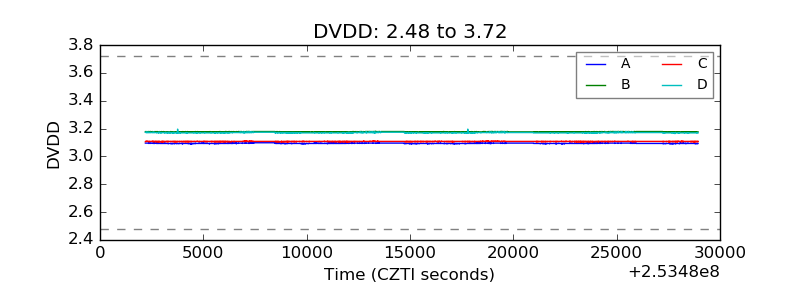 |
| Temperature 1 | 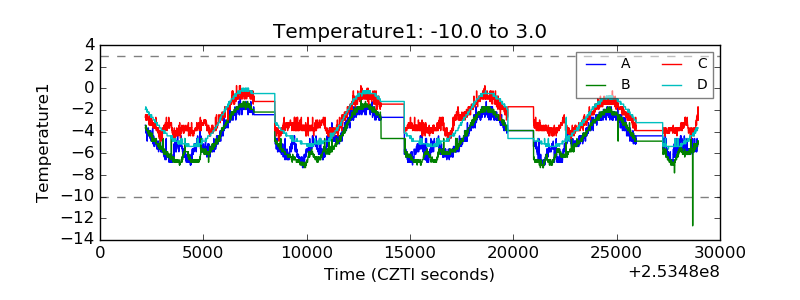 |
| Veto HV Monitor | 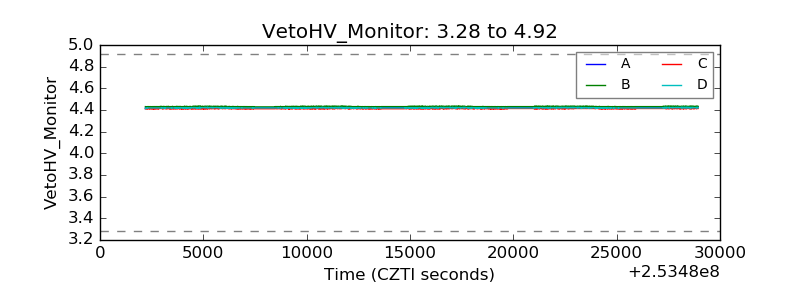 |
| Veto LLD | 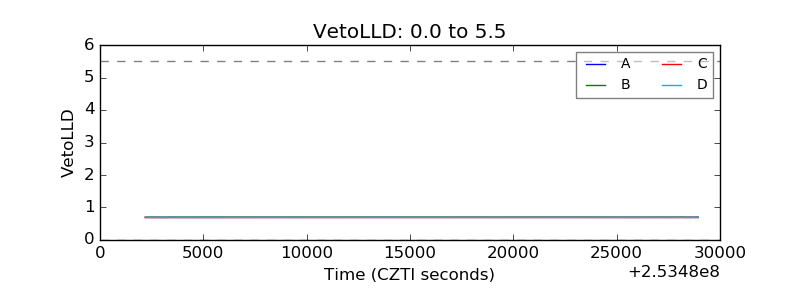 |
| Alpha Counter | 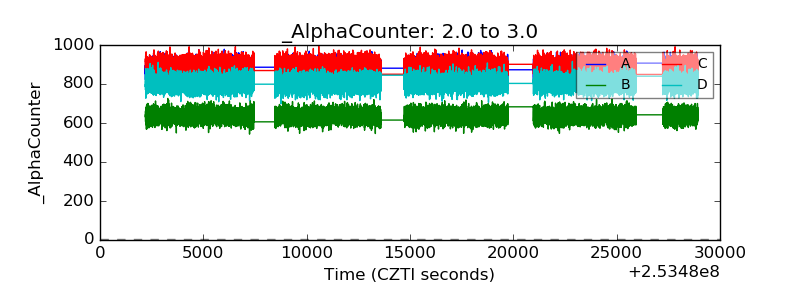 |
| _CPM_Rate | 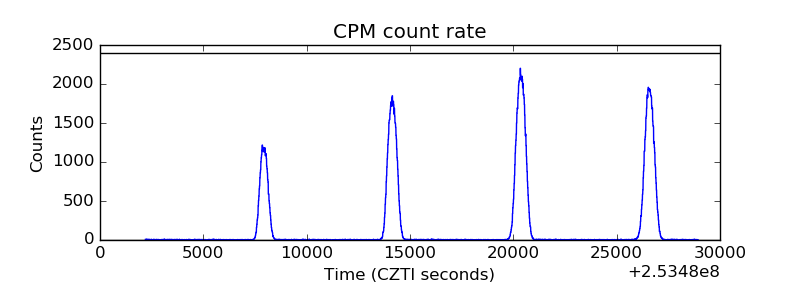 |
| CZT Counter | 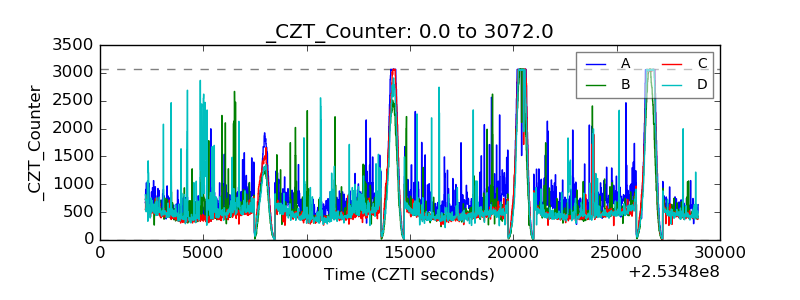 |
| +2.5 Volts monitor |  |
| +5 Volts monitor |  |
| _ROLL_ROT | 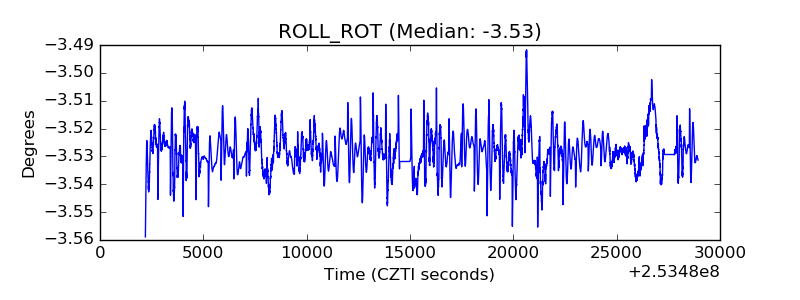 |
| _Roll_DEC | 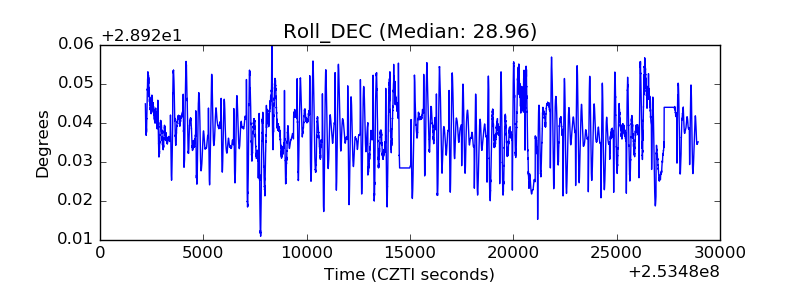 |
| _Roll_RA | 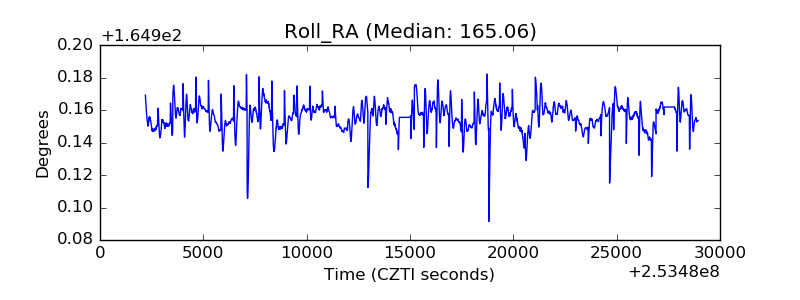 |
| Veto Counter | 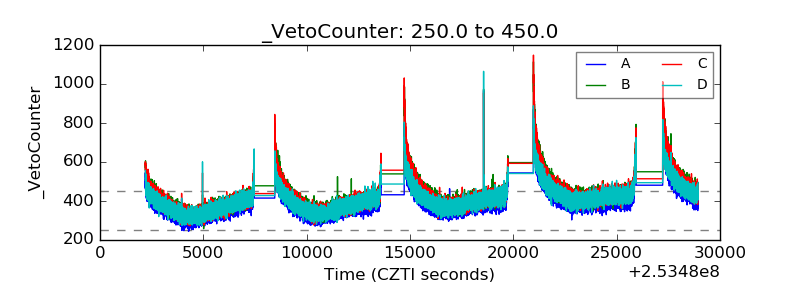 |