| Param | Original file | Final file |
|---|---|---|
| Filename | modeM0/AS1G08_083T02_9000001840_12405cztM0_level2.evt | modeM0/AS1G08_083T02_9000001840_12405cztM0_level2_quad_clean.evt |
| Size (bytes) | 502,214,400 | 83,335,680 |
| Size | 478.9 MB | 79.5 MB |
| Events in quadrant A | 5,115,502 | 522,889 |
| Events in quadrant B | 3,530,643 | 540,275 |
| Events in quadrant C | 2,847,048 | 530,587 |
| Events in quadrant D | 3,304,952 | 506,099 |
| Mode M9 | |||
|---|---|---|---|
| Quadrant | BADHDUFLAG | Total packets | Discarded packets |
| A | 0 | 12 | 0 |
| B | 0 | 12 | 0 |
| C | 0 | 12 | 0 |
| D | 0 | 12 | 0 |
| Mode SS | |||
|---|---|---|---|
| Quadrant | BADHDUFLAG | Total packets | Discarded packets |
| A | 0 | 124 | 0 |
| B | 0 | 124 | 0 |
| C | 0 | 124 | 0 |
| D | 0 | 124 | 0 |
| Mode M0 | |||
|---|---|---|---|
| Quadrant | BADHDUFLAG | Total packets | Discarded packets |
| A | 0 | 19398 | 3 |
| B | 0 | 14192 | 2 |
| C | 0 | 12440 | 2 |
| D | 0 | 13828 | 2 |
| Quadrant | Total seconds | Saturated seconds | Saturation percentage |
|---|---|---|---|
| A | 6065 | 230 | 3.792251% |
| B | 6065 | 227 | 3.742786% |
| C | 6065 | 47 | 0.774938% |
| D | 6065 | 88 | 1.450948% |
Noise dominated data is calculated using 1-second bins in cleaned event files. If a bin has >2000 counts, and if more than 50% of those come from <1% of pixels, then it is considered to be noise-dominated and hence unusable.
| Quadrant | # 1 sec bins | Bins with >0 counts | Bins with >2000 counts | High rate bins dominated by noise | Noise dominated (total time) | Noise dominated (detector-on time) | Marked lightcurve |
|---|---|---|---|---|---|---|---|
| A | 7291 | 6066 | 56 | 56 | 0.77% | 0.92% | 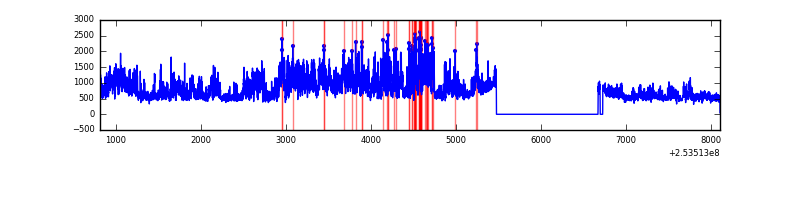 |
| B | 7291 | 6067 | 104 | 104 | 1.43% | 1.71% | 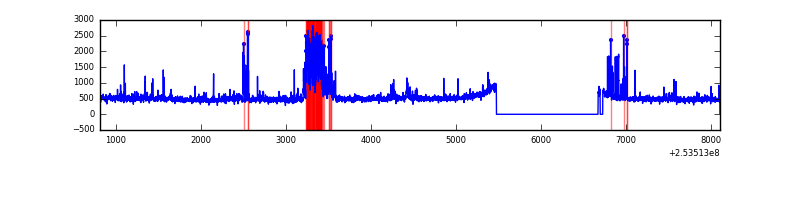 |
| C | 7291 | 6068 | 0 | 0 | 0.00% | 0.00% | 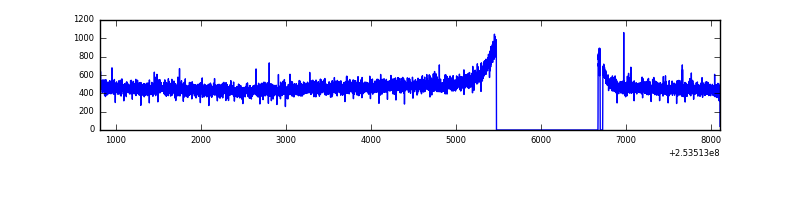 |
| D | 7291 | 6066 | 31 | 31 | 0.43% | 0.51% | 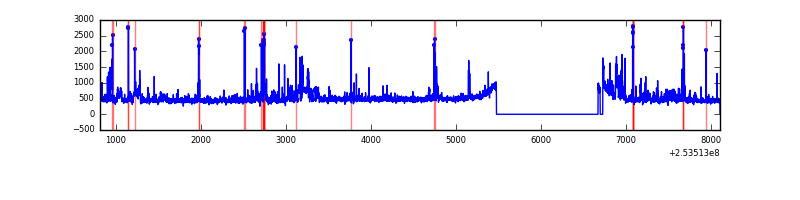 |
Top three noisy pixels from each quadrant. If the there are fewer than three noisy pixels in the level2.evt file, extra rows are filled as -1
| Pixel properties | Quadrant properties | ||||||
|---|---|---|---|---|---|---|---|
| Quadrant | DetID | PixID | Counts | Sigma | Mean | Median | Sigma |
| A | 8 | 15 | 1537086 | 10108.21 | 752 | 737 | 152.0 |
| A | 13 | 251 | 241948 | 1587.02 | 752 | 737 | 152.0 |
| A | 1 | 162 | 139862 | 915.35 | 752 | 737 | 152.0 |
| B | 4 | 239 | 491921 | 3445.1 | 749 | 732 | 142.6 |
| B | 3 | 64 | 38113 | 262.18 | 749 | 732 | 142.6 |
| B | 3 | 209 | 26340 | 179.61 | 749 | 732 | 142.6 |
| C | 13 | 61 | 5311 | 27.07 | 729 | 733 | 169.1 |
| C | 8 | 128 | 4027 | 19.48 | 729 | 733 | 169.1 |
| C | 8 | 112 | 2298 | 9.25 | 729 | 733 | 169.1 |
| D | 1 | 52 | 387096 | 2222.16 | 727 | 707 | 173.9 |
| D | 10 | 199 | 72190 | 411.11 | 727 | 707 | 173.9 |
| D | 13 | 104 | 31919 | 179.5 | 727 | 707 | 173.9 |
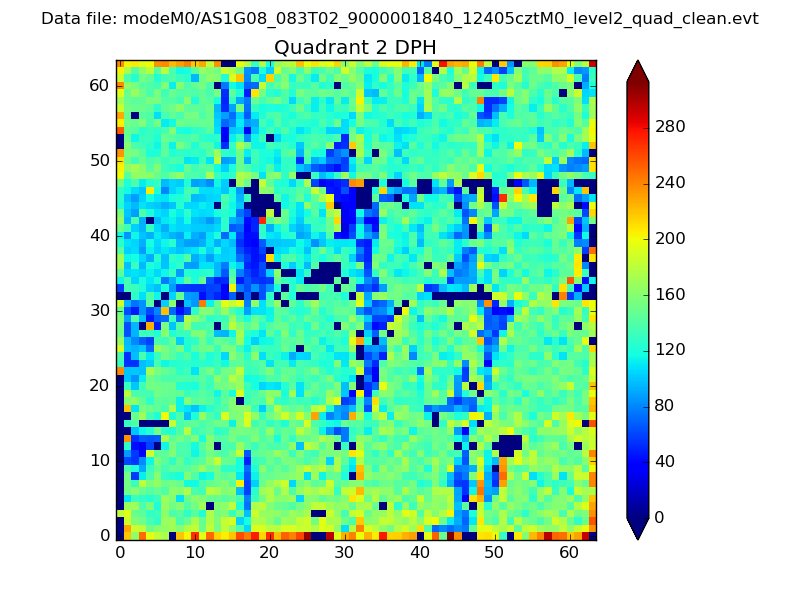
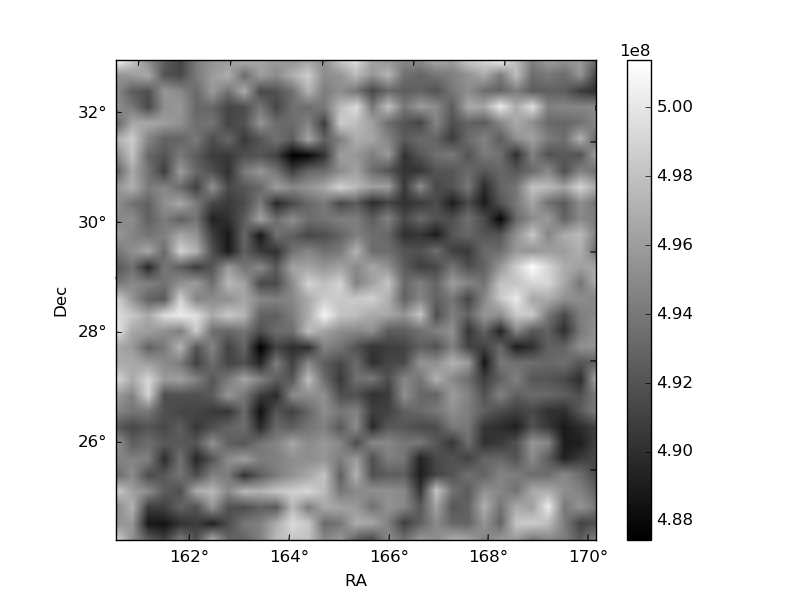
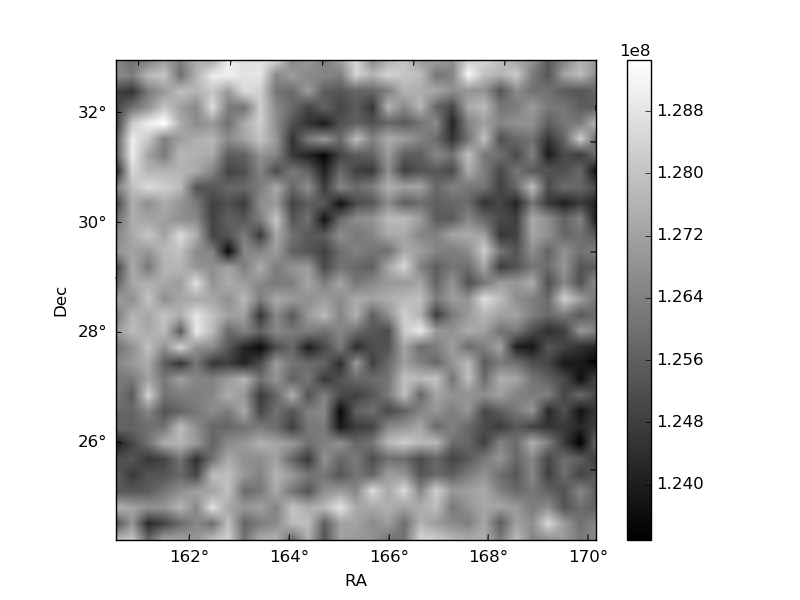
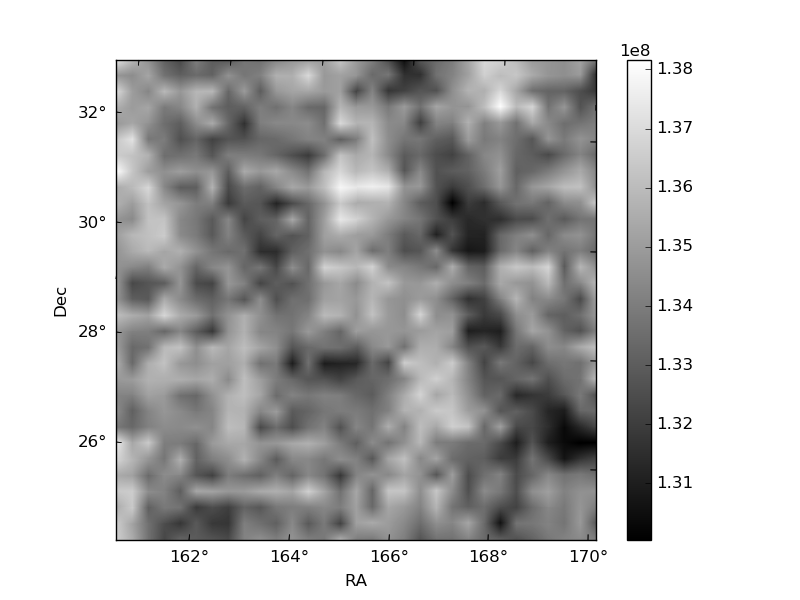
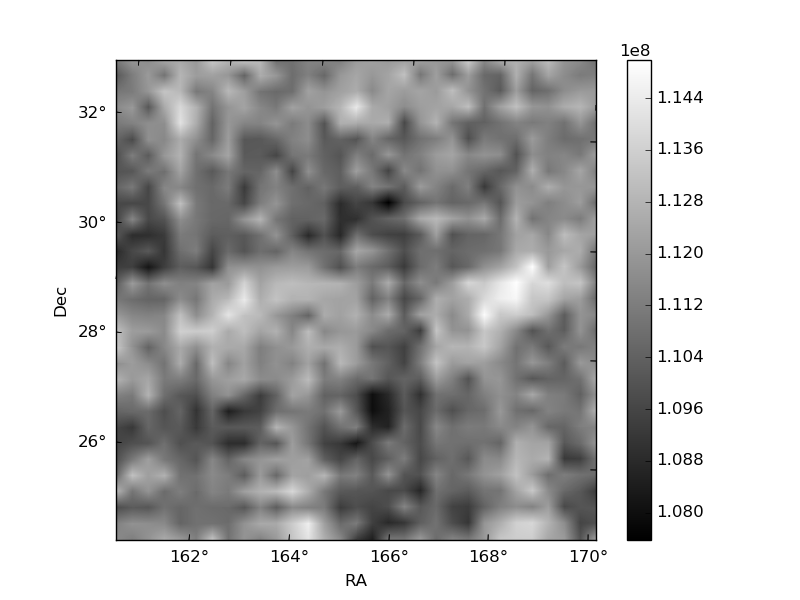
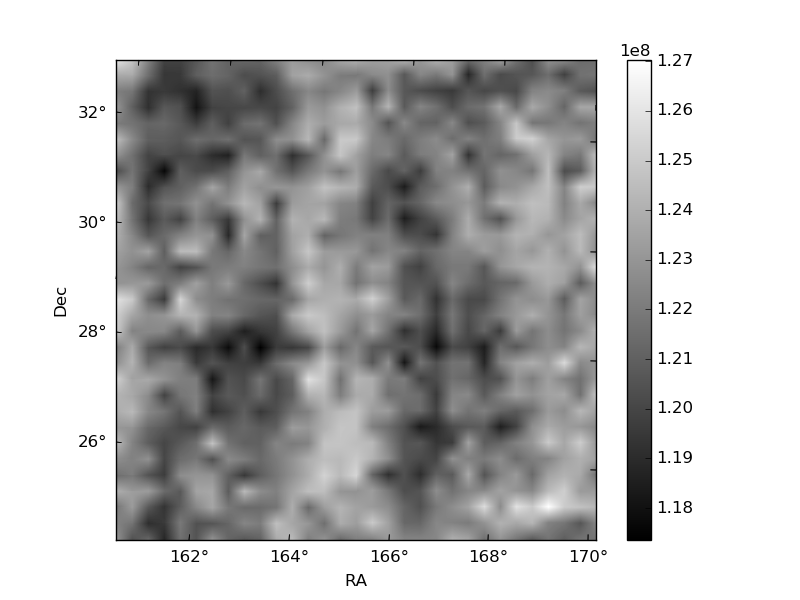
Histogram calculated using DETX and DETY for each event in the final _common_clean file
| Quadrant A | 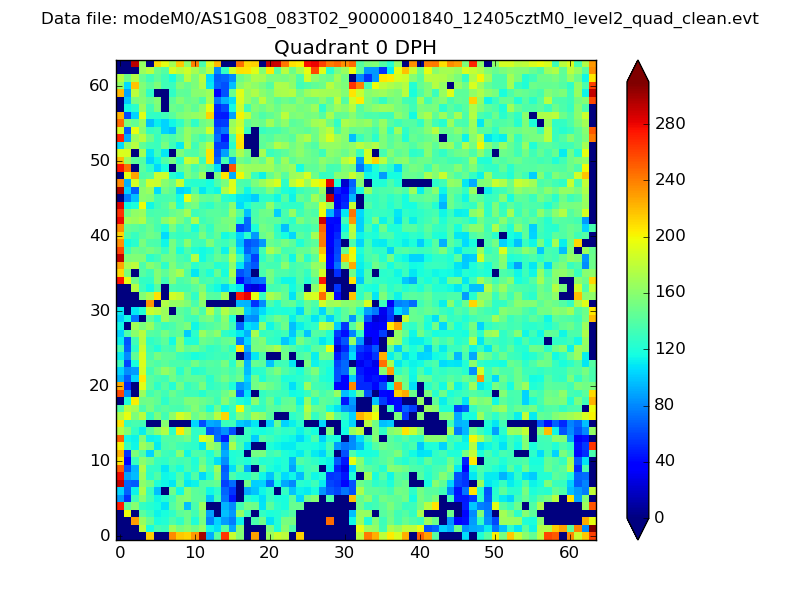 |
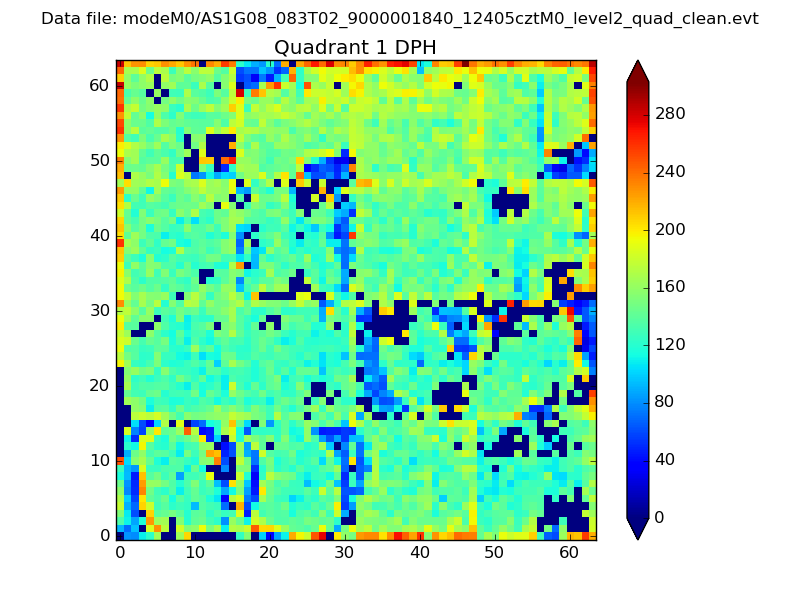 |
Quadrant B |
|---|---|---|---|
| Quadrant D | 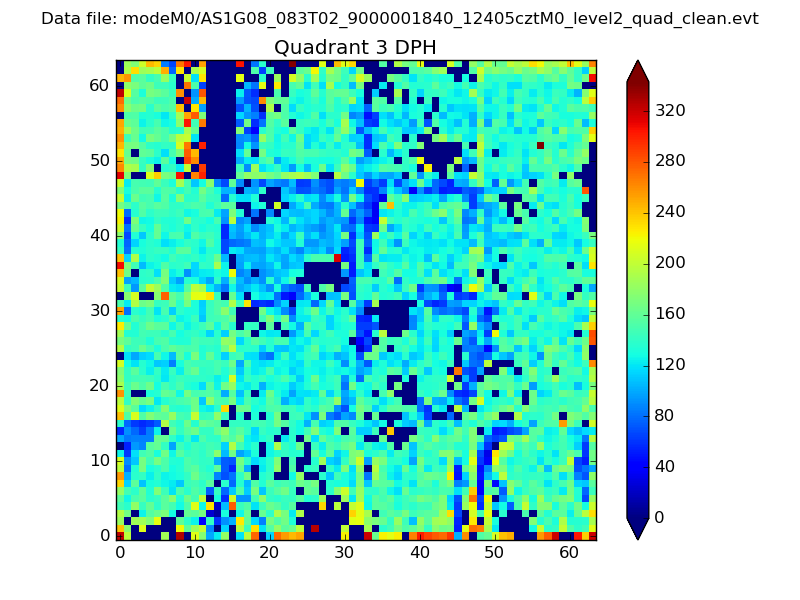 |
 |
Quadrant C |
| Plot type | Count rate plots | Images |
|---|---|---|
| Comparison with Poisson distribution Blue bars denote a histogram of data divided into 1 sec bins. Red curve is a Poisson curve with rate = median count rate of data. |
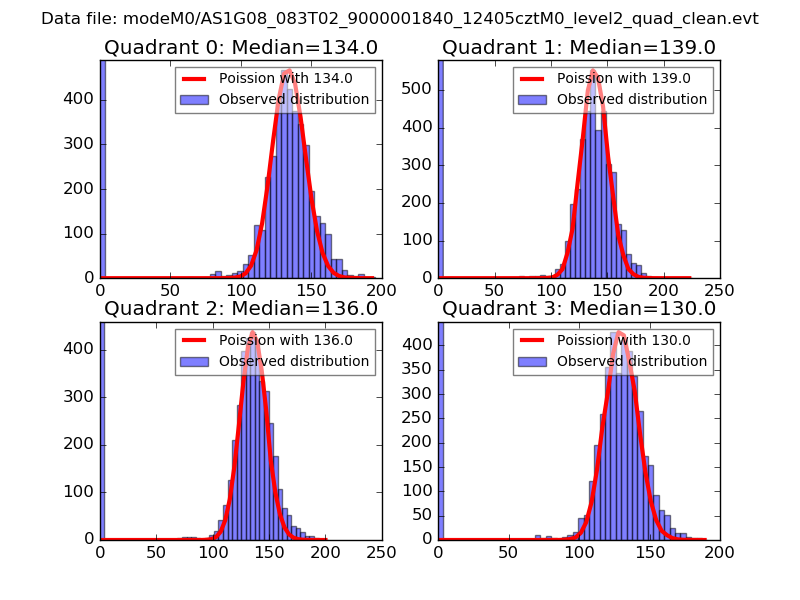 |
 |
| Quadrant-wise count rates Data is divided into 100 sec bins |
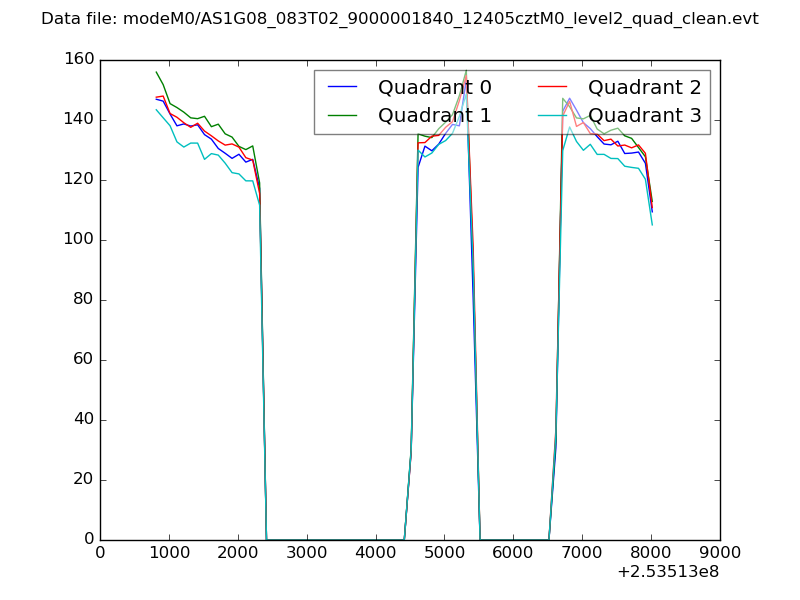 |
|
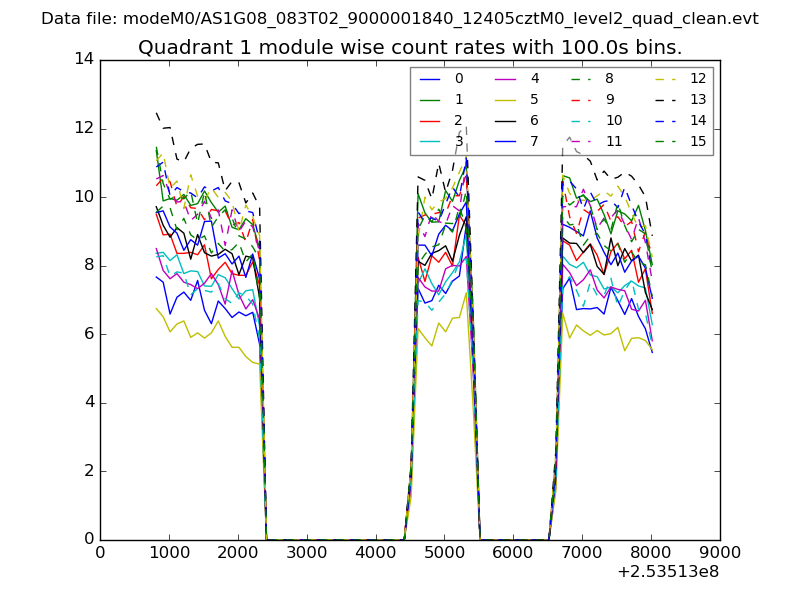
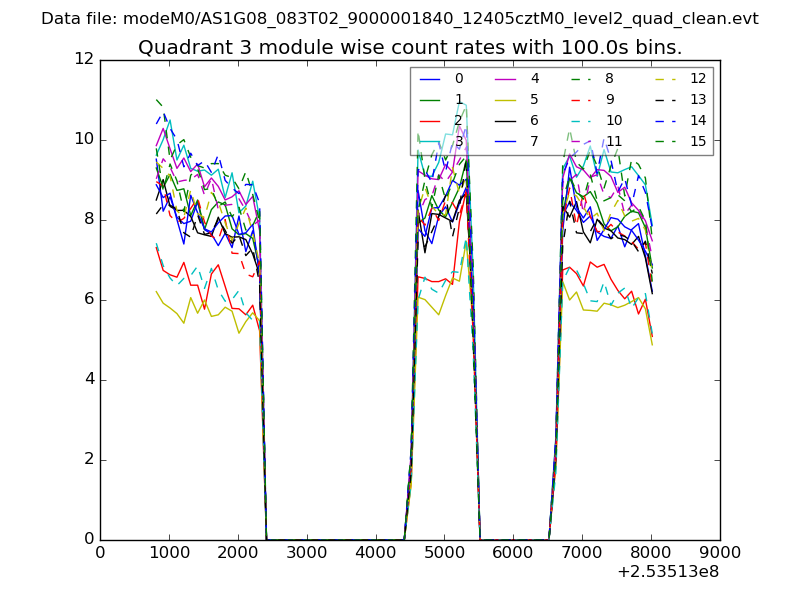
| Module-wise count rates for Quadrant A Data is divided into 100 sec bins |
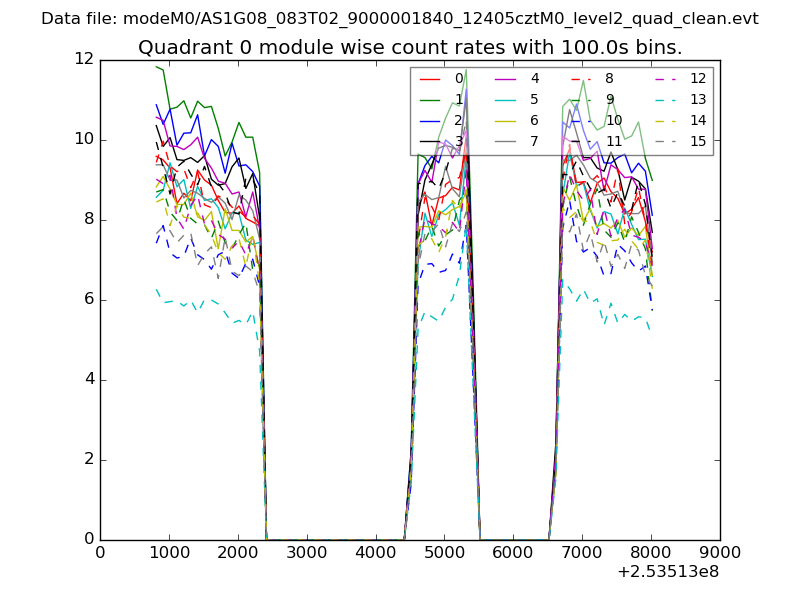 |
 |
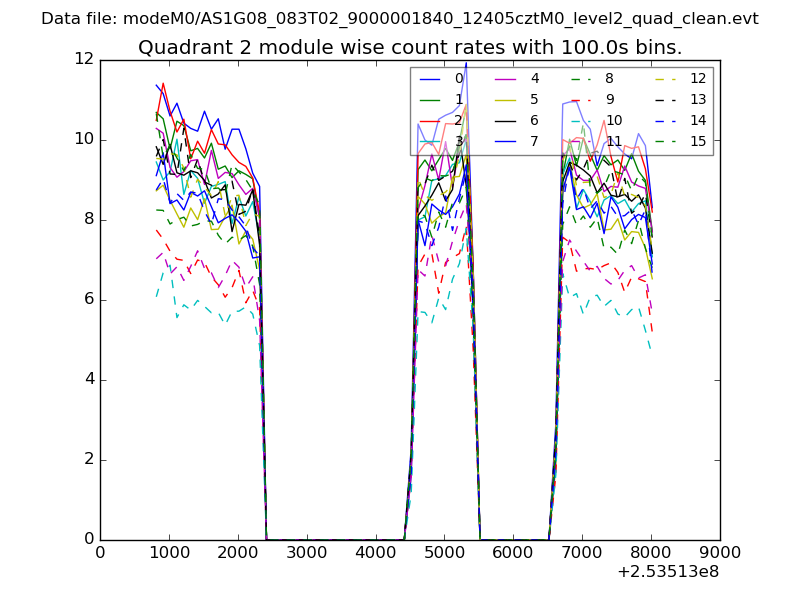
| Module-wise count rates for Quadrant B Data is divided into 100 sec bins |
 |
 |
| Module-wise count rates for Quadrant C Data is divided into 100 sec bins |
 |
 |
| Module-wise count rates for Quadrant D Data is divided into 100 sec bins |
 |
 |
| Parameter | Plot |
|---|---|
| CZT HV Monitor | 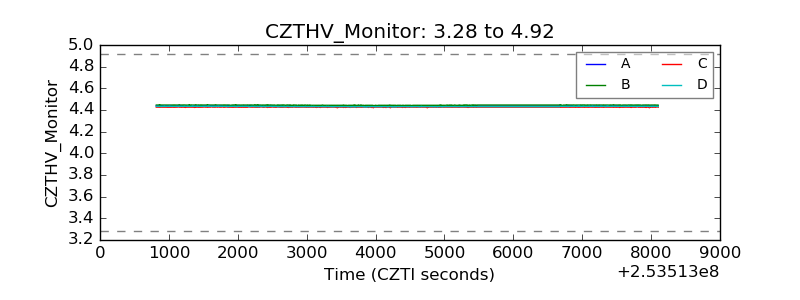 |
| D_VDD | 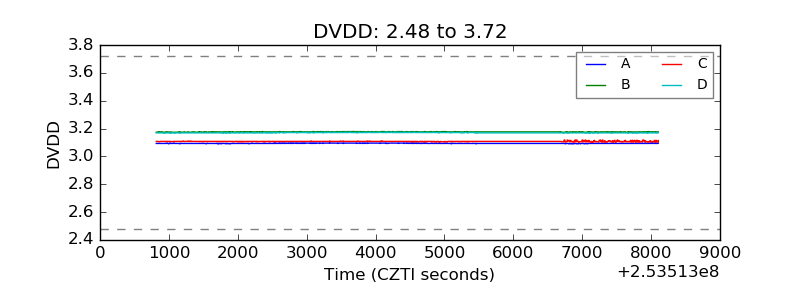 |
| Temperature 1 | 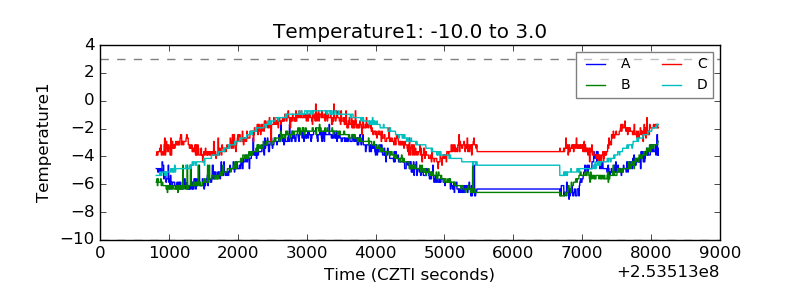 |
| Veto HV Monitor | 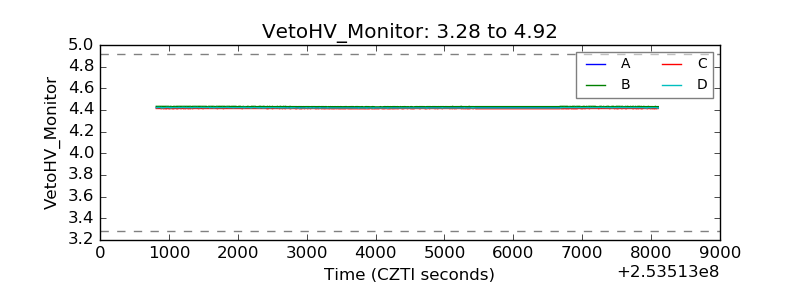 |
| Veto LLD | 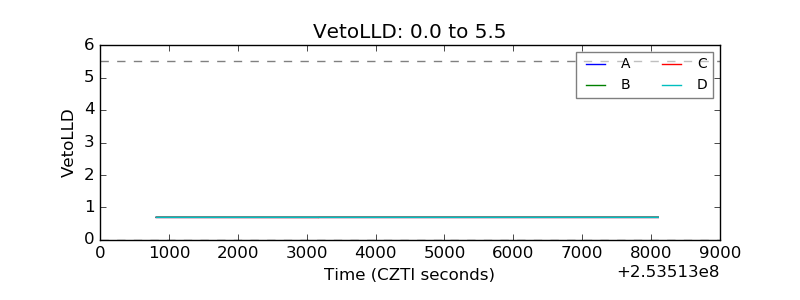 |
| Alpha Counter | 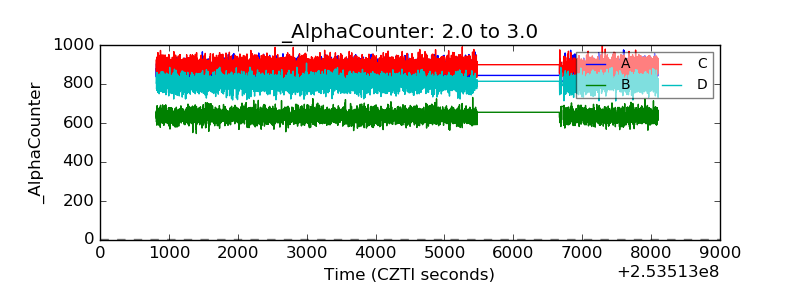 |
| _CPM_Rate | 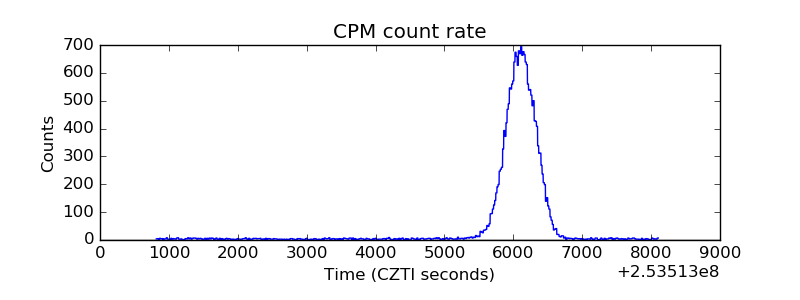 |
| CZT Counter | 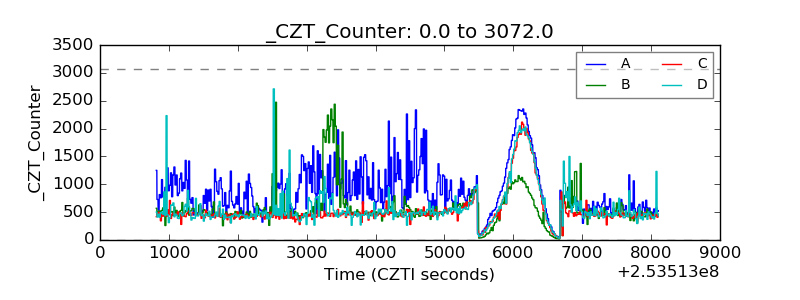 |
| +2.5 Volts monitor |  |
| +5 Volts monitor |  |
| _ROLL_ROT | 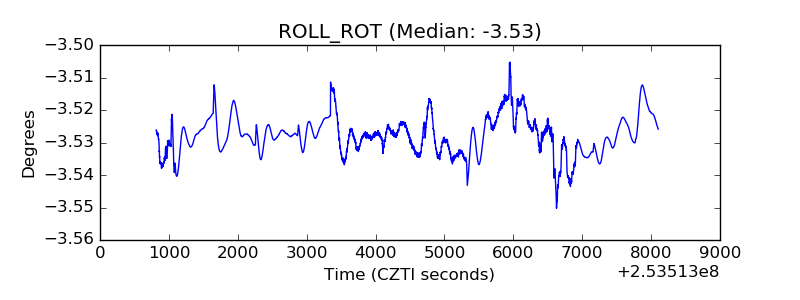 |
| _Roll_DEC | 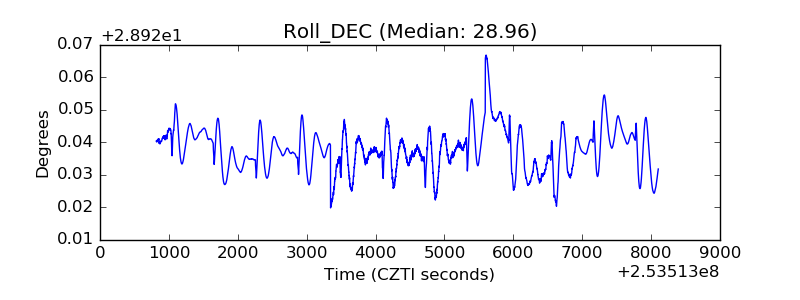 |
| _Roll_RA | 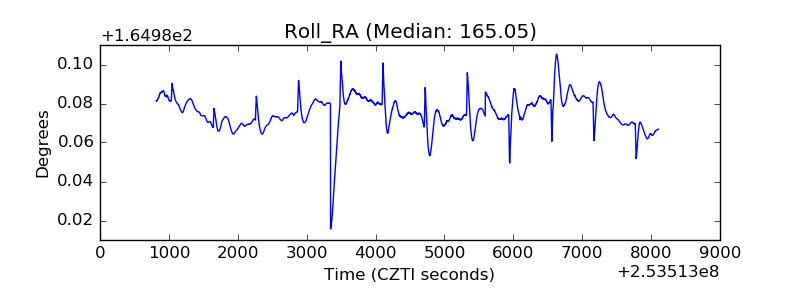 |
| Veto Counter | 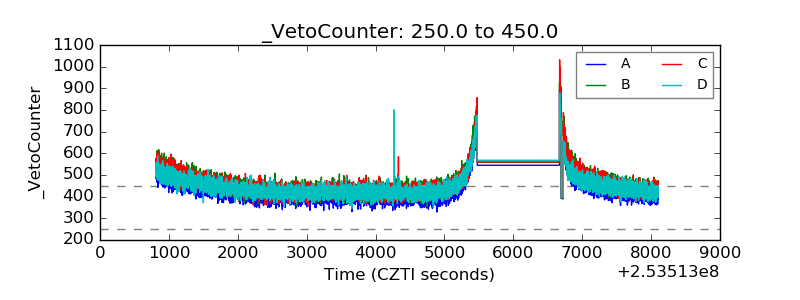 |