| Param | Original file | Final file |
|---|---|---|
| Filename | modeM0/AS1G08_083T02_9000001840_12406cztM0_level2.evt | modeM0/AS1G08_083T02_9000001840_12406cztM0_level2_quad_clean.evt |
| Size (bytes) | 479,543,040 | 78,756,480 |
| Size | 457.3 MB | 75.1 MB |
| Events in quadrant A | 3,793,341 | 488,805 |
| Events in quadrant B | 3,493,465 | 500,327 |
| Events in quadrant C | 2,881,134 | 494,858 |
| Events in quadrant D | 3,932,247 | 466,056 |
| Mode M9 | |||
|---|---|---|---|
| Quadrant | BADHDUFLAG | Total packets | Discarded packets |
| A | 0 | 10 | 0 |
| B | 0 | 10 | 0 |
| C | 0 | 10 | 0 |
| D | 0 | 10 | 0 |
| Mode SS | |||
|---|---|---|---|
| Quadrant | BADHDUFLAG | Total packets | Discarded packets |
| A | 0 | 126 | 0 |
| B | 0 | 126 | 0 |
| C | 0 | 126 | 0 |
| D | 0 | 126 | 0 |
| Mode M0 | |||
|---|---|---|---|
| Quadrant | BADHDUFLAG | Total packets | Discarded packets |
| A | 0 | 15290 | 2 |
| B | 0 | 14157 | 1 |
| C | 0 | 12698 | 1 |
| D | 0 | 15793 | 1 |
| Quadrant | Total seconds | Saturated seconds | Saturation percentage |
|---|---|---|---|
| A | 6230 | 135 | 2.166934% |
| B | 6230 | 196 | 3.146067% |
| C | 6230 | 59 | 0.947030% |
| D | 6230 | 252 | 4.044944% |
Noise dominated data is calculated using 1-second bins in cleaned event files. If a bin has >2000 counts, and if more than 50% of those come from <1% of pixels, then it is considered to be noise-dominated and hence unusable.
| Quadrant | # 1 sec bins | Bins with >0 counts | Bins with >2000 counts | High rate bins dominated by noise | Noise dominated (total time) | Noise dominated (detector-on time) | Marked lightcurve |
|---|---|---|---|---|---|---|---|
| A | 7236 | 6231 | 7 | 7 | 0.10% | 0.11% | 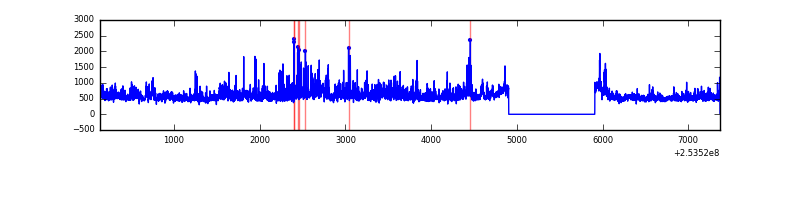 |
| B | 7236 | 6231 | 55 | 55 | 0.76% | 0.88% | 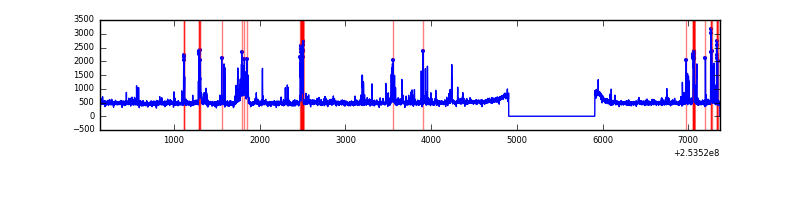 |
| C | 7236 | 6232 | 0 | 0 | 0.00% | 0.00% | 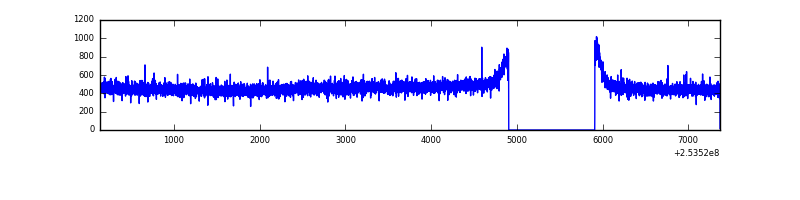 |
| D | 7236 | 6231 | 172 | 172 | 2.38% | 2.76% | 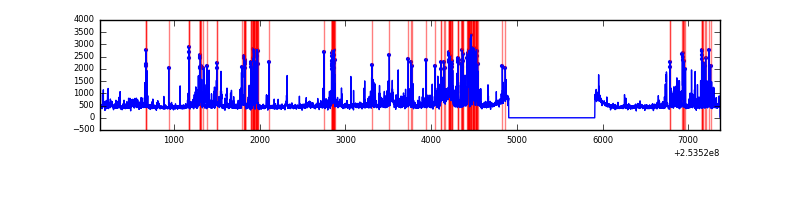 |
Top three noisy pixels from each quadrant. If the there are fewer than three noisy pixels in the level2.evt file, extra rows are filled as -1
| Pixel properties | Quadrant properties | ||||||
|---|---|---|---|---|---|---|---|
| Quadrant | DetID | PixID | Counts | Sigma | Mean | Median | Sigma |
| A | 13 | 251 | 275235 | 1768.02 | 762 | 746 | 155.3 |
| A | 1 | 162 | 137641 | 881.76 | 762 | 746 | 155.3 |
| A | 12 | 189 | 83055 | 530.16 | 762 | 746 | 155.3 |
| B | 4 | 239 | 377150 | 2609.74 | 754 | 736 | 144.2 |
| B | 3 | 64 | 51856 | 354.42 | 754 | 736 | 144.2 |
| B | 3 | 209 | 30248 | 204.61 | 754 | 736 | 144.2 |
| C | 8 | 128 | 7723 | 40.88 | 735 | 740 | 170.8 |
| C | 13 | 61 | 5462 | 27.64 | 735 | 740 | 170.8 |
| C | 8 | 112 | 4998 | 24.92 | 735 | 740 | 170.8 |
| D | 1 | 52 | 970671 | 5514.64 | 731 | 710 | 175.9 |
| D | 10 | 157 | 54581 | 306.28 | 731 | 710 | 175.9 |
| D | 2 | 234 | 23428 | 129.16 | 731 | 710 | 175.9 |
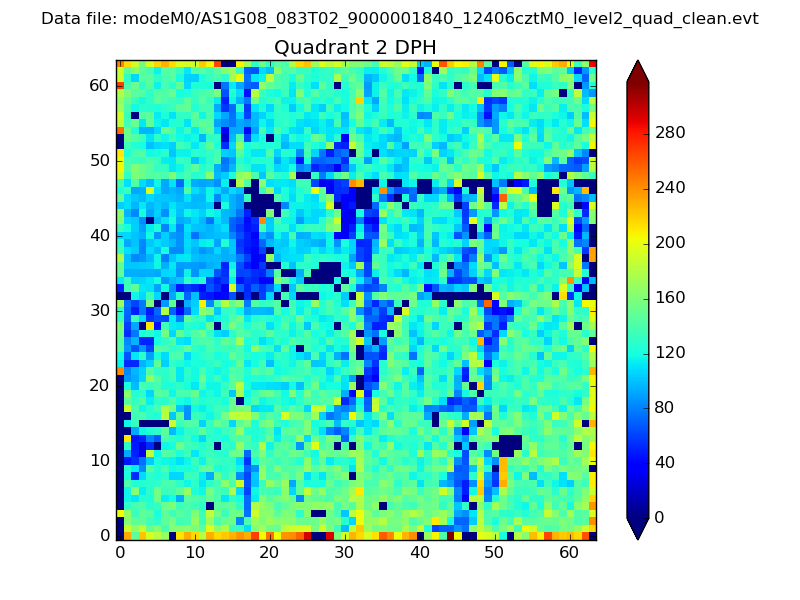
Histogram calculated using DETX and DETY for each event in the final _common_clean file
| Quadrant A | 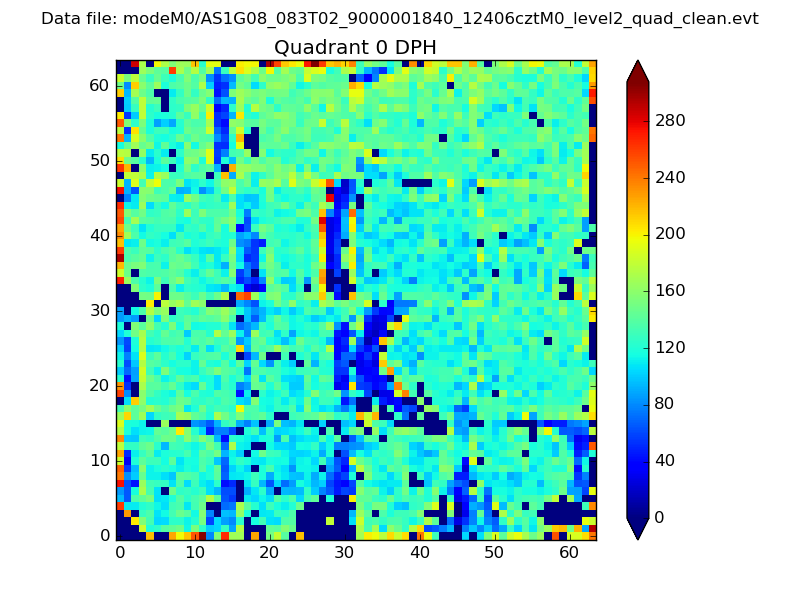 |
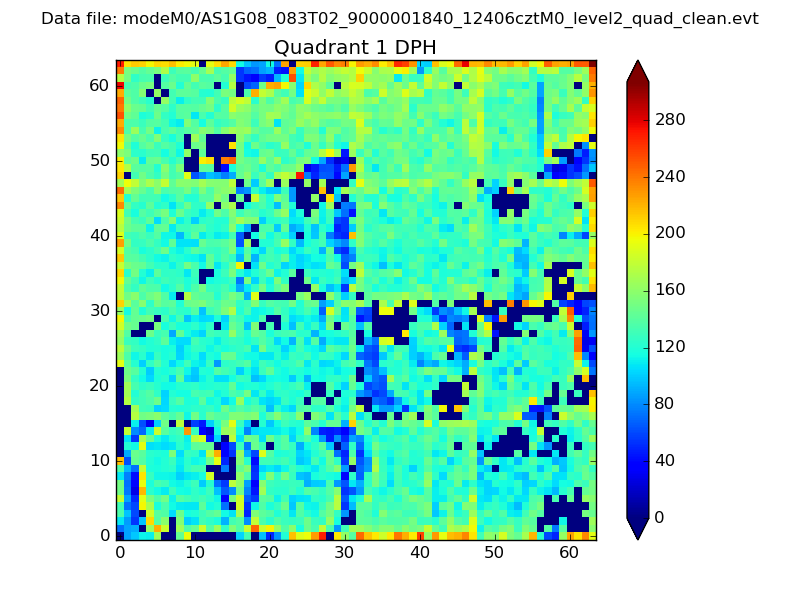 |
Quadrant B |
|---|---|---|---|
| Quadrant D | 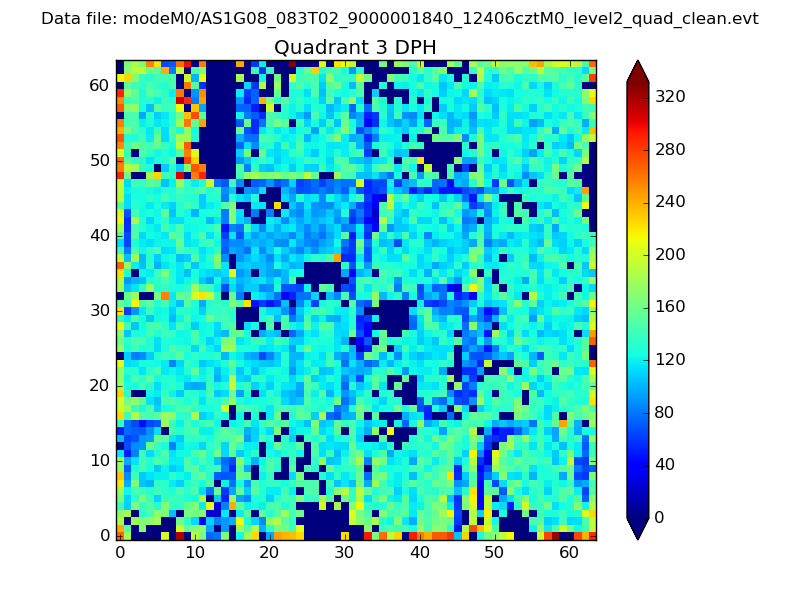 |
 |
Quadrant C |
| Plot type | Count rate plots | Images |
|---|---|---|
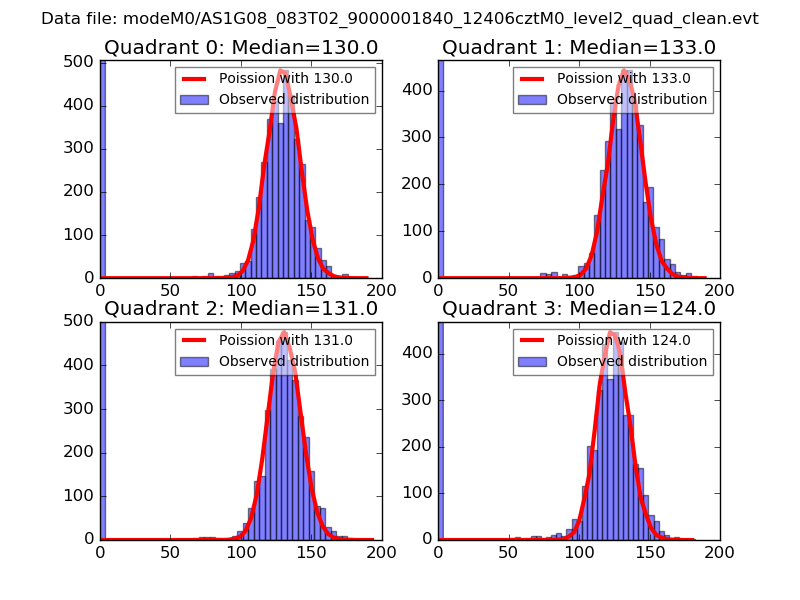
| Comparison with Poisson distribution Blue bars denote a histogram of data divided into 1 sec bins. Red curve is a Poisson curve with rate = median count rate of data. |
 |
 |
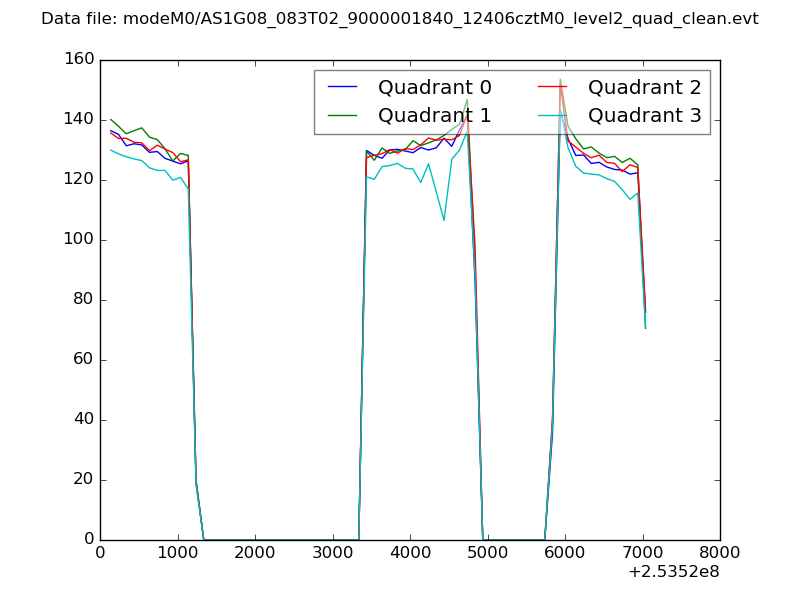
| Quadrant-wise count rates Data is divided into 100 sec bins |
 |
|
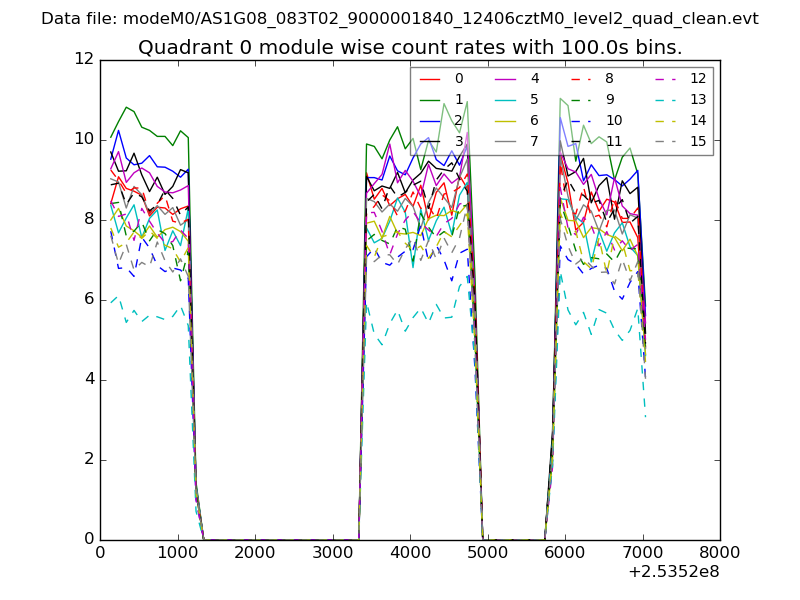
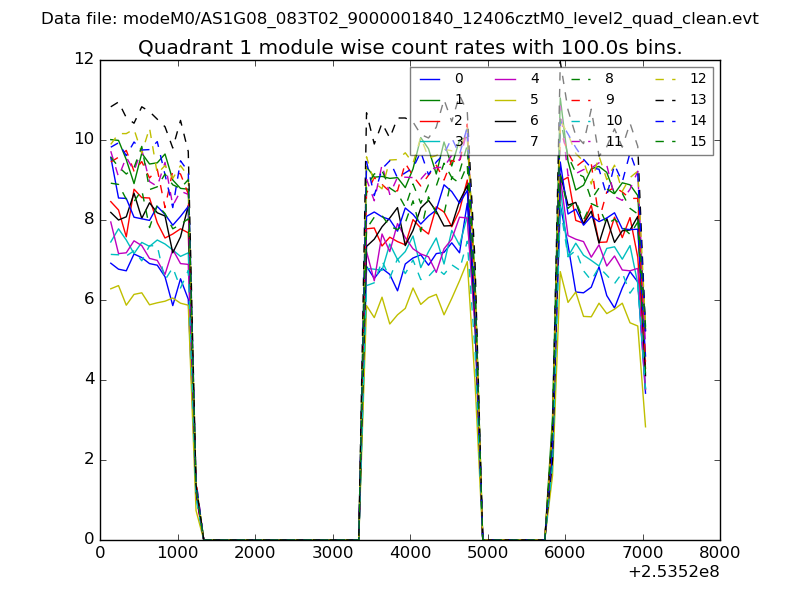
| Module-wise count rates for Quadrant A Data is divided into 100 sec bins |
 |
 |
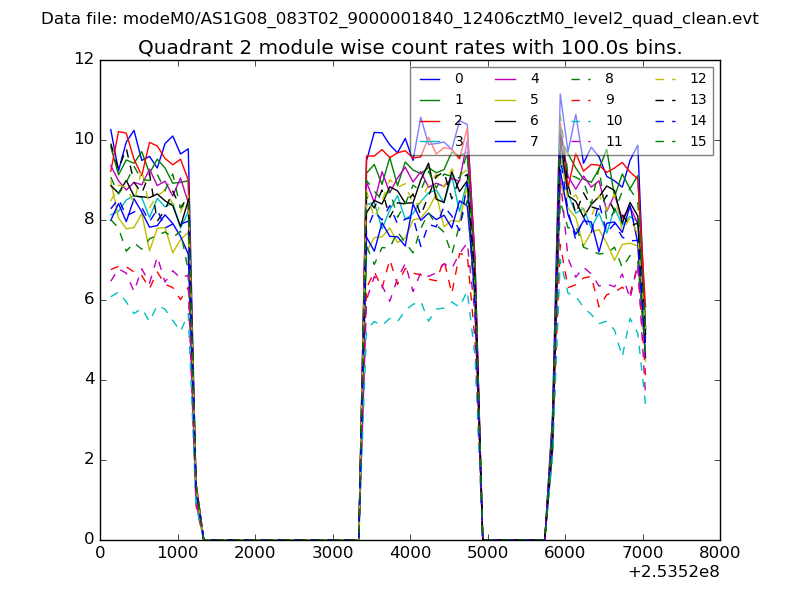
| Module-wise count rates for Quadrant B Data is divided into 100 sec bins |
 |
 |
| Module-wise count rates for Quadrant C Data is divided into 100 sec bins |
 |
 |
| Module-wise count rates for Quadrant D Data is divided into 100 sec bins |
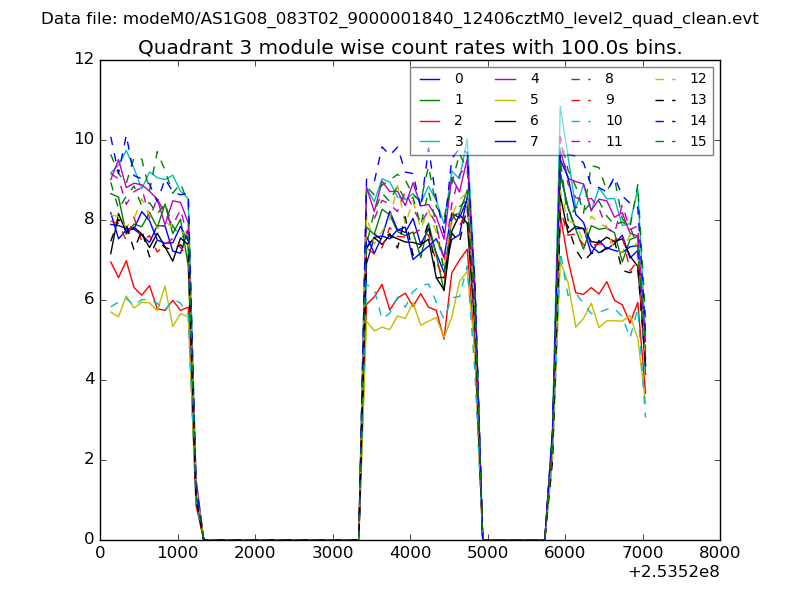 |
 |
| Parameter | Plot |
|---|---|
| CZT HV Monitor | 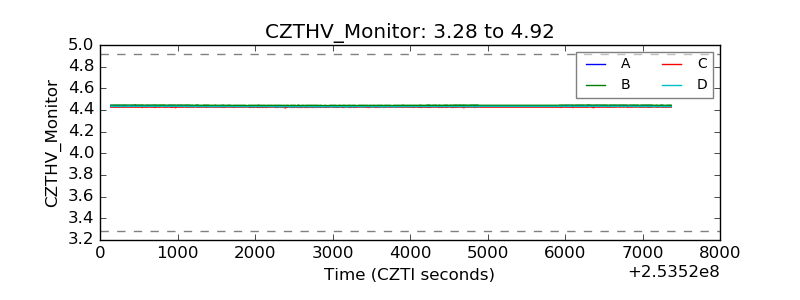 |
| D_VDD | 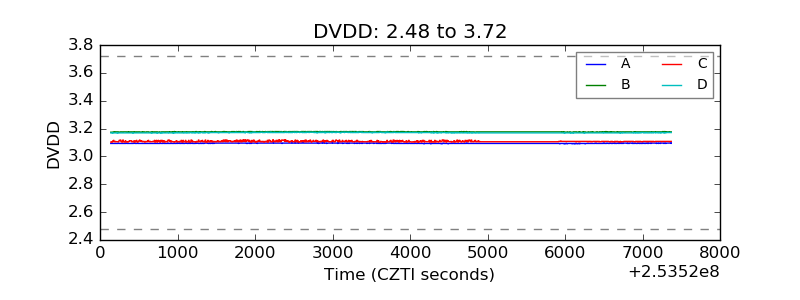 |
| Temperature 1 | 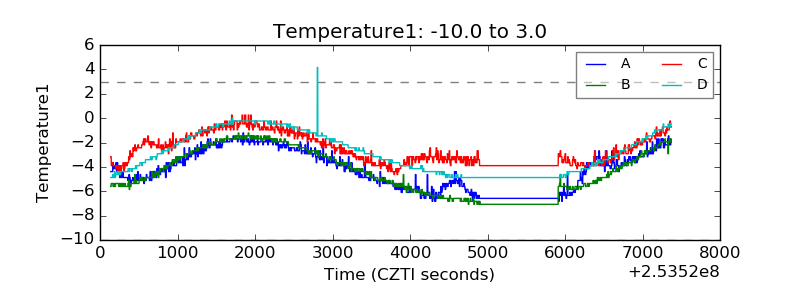 |
| Veto HV Monitor | 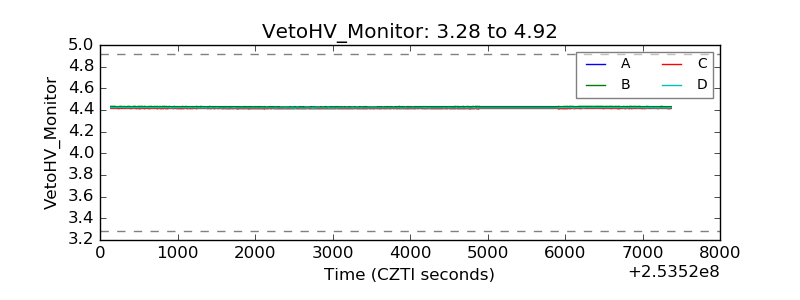 |
| Veto LLD | 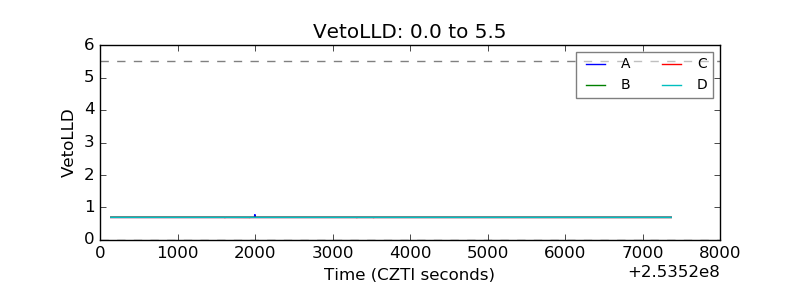 |
| Alpha Counter | 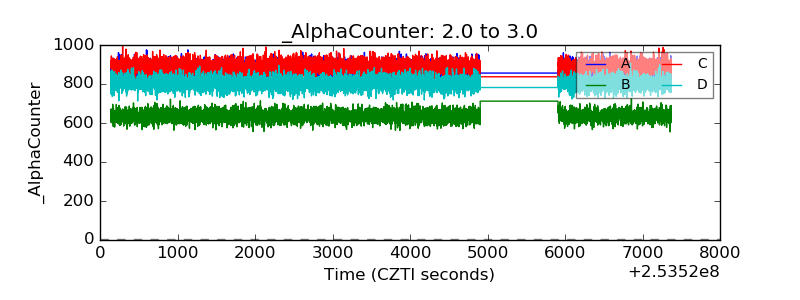 |
| _CPM_Rate | 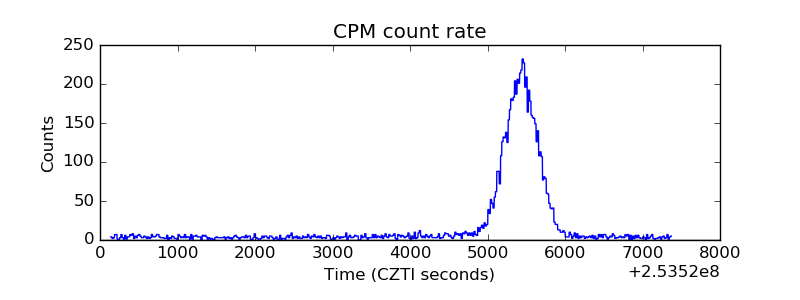 |
| CZT Counter | 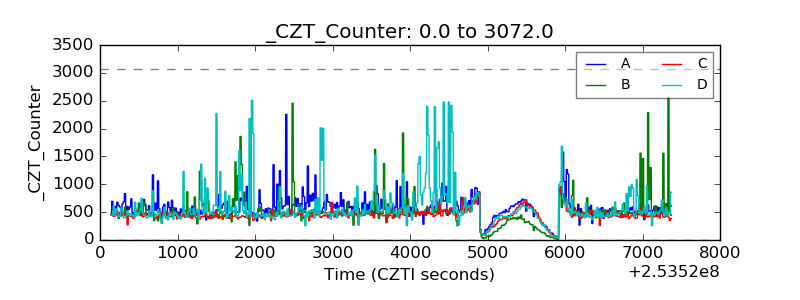 |
| +2.5 Volts monitor |  |
| +5 Volts monitor |  |
| _ROLL_ROT | 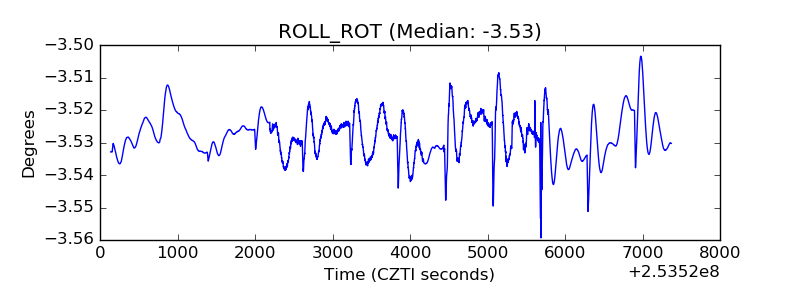 |
| _Roll_DEC | 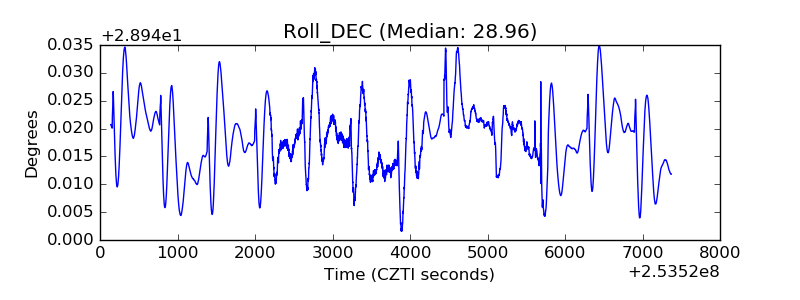 |
| _Roll_RA | 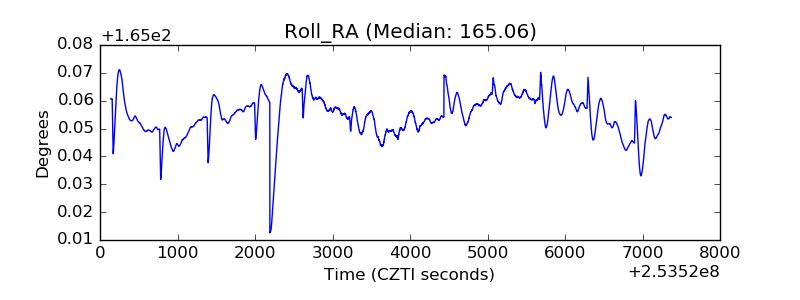 |
| Veto Counter | 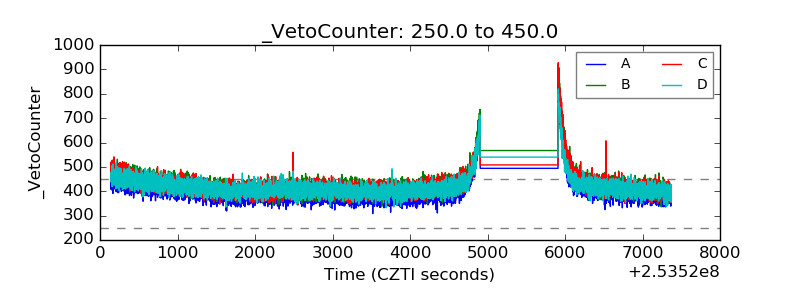 |