| Param | Original file | Final file |
|---|---|---|
| Filename | modeM0/AS1G08_083T02_9000001840_12407cztM0_level2.evt | modeM0/AS1G08_083T02_9000001840_12407cztM0_level2_quad_clean.evt |
| Size (bytes) | 561,853,440 | 75,173,760 |
| Size | 535.8 MB | 71.7 MB |
| Events in quadrant A | 5,354,872 | 444,719 |
| Events in quadrant B | 4,370,558 | 465,988 |
| Events in quadrant C | 3,008,784 | 465,197 |
| Events in quadrant D | 3,835,859 | 441,710 |
| Mode M9 | |||
|---|---|---|---|
| Quadrant | BADHDUFLAG | Total packets | Discarded packets |
| A | 0 | 6 | 0 |
| B | 0 | 6 | 0 |
| C | 0 | 6 | 0 |
| D | 0 | 6 | 0 |
| Mode SS | |||
|---|---|---|---|
| Quadrant | BADHDUFLAG | Total packets | Discarded packets |
| A | 0 | 134 | 0 |
| B | 0 | 134 | 0 |
| C | 0 | 134 | 0 |
| D | 0 | 134 | 0 |
| Mode M0 | |||
|---|---|---|---|
| Quadrant | BADHDUFLAG | Total packets | Discarded packets |
| A | 0 | 20282 | 2 |
| B | 0 | 17190 | 1 |
| C | 0 | 13488 | 1 |
| D | 0 | 15706 | 1 |
| Quadrant | Total seconds | Saturated seconds | Saturation percentage |
|---|---|---|---|
| A | 6568 | 710 | 10.809988% |
| B | 6568 | 546 | 8.313033% |
| C | 6568 | 145 | 2.207674% |
| D | 6568 | 263 | 4.004263% |
Noise dominated data is calculated using 1-second bins in cleaned event files. If a bin has >2000 counts, and if more than 50% of those come from <1% of pixels, then it is considered to be noise-dominated and hence unusable.
| Quadrant | # 1 sec bins | Bins with >0 counts | Bins with >2000 counts | High rate bins dominated by noise | Noise dominated (total time) | Noise dominated (detector-on time) | Marked lightcurve |
|---|---|---|---|---|---|---|---|
| A | 7164 | 6569 | 419 | 419 | 5.85% | 6.38% | 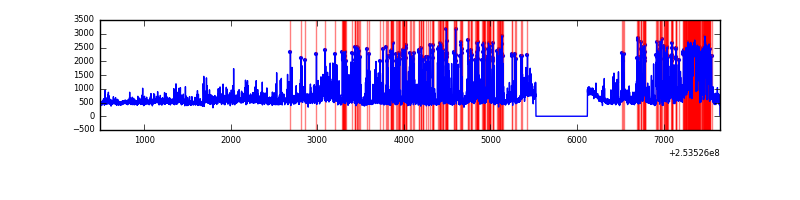 |
| B | 7164 | 6569 | 245 | 245 | 3.42% | 3.73% | 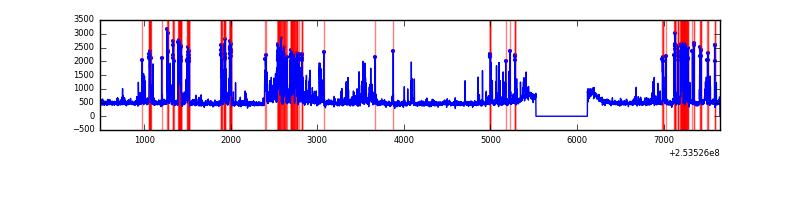 |
| C | 7164 | 6569 | 1 | 1 | 0.01% | 0.02% | 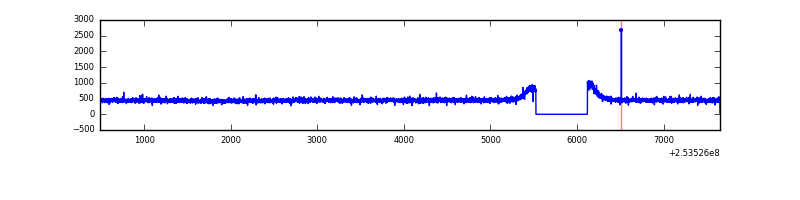 |
| D | 7164 | 6569 | 99 | 99 | 1.38% | 1.51% | 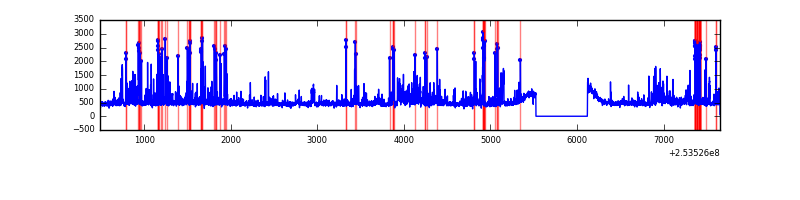 |
Top three noisy pixels from each quadrant. If the there are fewer than three noisy pixels in the level2.evt file, extra rows are filled as -1
| Pixel properties | Quadrant properties | ||||||
|---|---|---|---|---|---|---|---|
| Quadrant | DetID | PixID | Counts | Sigma | Mean | Median | Sigma |
| A | 14 | 237 | 1694899 | 10702.45 | 771 | 752 | 158.3 |
| A | 13 | 251 | 273304 | 1721.8 | 771 | 752 | 158.3 |
| A | 1 | 162 | 108577 | 681.16 | 771 | 752 | 158.3 |
| B | 4 | 239 | 1207438 | 8083.0 | 774 | 753 | 149.3 |
| B | 3 | 64 | 34693 | 227.35 | 774 | 753 | 149.3 |
| B | 3 | 209 | 25652 | 166.79 | 774 | 753 | 149.3 |
| C | 13 | 61 | 5814 | 28.19 | 769 | 771 | 178.9 |
| C | 5 | 252 | 4770 | 22.35 | 769 | 771 | 178.9 |
| C | 14 | 234 | 4045 | 18.3 | 769 | 771 | 178.9 |
| D | 1 | 52 | 767792 | 4154.49 | 765 | 740 | 184.6 |
| D | 10 | 253 | 36508 | 193.73 | 765 | 740 | 184.6 |
| D | 13 | 104 | 35439 | 187.94 | 765 | 740 | 184.6 |
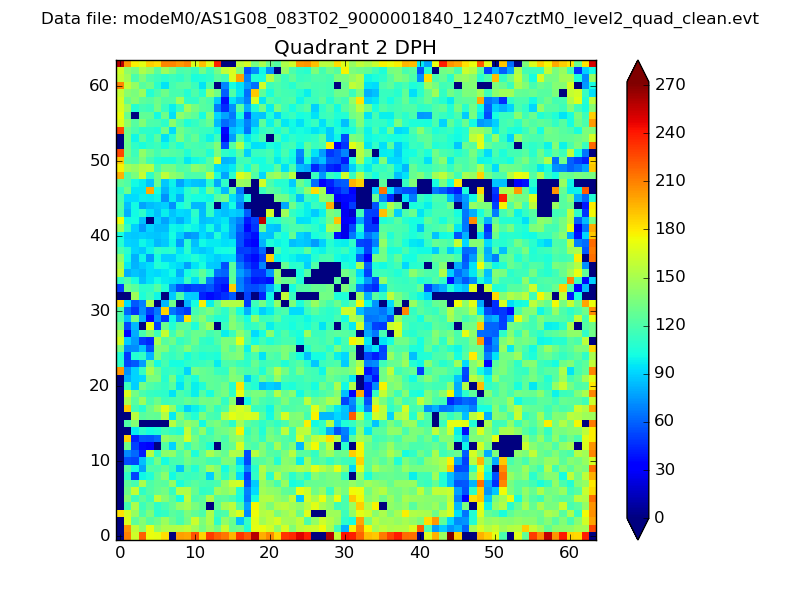
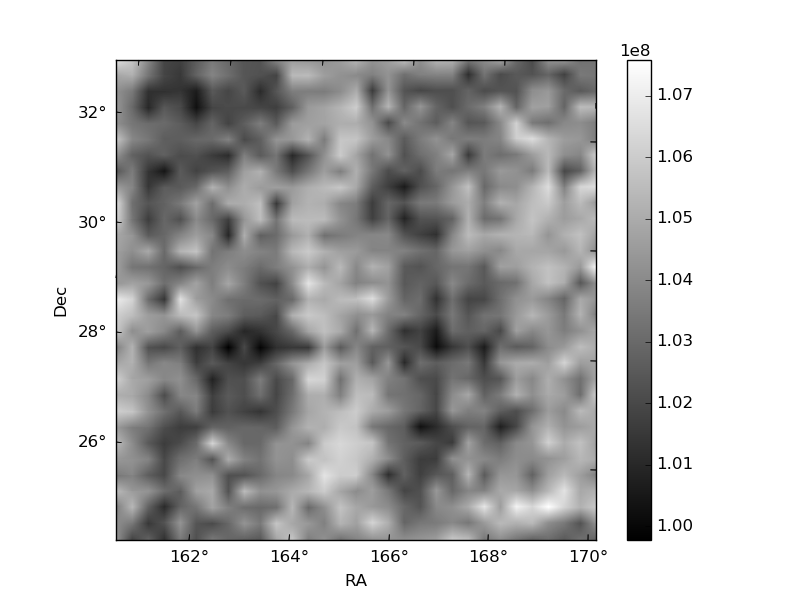
Histogram calculated using DETX and DETY for each event in the final _common_clean file
| Quadrant A | 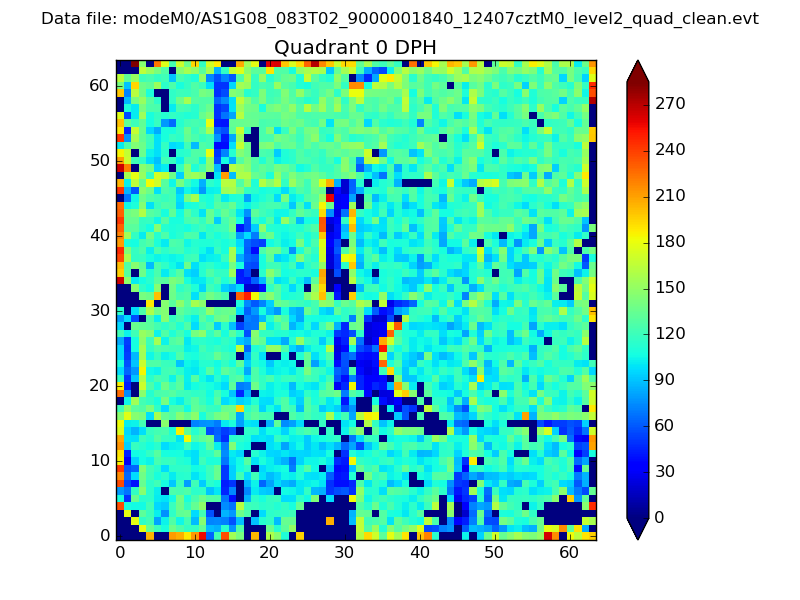 |
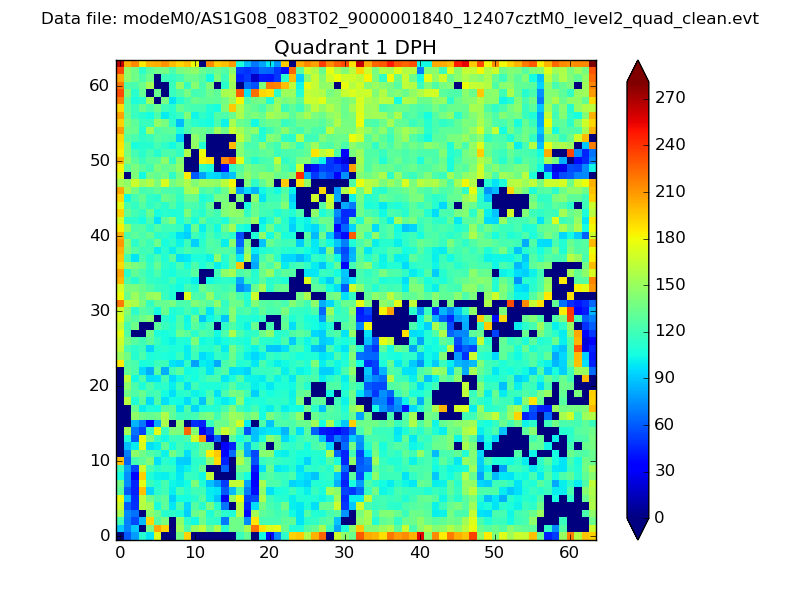 |
Quadrant B |
|---|---|---|---|
| Quadrant D | 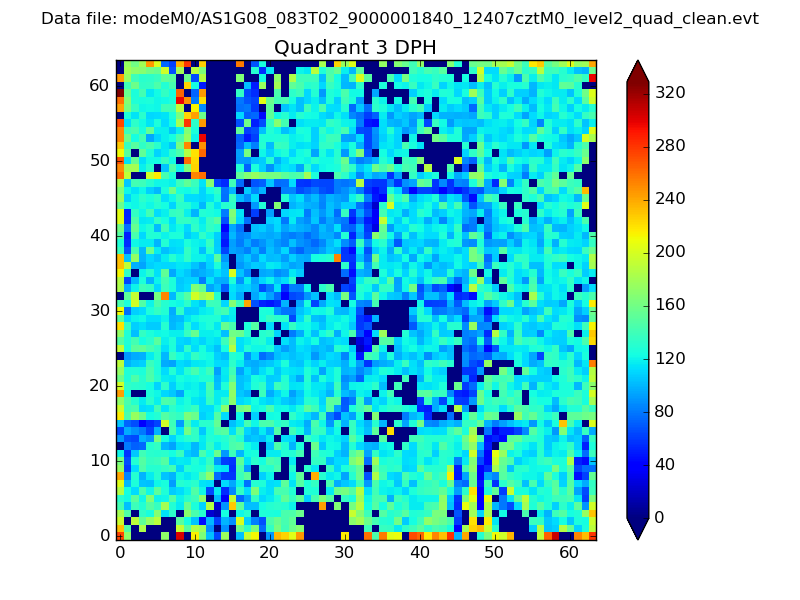 |
 |
Quadrant C |
| Plot type | Count rate plots | Images |
|---|---|---|
| Comparison with Poisson distribution Blue bars denote a histogram of data divided into 1 sec bins. Red curve is a Poisson curve with rate = median count rate of data. |
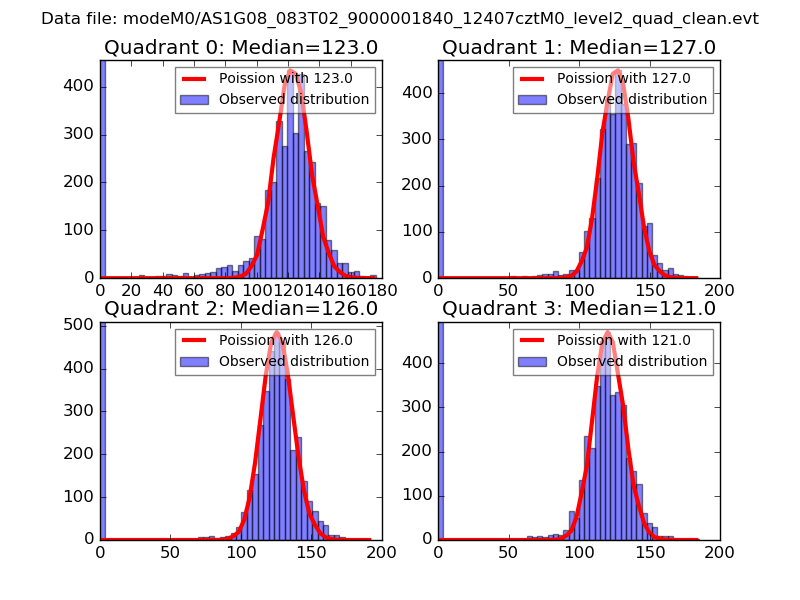 |
 |
| Quadrant-wise count rates Data is divided into 100 sec bins |
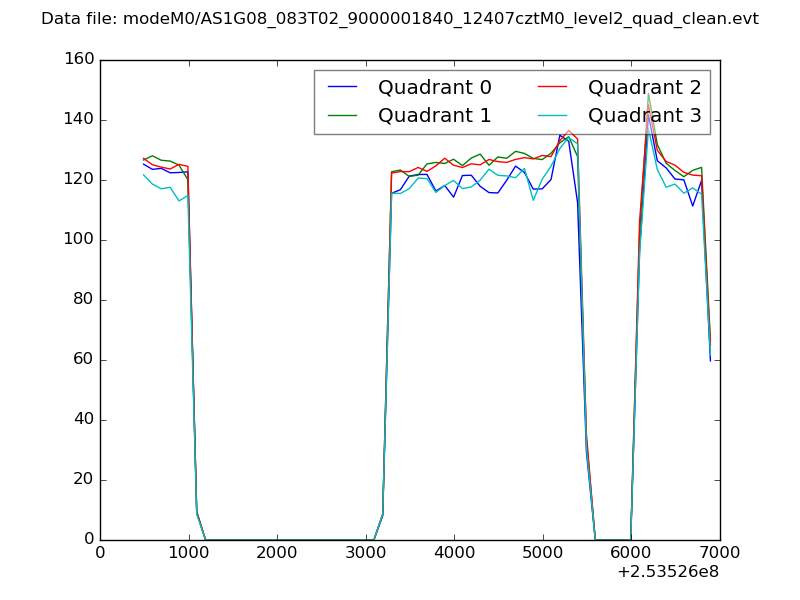 |
|
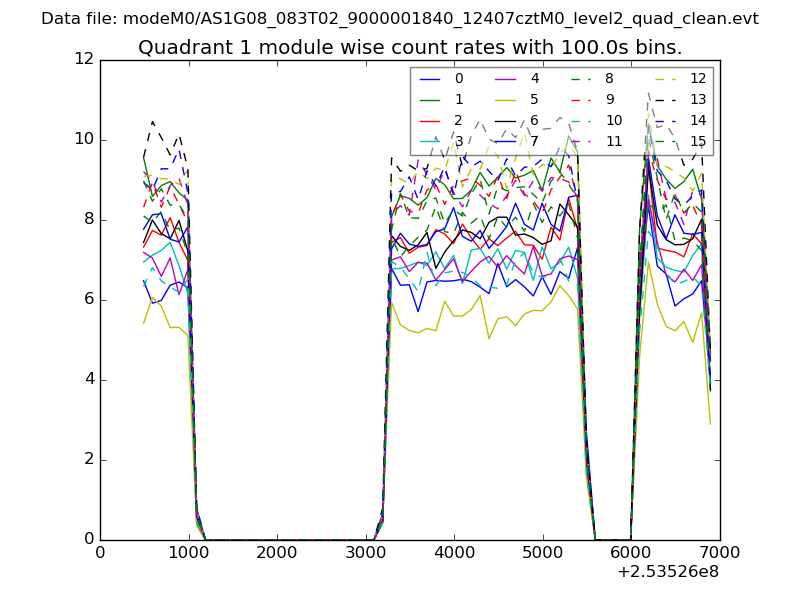
| Module-wise count rates for Quadrant A Data is divided into 100 sec bins |
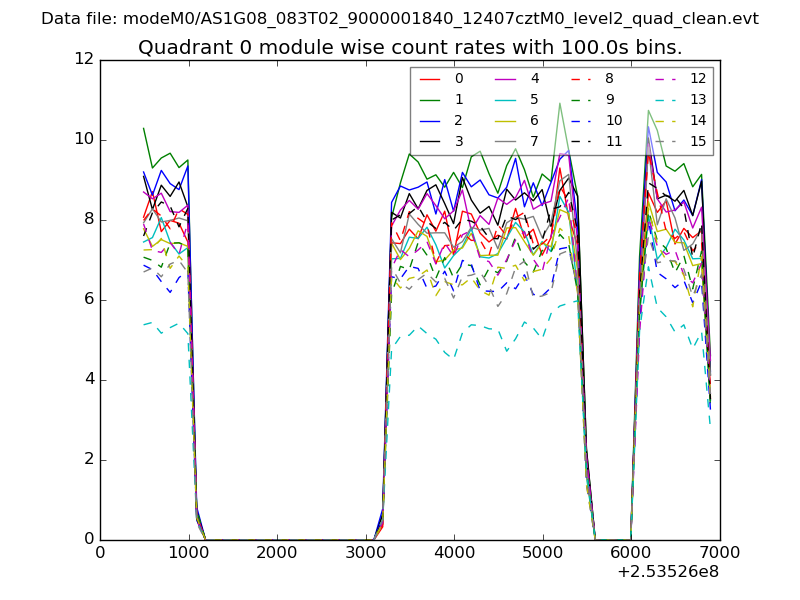 |
 |
| Module-wise count rates for Quadrant B Data is divided into 100 sec bins |
 |
 |
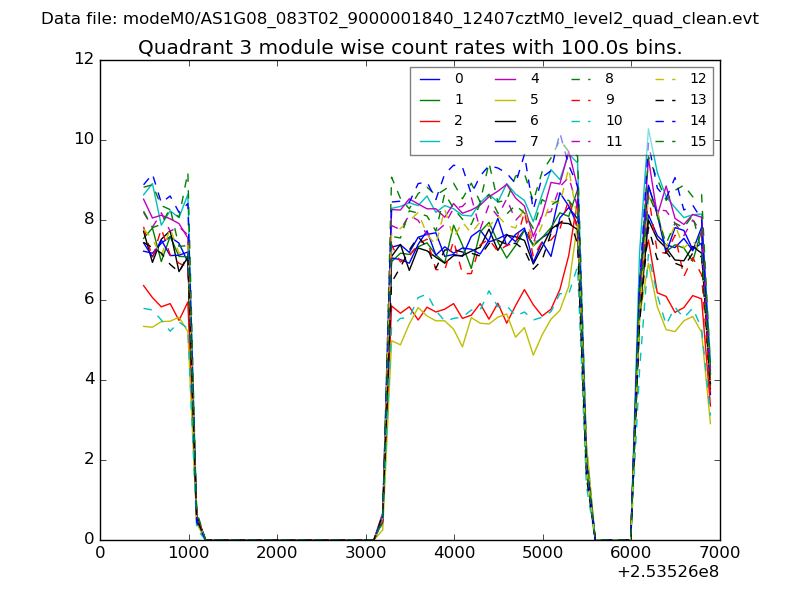
| Module-wise count rates for Quadrant C Data is divided into 100 sec bins |
 |
 |
| Module-wise count rates for Quadrant D Data is divided into 100 sec bins |
 |
 |
| Parameter | Plot |
|---|---|
| CZT HV Monitor | 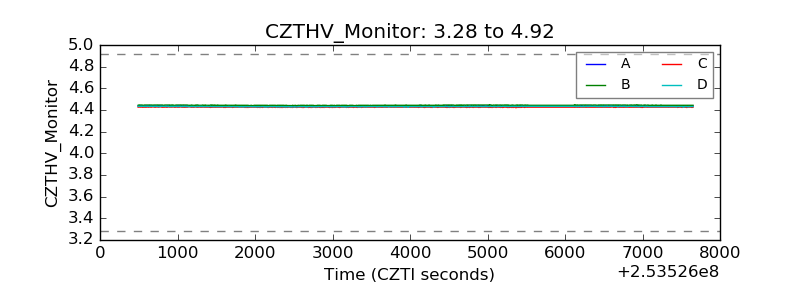 |
| D_VDD |  |
| Temperature 1 | 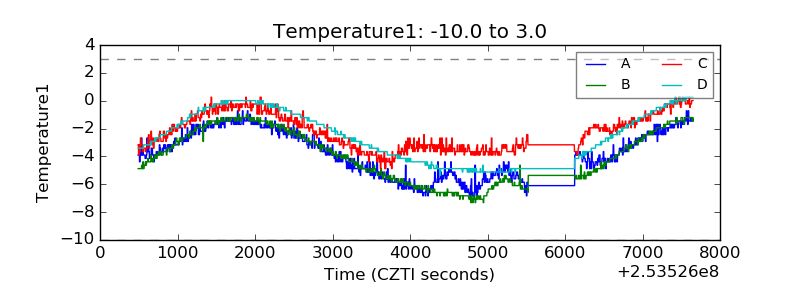 |
| Veto HV Monitor | 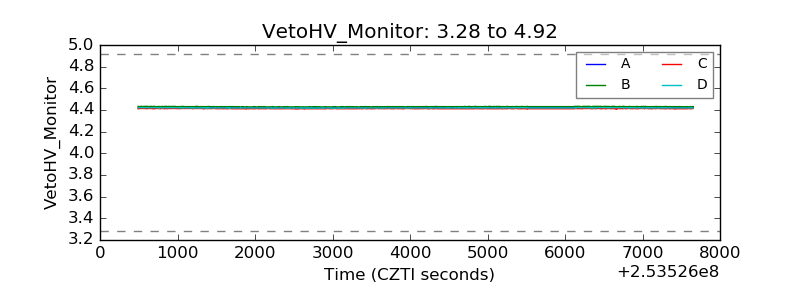 |
| Veto LLD | 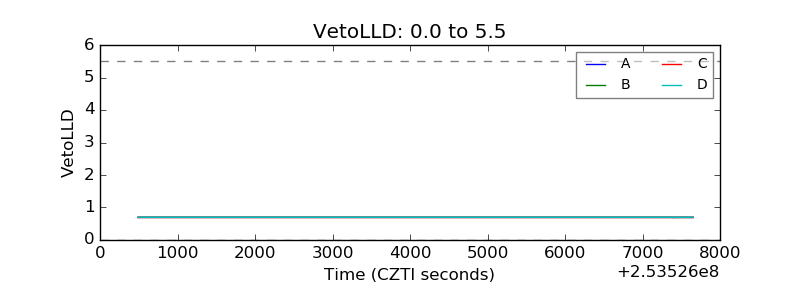 |
| Alpha Counter | 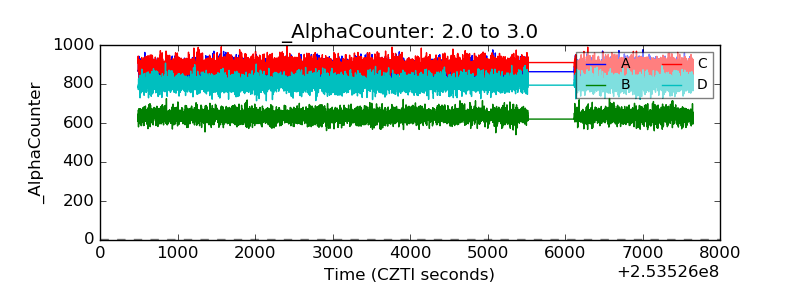 |
| _CPM_Rate | 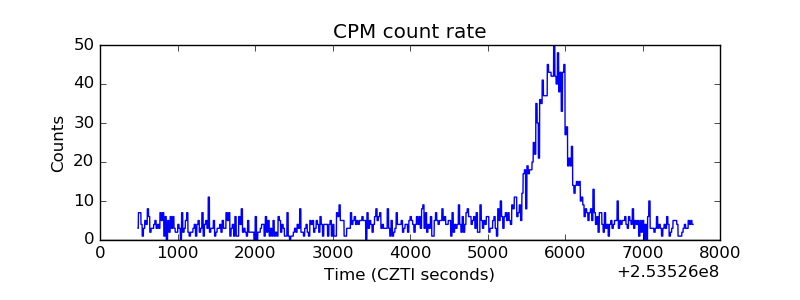 |
| CZT Counter | 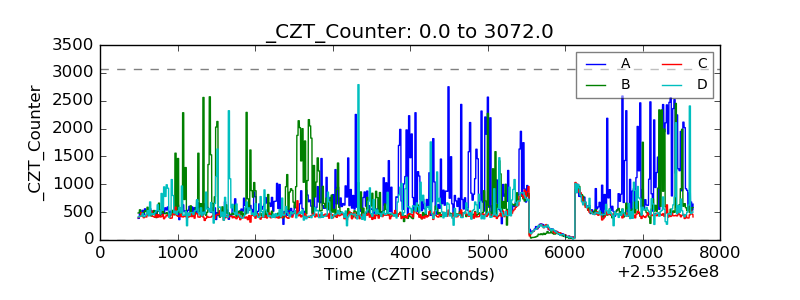 |
| +2.5 Volts monitor |  |
| +5 Volts monitor |  |
| _ROLL_ROT | 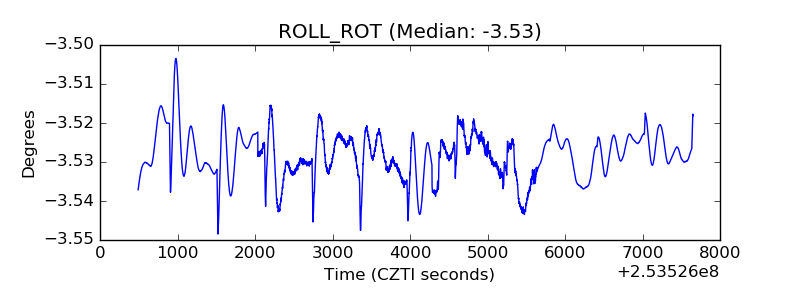 |
| _Roll_DEC | 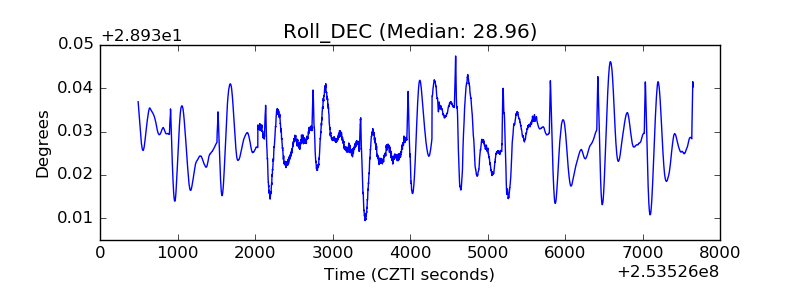 |
| _Roll_RA |  |
| Veto Counter | 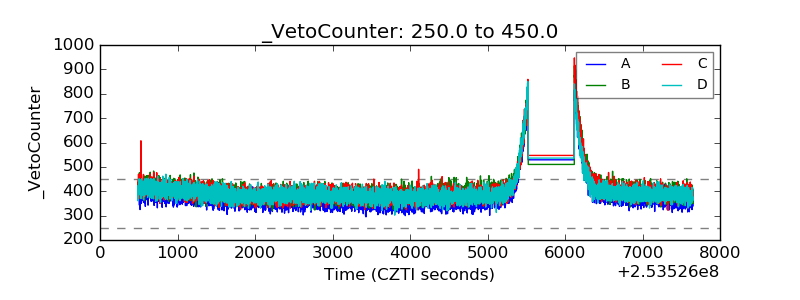 |