| Param | Original file | Final file |
|---|---|---|
| Filename | modeM0/AS1A04_023T01_9000001842_12408cztM0_level2.evt | modeM0/AS1A04_023T01_9000001842_12408cztM0_level2_quad_clean.evt |
| Size (bytes) | 261,898,560 | 44,398,080 |
| Size | 249.8 MB | 42.3 MB |
| Events in quadrant A | 1,996,149 | 277,979 |
| Events in quadrant B | 2,030,036 | 284,830 |
| Events in quadrant C | 1,613,981 | 280,247 |
| Events in quadrant D | 2,068,416 | 269,313 |
| Mode SS | |||
|---|---|---|---|
| Quadrant | BADHDUFLAG | Total packets | Discarded packets |
| A | 0 | 68 | 0 |
| B | 0 | 68 | 0 |
| C | 0 | 68 | 0 |
| D | 0 | 68 | 0 |
| Mode M0 | |||
|---|---|---|---|
| Quadrant | BADHDUFLAG | Total packets | Discarded packets |
| A | 0 | 8041 | 3 |
| B | 0 | 8073 | 2 |
| C | 0 | 6991 | 2 |
| D | 0 | 8328 | 2 |
| Mode M9 | |||
|---|---|---|---|
| Quadrant | BADHDUFLAG | Total packets | Discarded packets |
| A | 0 | 2 | 0 |
| B | 0 | 2 | 0 |
| C | 0 | 2 | 0 |
| D | 0 | 2 | 0 |
| Quadrant | Total seconds | Saturated seconds | Saturation percentage |
|---|---|---|---|
| A | 3253 | 208 | 6.394098% |
| B | 3253 | 313 | 9.621887% |
| C | 3253 | 175 | 5.379650% |
| D | 3253 | 190 | 5.840762% |
Noise dominated data is calculated using 1-second bins in cleaned event files. If a bin has >2000 counts, and if more than 50% of those come from <1% of pixels, then it is considered to be noise-dominated and hence unusable.
| Quadrant | # 1 sec bins | Bins with >0 counts | Bins with >2000 counts | High rate bins dominated by noise | Noise dominated (total time) | Noise dominated (detector-on time) | Marked lightcurve |
|---|---|---|---|---|---|---|---|
| A | 3494 | 3255 | 7 | 7 | 0.20% | 0.22% |  |
| B | 3494 | 3254 | 84 | 84 | 2.40% | 2.58% | 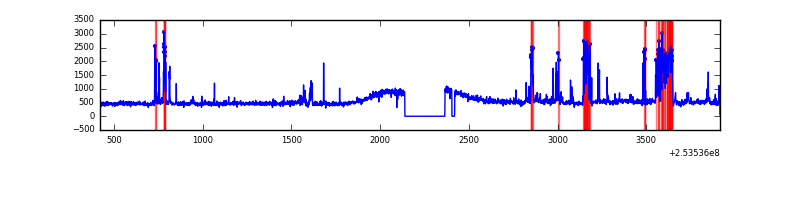 |
| C | 3494 | 3255 | 0 | 0 | 0.00% | 0.00% | 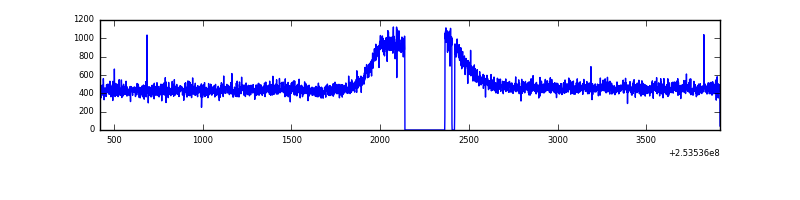 |
| D | 3494 | 3255 | 18 | 18 | 0.52% | 0.55% |  |
Top three noisy pixels from each quadrant. If the there are fewer than three noisy pixels in the level2.evt file, extra rows are filled as -1
| Pixel properties | Quadrant properties | ||||||
|---|---|---|---|---|---|---|---|
| Quadrant | DetID | PixID | Counts | Sigma | Mean | Median | Sigma |
| A | 12 | 189 | 104970 | 1185.59 | 422 | 411 | 88.2 |
| A | 14 | 237 | 83392 | 940.92 | 422 | 411 | 88.2 |
| A | 13 | 251 | 69759 | 786.34 | 422 | 411 | 88.2 |
| B | 4 | 239 | 353119 | 4226.94 | 415 | 403 | 83.4 |
| B | 3 | 209 | 15340 | 179.0 | 415 | 403 | 83.4 |
| B | 0 | 187 | 13467 | 156.56 | 415 | 403 | 83.4 |
| C | 8 | 128 | 3146 | 27.73 | 412 | 413 | 98.6 |
| C | 13 | 61 | 2980 | 26.05 | 412 | 413 | 98.6 |
| C | 8 | 112 | 1767 | 13.74 | 412 | 413 | 98.6 |
| D | 1 | 52 | 425411 | 4182.24 | 412 | 398 | 101.6 |
| D | 14 | 34 | 26147 | 253.38 | 412 | 398 | 101.6 |
| D | 7 | 80 | 19294 | 185.94 | 412 | 398 | 101.6 |
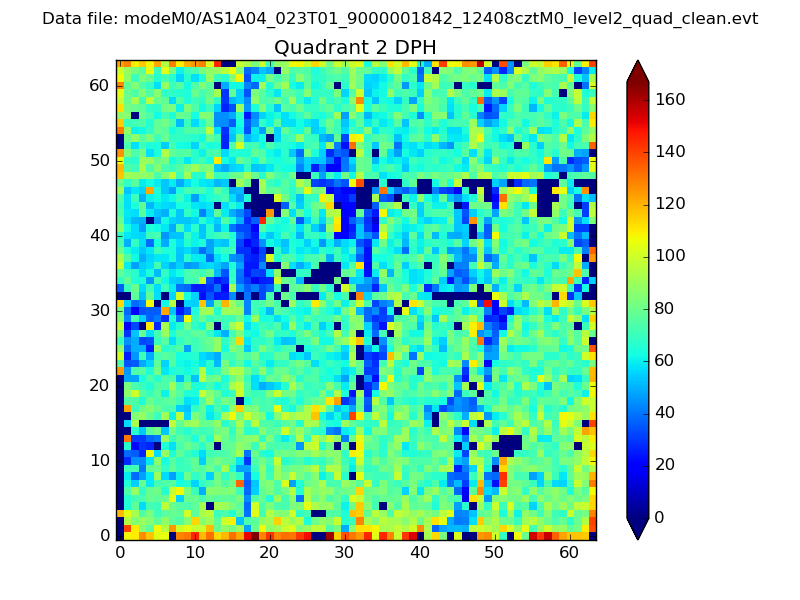
Histogram calculated using DETX and DETY for each event in the final _common_clean file
| Quadrant A | 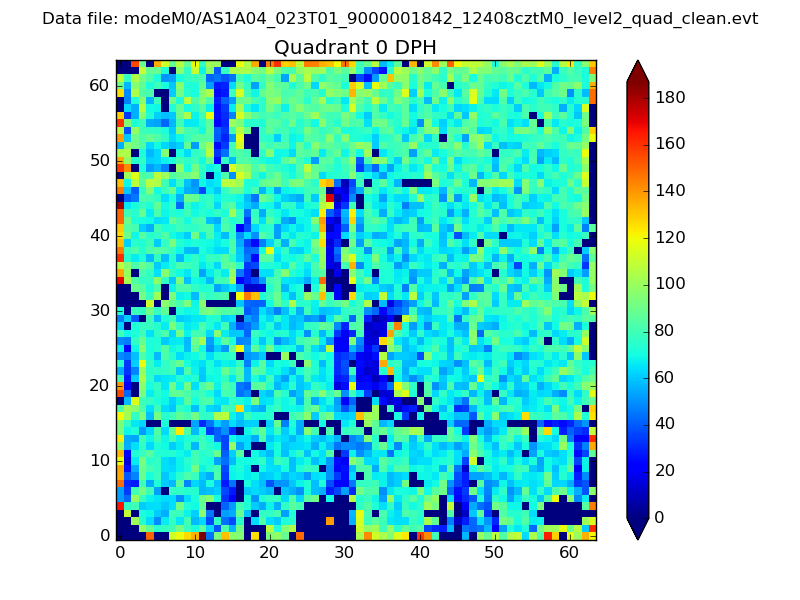 |
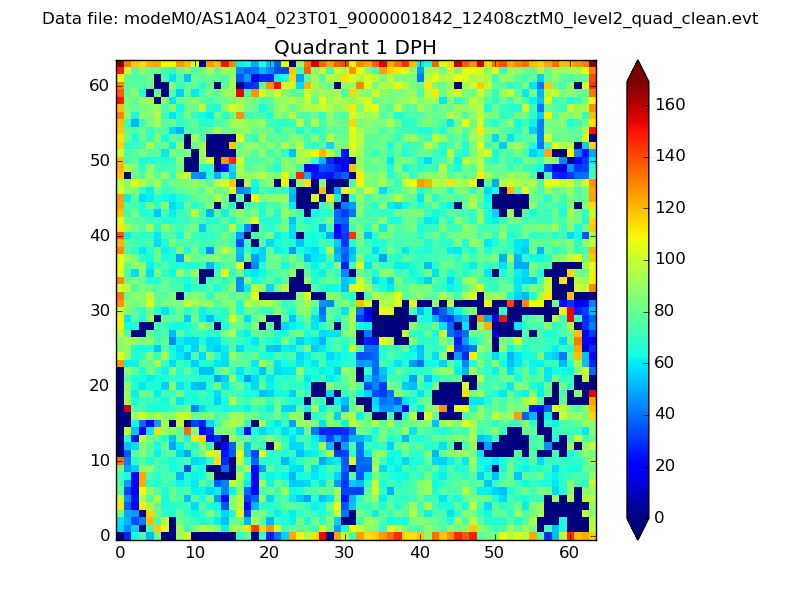 |
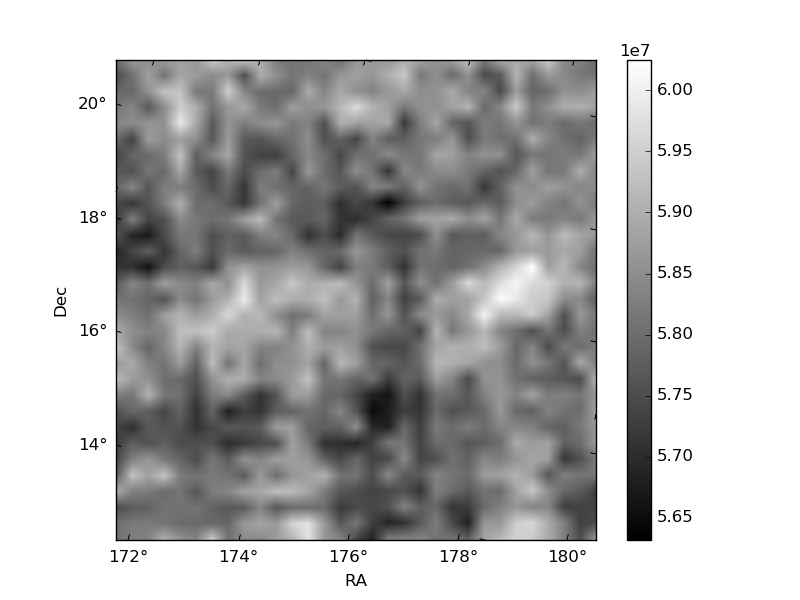
Quadrant B |
|---|---|---|---|
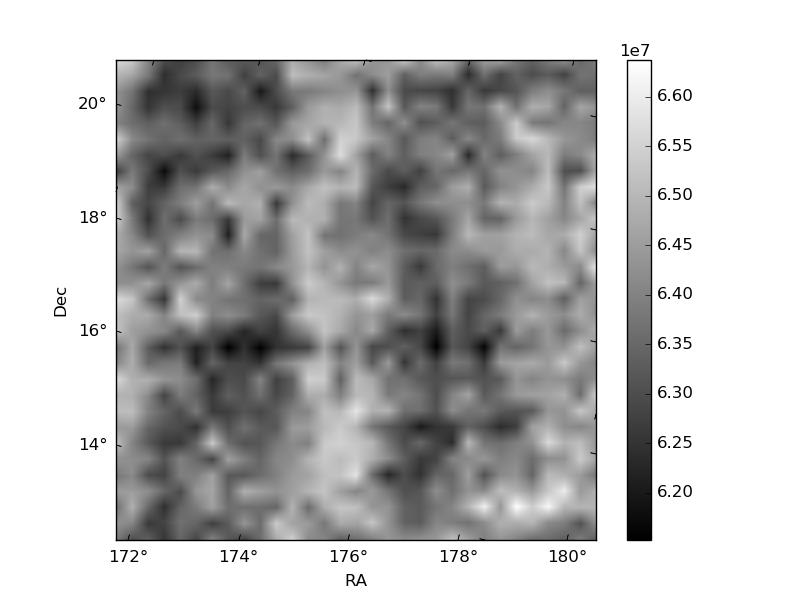
| Quadrant D | 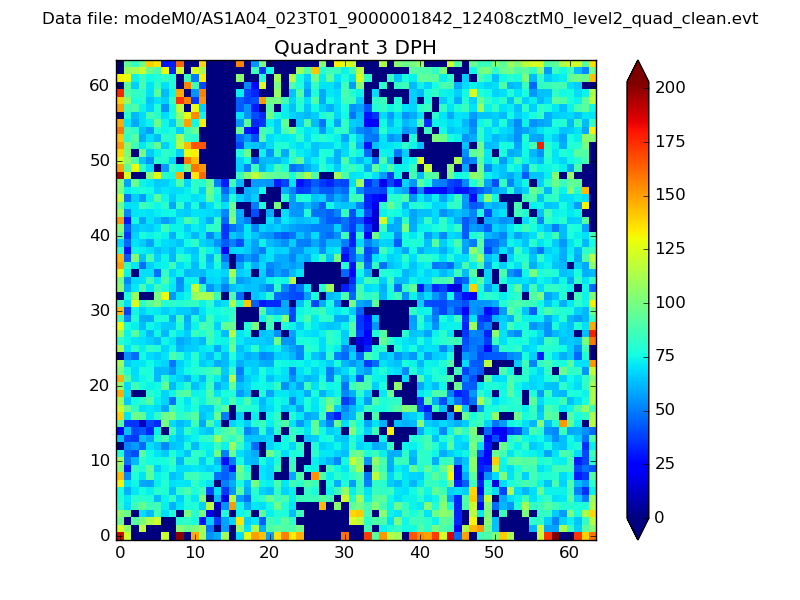 |
 |
Quadrant C |
| Plot type | Count rate plots | Images |
|---|---|---|
| Comparison with Poisson distribution Blue bars denote a histogram of data divided into 1 sec bins. Red curve is a Poisson curve with rate = median count rate of data. |
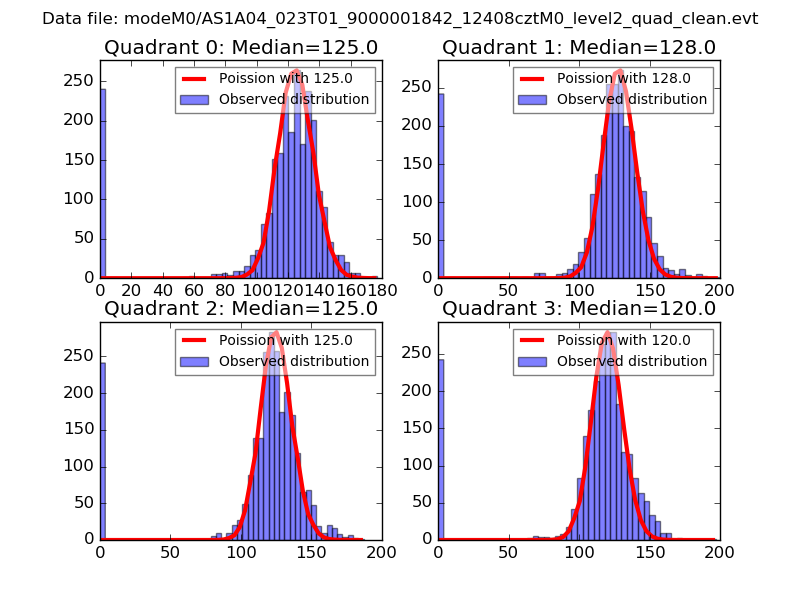 |
 |
| Quadrant-wise count rates Data is divided into 100 sec bins |
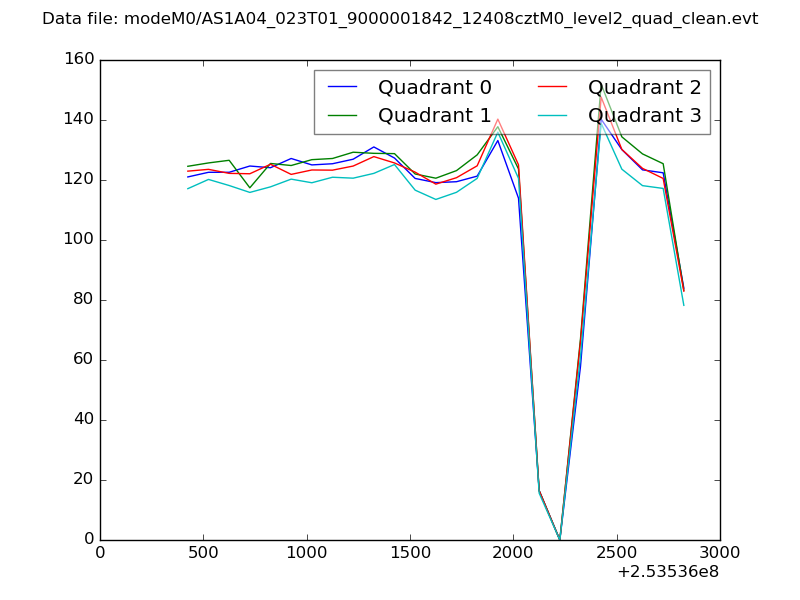 |
|
| Module-wise count rates for Quadrant A Data is divided into 100 sec bins |
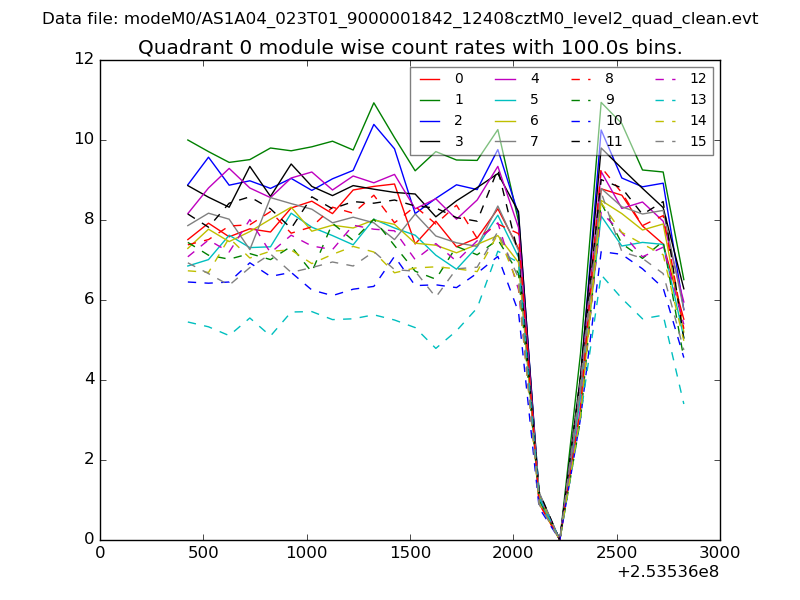 |
 |
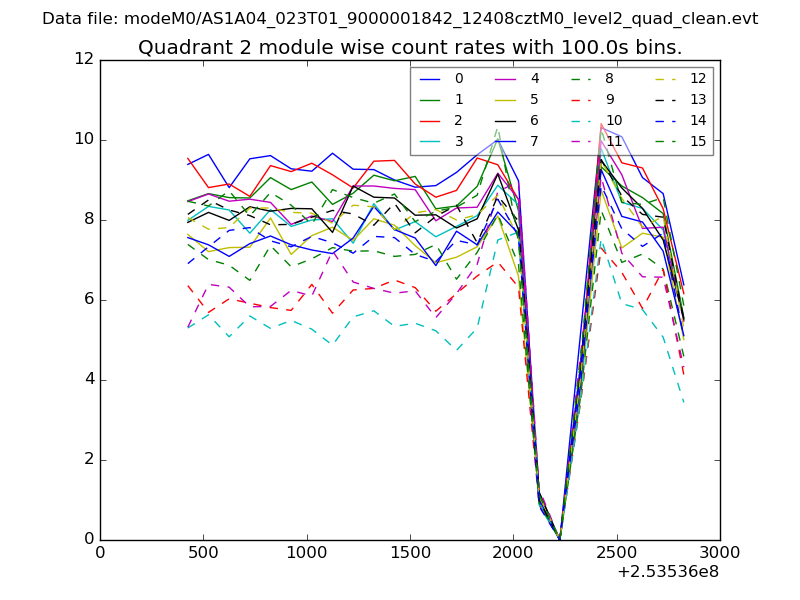
| Module-wise count rates for Quadrant B Data is divided into 100 sec bins |
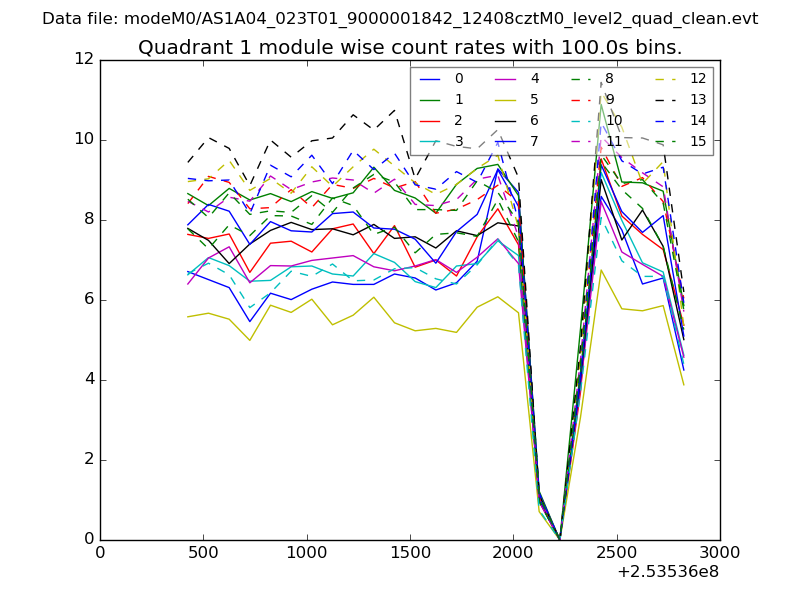 |
 |
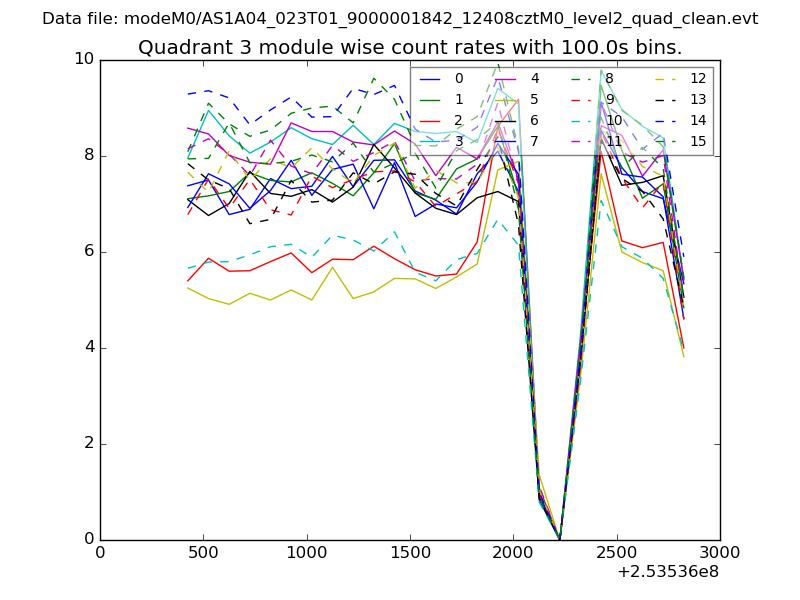
| Module-wise count rates for Quadrant C Data is divided into 100 sec bins |
 |
 |
| Module-wise count rates for Quadrant D Data is divided into 100 sec bins |
 |
 |
| Parameter | Plot |
|---|---|
| CZT HV Monitor | 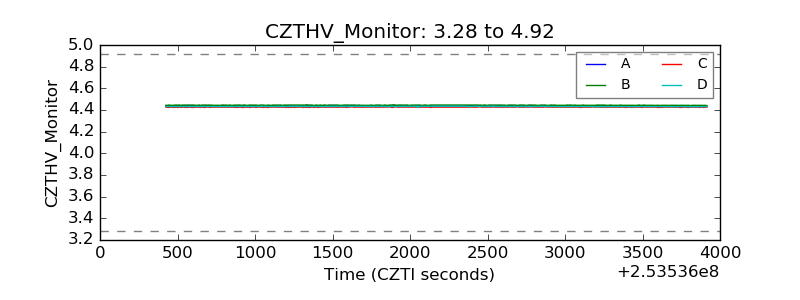 |
| D_VDD |  |
| Temperature 1 | 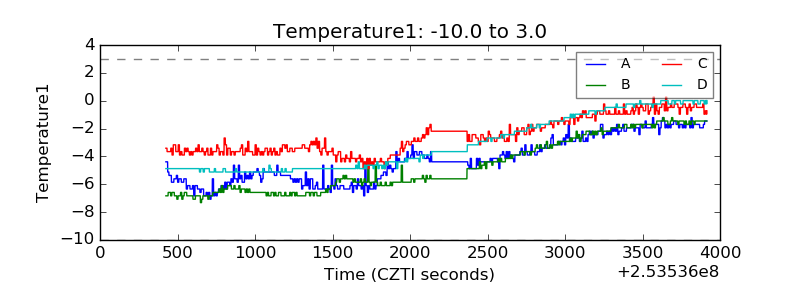 |
| Veto HV Monitor |  |
| Veto LLD | 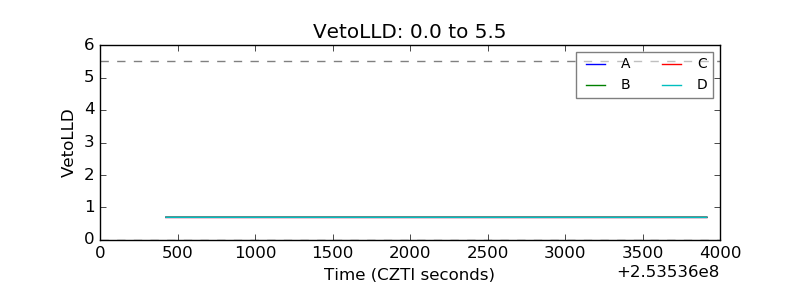 |
| Alpha Counter | 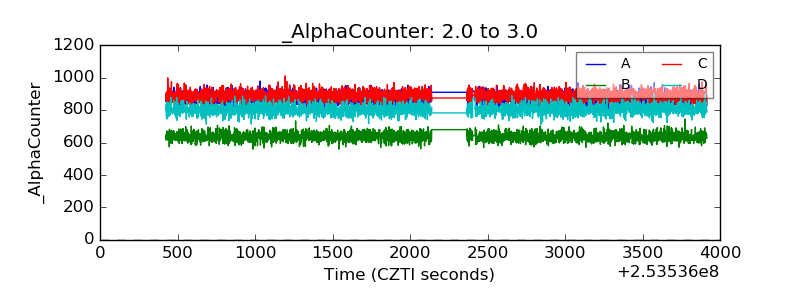 |
| _CPM_Rate | 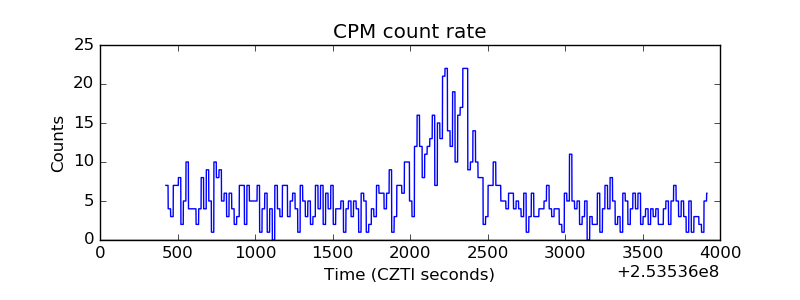 |
| CZT Counter | 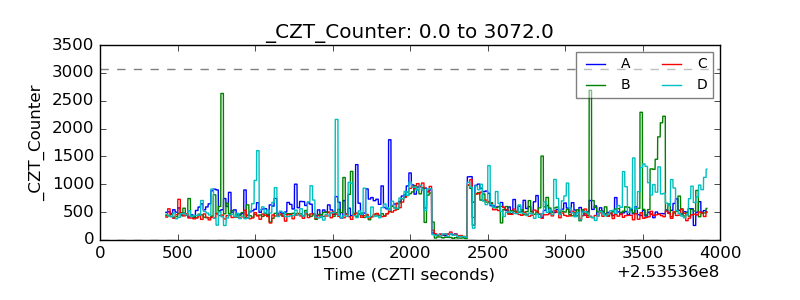 |
| +2.5 Volts monitor |  |
| +5 Volts monitor |  |
| _ROLL_ROT | 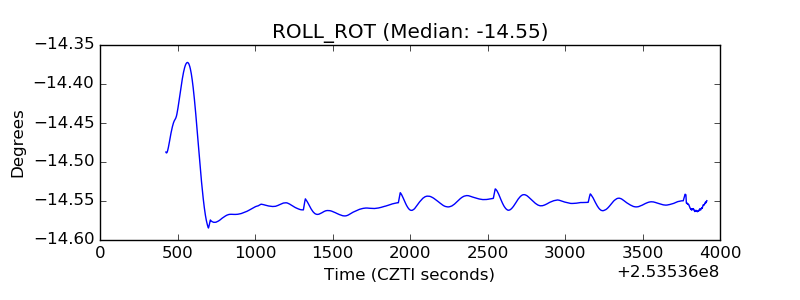 |
| _Roll_DEC | 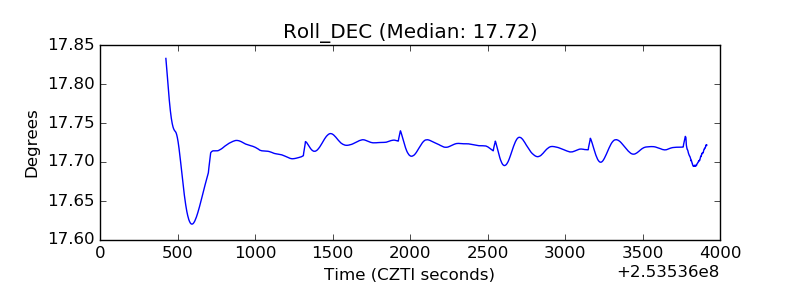 |
| _Roll_RA |  |
| Veto Counter | 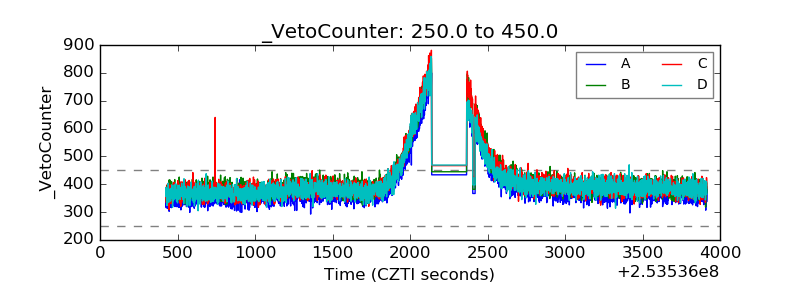 |