| Param | Original file | Final file |
|---|---|---|
| Filename | modeM0/AS1A04_023T01_9000001842_12409cztM0_level2.evt | modeM0/AS1A04_023T01_9000001842_12409cztM0_level2_quad_clean.evt |
| Size (bytes) | 653,895,360 | 81,645,120 |
| Size | 623.6 MB | 77.9 MB |
| Events in quadrant A | 5,225,153 | 474,304 |
| Events in quadrant B | 5,002,449 | 488,642 |
| Events in quadrant C | 3,753,516 | 492,467 |
| Events in quadrant D | 5,290,381 | 470,478 |
| Mode SS | |||
|---|---|---|---|
| Quadrant | BADHDUFLAG | Total packets | Discarded packets |
| A | 0 | 162 | 0 |
| B | 0 | 162 | 0 |
| C | 0 | 162 | 0 |
| D | 0 | 162 | 0 |
| Mode M0 | |||
|---|---|---|---|
| Quadrant | BADHDUFLAG | Total packets | Discarded packets |
| A | 0 | 20588 | 4 |
| B | 0 | 19830 | 3 |
| C | 0 | 16560 | 3 |
| D | 0 | 21024 | 3 |
| Mode M9 | |||
|---|---|---|---|
| Quadrant | BADHDUFLAG | Total packets | Discarded packets |
| A | 0 | 4 | 0 |
| B | 0 | 4 | 0 |
| C | 0 | 4 | 0 |
| D | 0 | 4 | 0 |
| Quadrant | Total seconds | Saturated seconds | Saturation percentage |
|---|---|---|---|
| A | 7847 | 491 | 6.257168% |
| B | 7847 | 581 | 7.404103% |
| C | 7847 | 269 | 3.428062% |
| D | 7847 | 377 | 4.804384% |
Noise dominated data is calculated using 1-second bins in cleaned event files. If a bin has >2000 counts, and if more than 50% of those come from <1% of pixels, then it is considered to be noise-dominated and hence unusable.
| Quadrant | # 1 sec bins | Bins with >0 counts | Bins with >2000 counts | High rate bins dominated by noise | Noise dominated (total time) | Noise dominated (detector-on time) | Marked lightcurve |
|---|---|---|---|---|---|---|---|
| A | 8323 | 7849 | 164 | 164 | 1.97% | 2.09% | 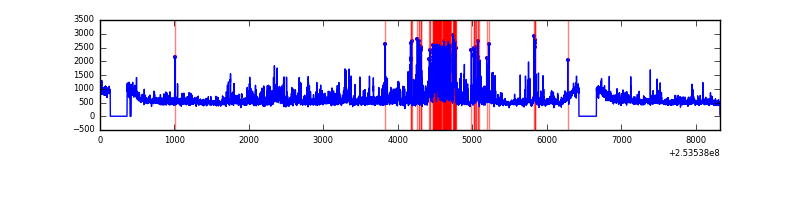 |
| B | 8323 | 7848 | 220 | 220 | 2.64% | 2.80% | 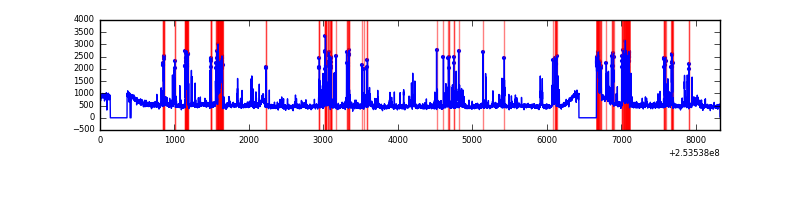 |
| C | 8323 | 7849 | 1 | 1 | 0.01% | 0.01% | 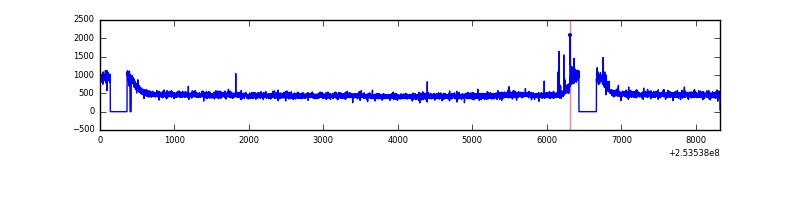 |
| D | 8323 | 7849 | 76 | 76 | 0.91% | 0.97% | 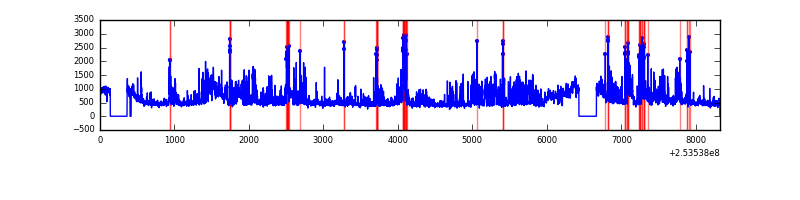 |
Top three noisy pixels from each quadrant. If the there are fewer than three noisy pixels in the level2.evt file, extra rows are filled as -1
| Pixel properties | Quadrant properties | ||||||
|---|---|---|---|---|---|---|---|
| Quadrant | DetID | PixID | Counts | Sigma | Mean | Median | Sigma |
| A | 14 | 237 | 806008 | 4003.66 | 967 | 944 | 201.1 |
| A | 13 | 251 | 294485 | 1459.81 | 967 | 944 | 201.1 |
| A | 1 | 162 | 141443 | 698.71 | 967 | 944 | 201.1 |
| B | 4 | 239 | 688795 | 3722.44 | 952 | 927 | 184.8 |
| B | 3 | 64 | 386451 | 2086.29 | 952 | 927 | 184.8 |
| B | 3 | 209 | 61259 | 326.49 | 952 | 927 | 184.8 |
| C | 15 | 208 | 23619 | 101.58 | 952 | 955 | 223.1 |
| C | 8 | 128 | 9727 | 39.32 | 952 | 955 | 223.1 |
| C | 13 | 61 | 6788 | 26.14 | 952 | 955 | 223.1 |
| D | 1 | 52 | 1287004 | 5535.85 | 949 | 920 | 232.3 |
| D | 7 | 80 | 151825 | 649.56 | 949 | 920 | 232.3 |
| D | 13 | 104 | 85146 | 362.54 | 949 | 920 | 232.3 |
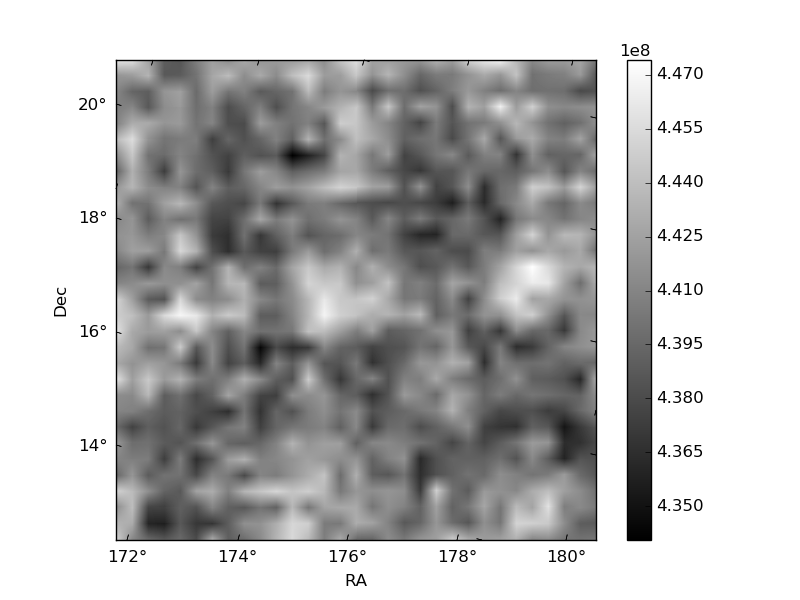
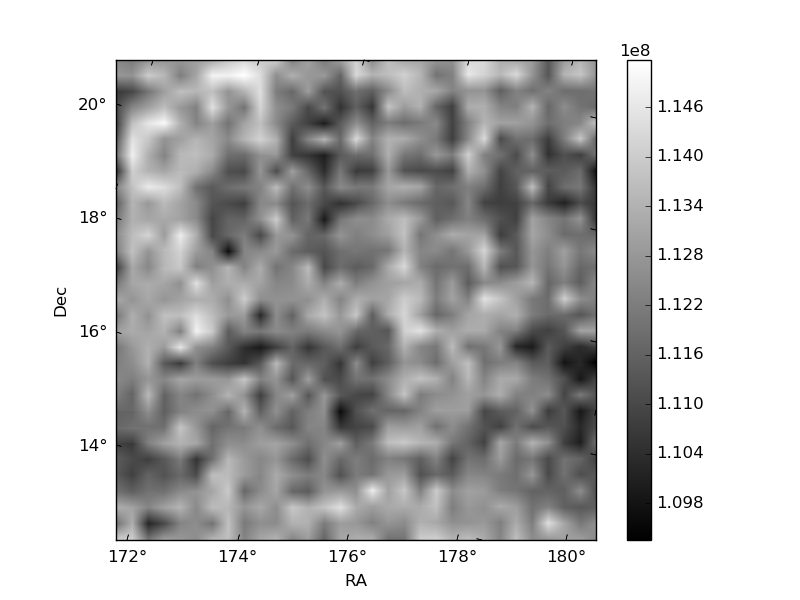
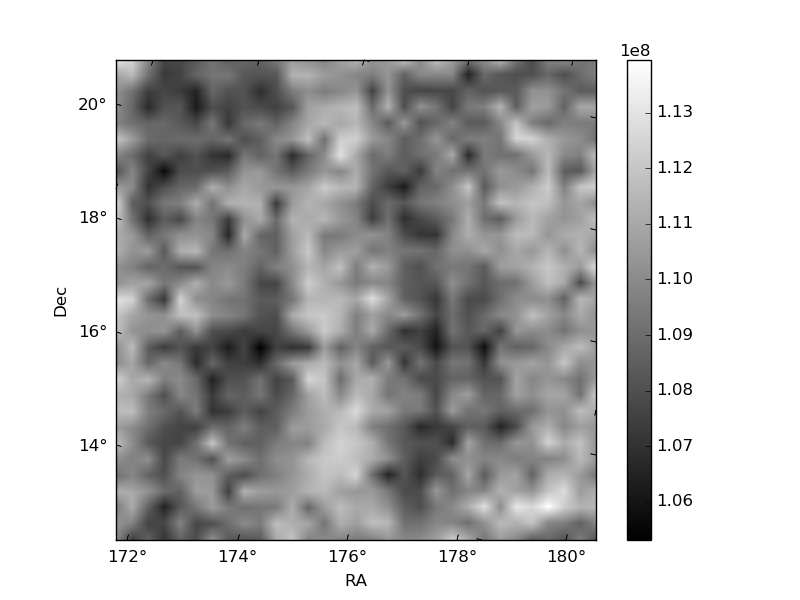
Histogram calculated using DETX and DETY for each event in the final _common_clean file
| Quadrant A | 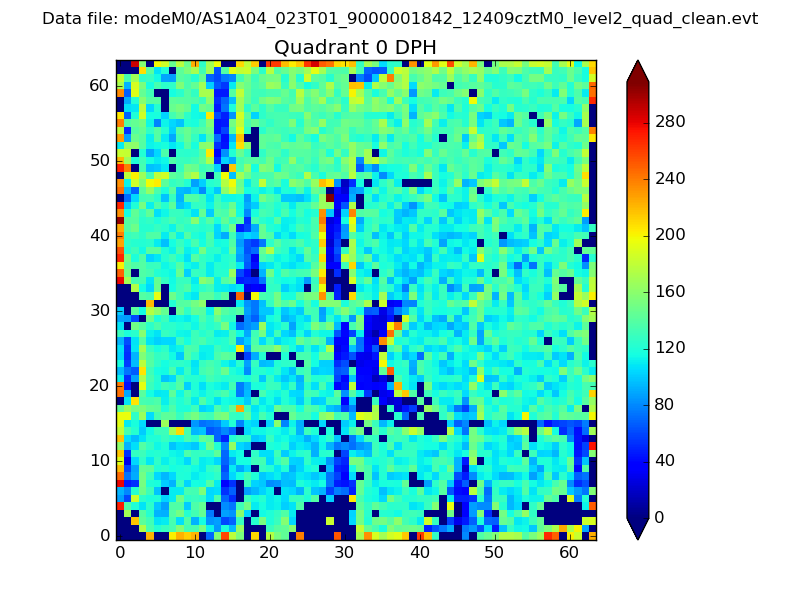 |
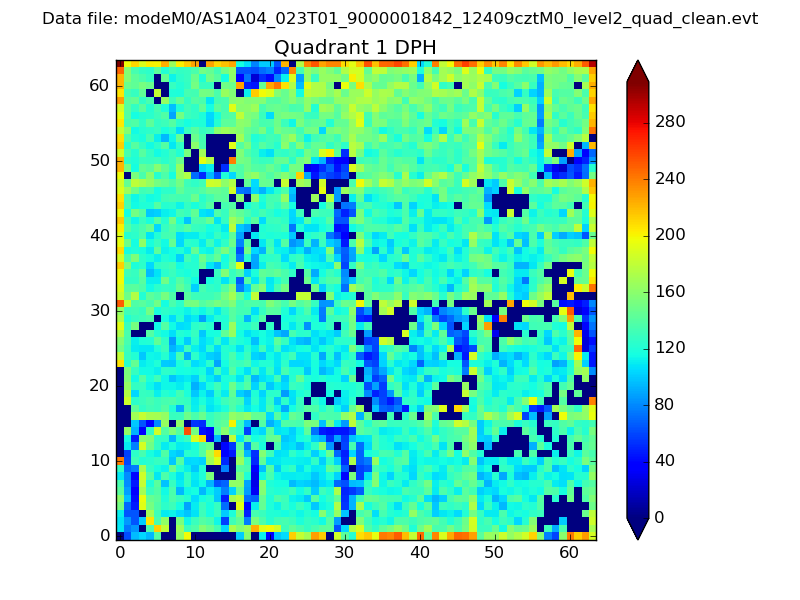 |
Quadrant B |
|---|---|---|---|
| Quadrant D | 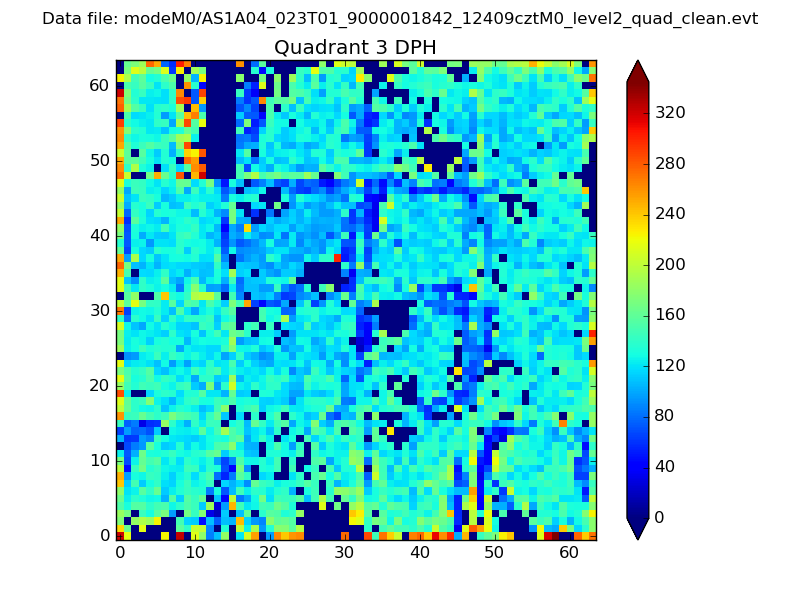 |
 |
Quadrant C |
| Plot type | Count rate plots | Images |
|---|---|---|
| Comparison with Poisson distribution Blue bars denote a histogram of data divided into 1 sec bins. Red curve is a Poisson curve with rate = median count rate of data. |
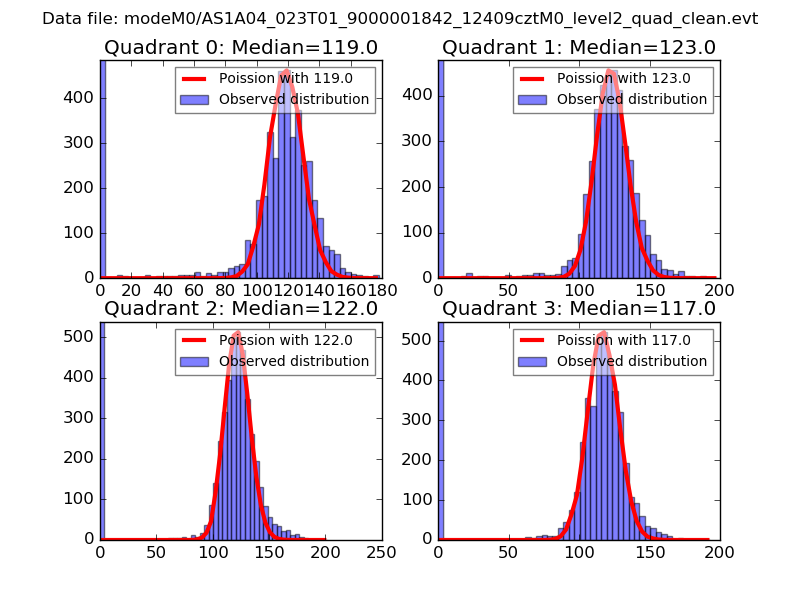 |
 |
| Quadrant-wise count rates Data is divided into 100 sec bins |
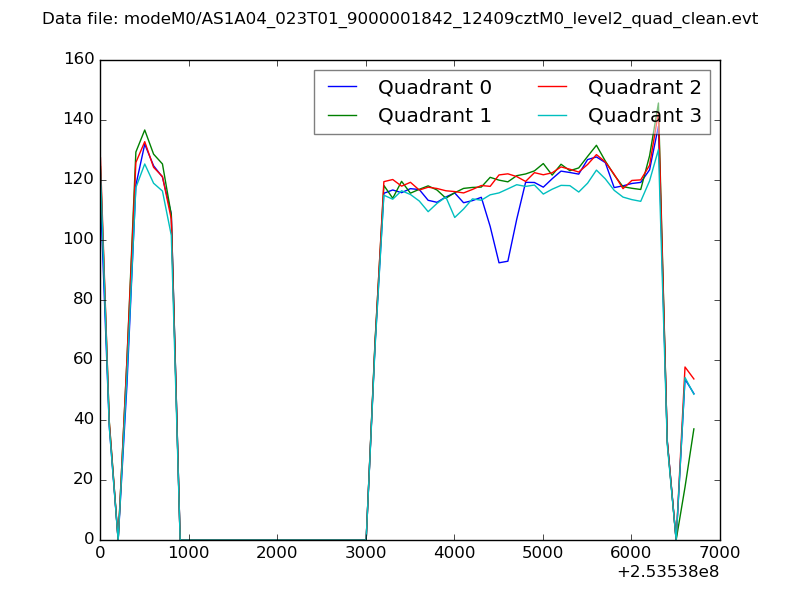 |
|
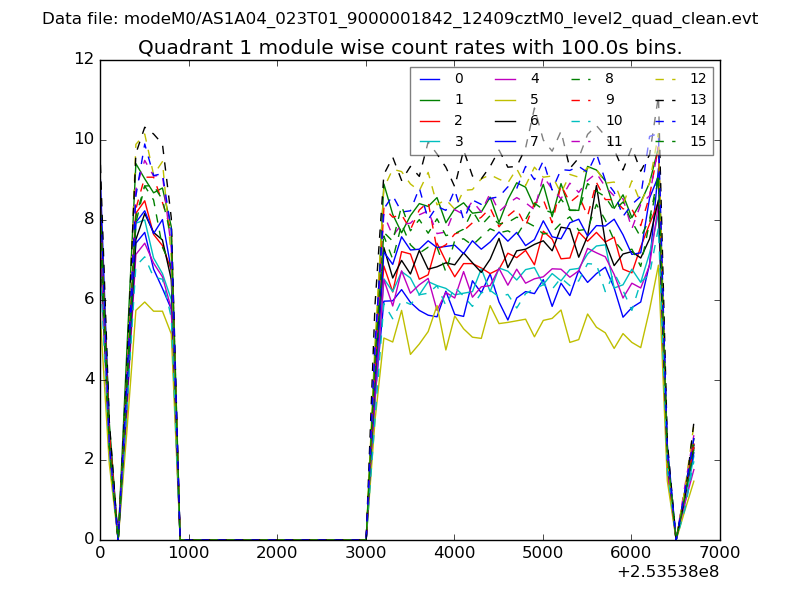
| Module-wise count rates for Quadrant A Data is divided into 100 sec bins |
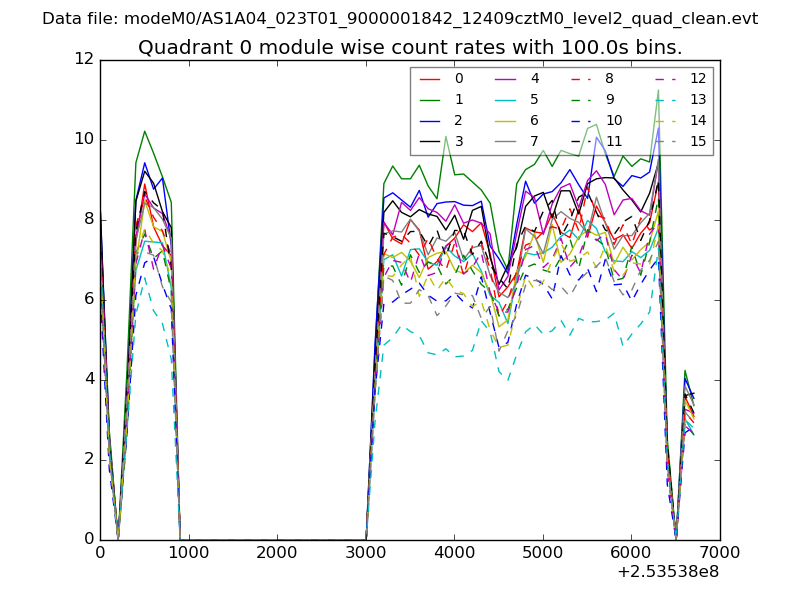 |
 |
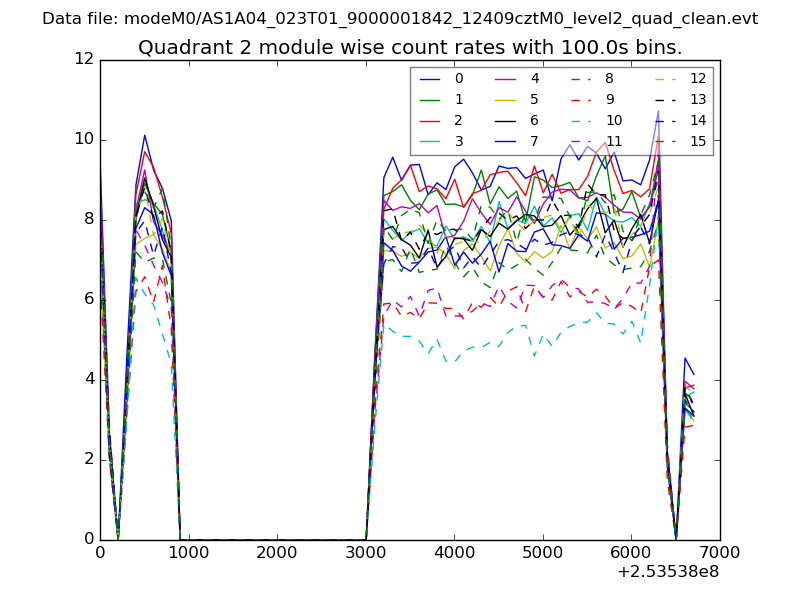
| Module-wise count rates for Quadrant B Data is divided into 100 sec bins |
 |
 |
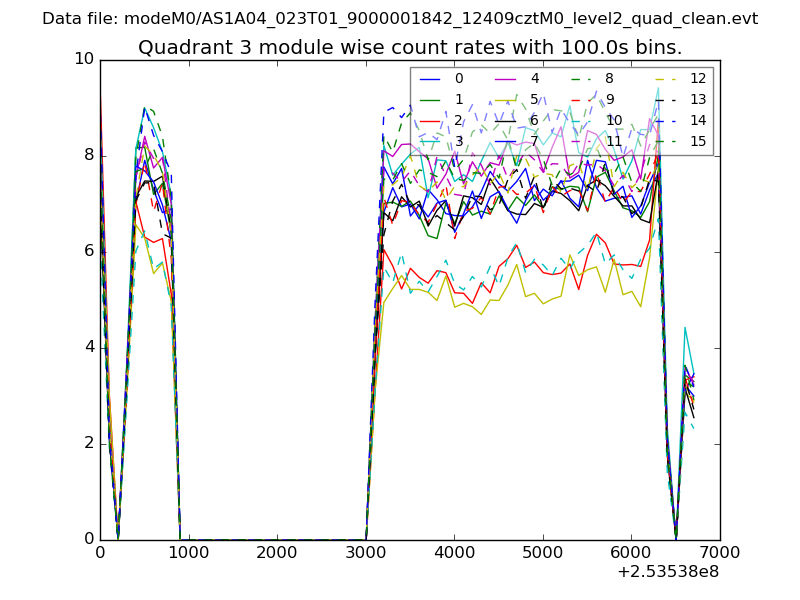
| Module-wise count rates for Quadrant C Data is divided into 100 sec bins |
 |
 |
| Module-wise count rates for Quadrant D Data is divided into 100 sec bins |
 |
 |
| Parameter | Plot |
|---|---|
| CZT HV Monitor |  |
| D_VDD |  |
| Temperature 1 | 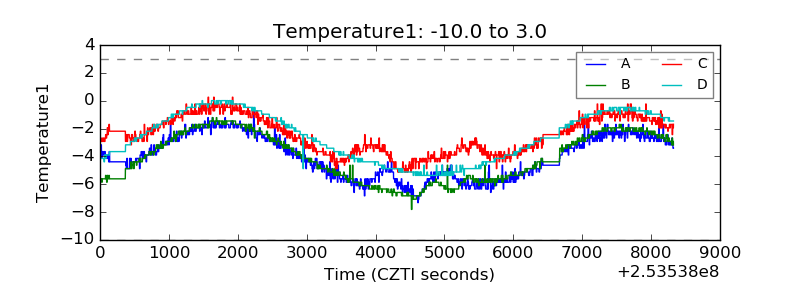 |
| Veto HV Monitor | 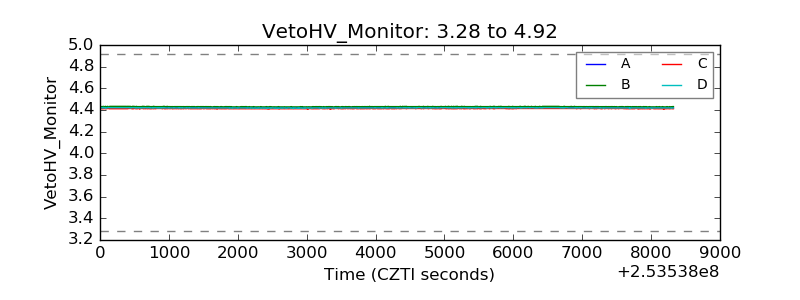 |
| Veto LLD | 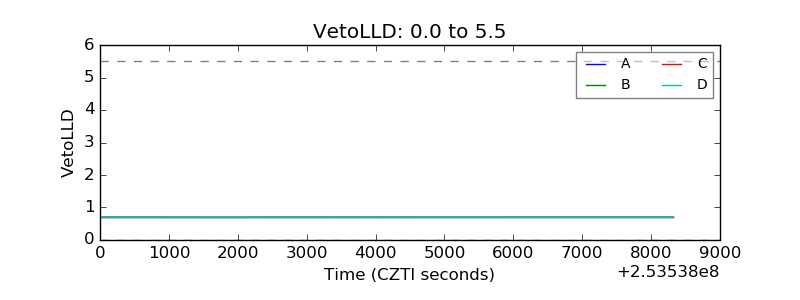 |
| Alpha Counter | 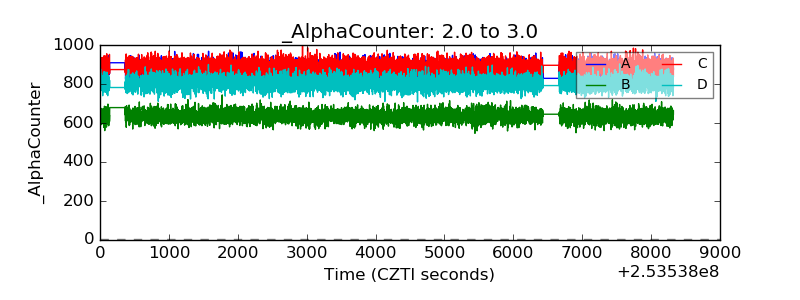 |
| _CPM_Rate | 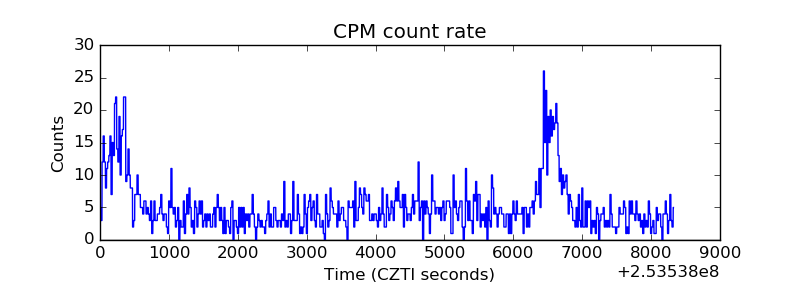 |
| CZT Counter |  |
| +2.5 Volts monitor |  |
| +5 Volts monitor |  |
| _ROLL_ROT | 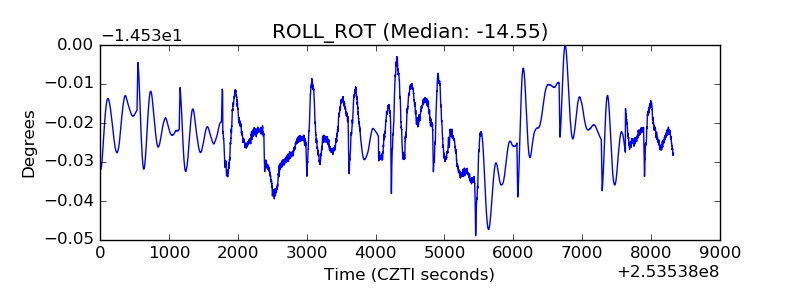 |
| _Roll_DEC | 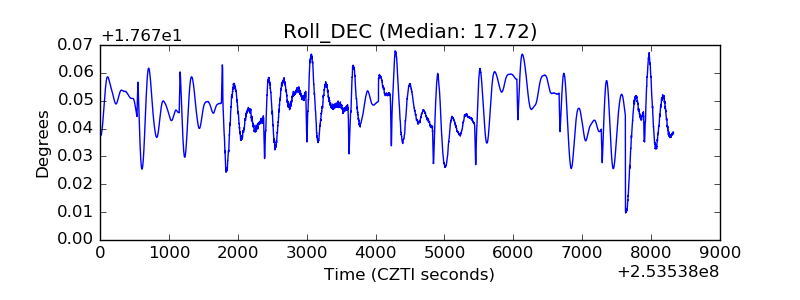 |
| _Roll_RA | 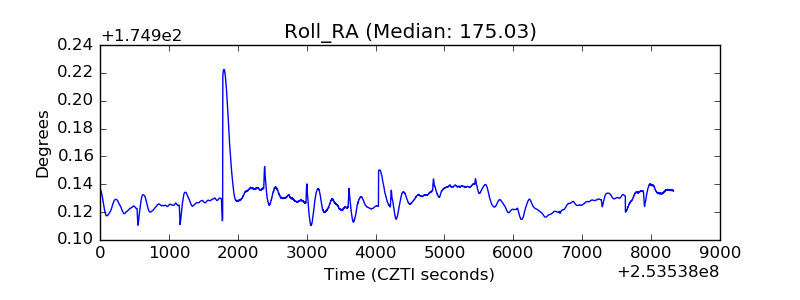 |
| Veto Counter | 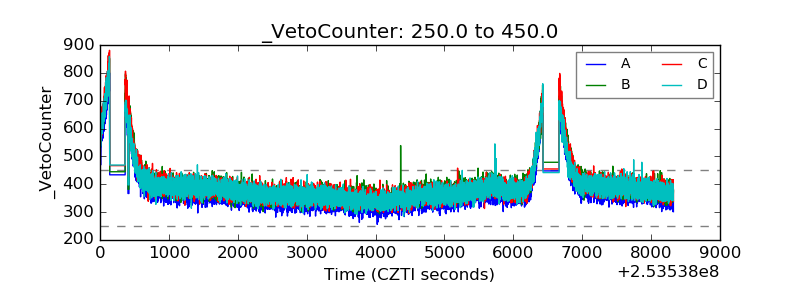 |