| Param | Original file | Final file |
|---|---|---|
| Filename | modeM0/AS1A04_023T01_9000001842_12410cztM0_level2.evt | modeM0/AS1A04_023T01_9000001842_12410cztM0_level2_quad_clean.evt |
| Size (bytes) | 599,987,520 | 81,426,240 |
| Size | 572.2 MB | 77.7 MB |
| Events in quadrant A | 4,341,917 | 484,335 |
| Events in quadrant B | 4,610,452 | 482,016 |
| Events in quadrant C | 3,728,027 | 485,529 |
| Events in quadrant D | 4,955,233 | 465,021 |
| Mode SS | |||
|---|---|---|---|
| Quadrant | BADHDUFLAG | Total packets | Discarded packets |
| A | 0 | 164 | 0 |
| B | 0 | 164 | 0 |
| C | 0 | 164 | 0 |
| D | 0 | 164 | 0 |
| Mode M0 | |||
|---|---|---|---|
| Quadrant | BADHDUFLAG | Total packets | Discarded packets |
| A | 0 | 17823 | 3 |
| B | 0 | 18767 | 2 |
| C | 0 | 16475 | 2 |
| D | 0 | 20123 | 2 |
| Mode M9 | |||
|---|---|---|---|
| Quadrant | BADHDUFLAG | Total packets | Discarded packets |
| A | 0 | 6 | 0 |
| B | 0 | 6 | 0 |
| C | 0 | 6 | 0 |
| D | 0 | 6 | 0 |
| Quadrant | Total seconds | Saturated seconds | Saturation percentage |
|---|---|---|---|
| A | 7881 | 217 | 2.753458% |
| B | 7881 | 370 | 4.694836% |
| C | 7881 | 160 | 2.030199% |
| D | 7881 | 402 | 5.100876% |
Noise dominated data is calculated using 1-second bins in cleaned event files. If a bin has >2000 counts, and if more than 50% of those come from <1% of pixels, then it is considered to be noise-dominated and hence unusable.
| Quadrant | # 1 sec bins | Bins with >0 counts | Bins with >2000 counts | High rate bins dominated by noise | Noise dominated (total time) | Noise dominated (detector-on time) | Marked lightcurve |
|---|---|---|---|---|---|---|---|
| A | 8517 | 7882 | 2 | 2 | 0.02% | 0.03% | 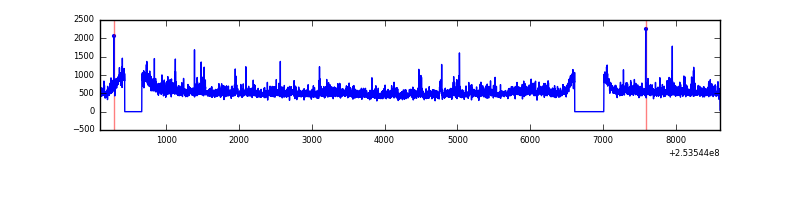 |
| B | 8517 | 7882 | 119 | 119 | 1.40% | 1.51% | 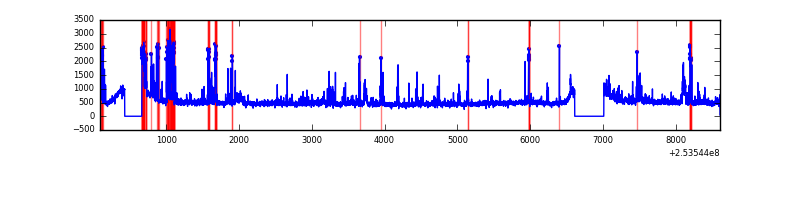 |
| C | 8517 | 7882 | 1 | 1 | 0.01% | 0.01% | 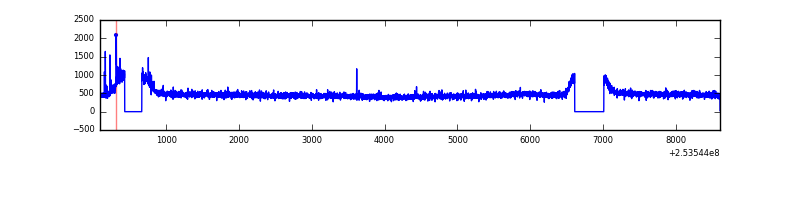 |
| D | 8517 | 7882 | 118 | 118 | 1.39% | 1.50% | 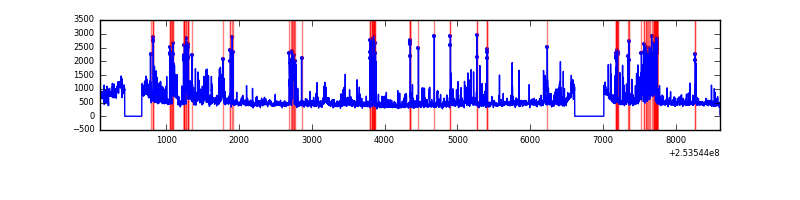 |
Top three noisy pixels from each quadrant. If the there are fewer than three noisy pixels in the level2.evt file, extra rows are filled as -1
| Pixel properties | Quadrant properties | ||||||
|---|---|---|---|---|---|---|---|
| Quadrant | DetID | PixID | Counts | Sigma | Mean | Median | Sigma |
| A | 1 | 162 | 146162 | 720.22 | 974 | 952 | 201.6 |
| A | 13 | 251 | 123139 | 606.03 | 974 | 952 | 201.6 |
| A | 1 | 178 | 76016 | 372.31 | 974 | 952 | 201.6 |
| B | 4 | 239 | 379514 | 2025.62 | 956 | 931 | 186.9 |
| B | 3 | 64 | 289120 | 1541.96 | 956 | 931 | 186.9 |
| B | 3 | 209 | 64182 | 338.43 | 956 | 931 | 186.9 |
| C | 15 | 208 | 23609 | 102.11 | 948 | 952 | 221.9 |
| C | 13 | 61 | 6864 | 26.64 | 948 | 952 | 221.9 |
| C | 8 | 128 | 4388 | 15.49 | 948 | 952 | 221.9 |
| D | 1 | 52 | 966902 | 4240.37 | 935 | 908 | 227.8 |
| D | 10 | 157 | 136354 | 594.56 | 935 | 908 | 227.8 |
| D | 13 | 104 | 102779 | 447.18 | 935 | 908 | 227.8 |
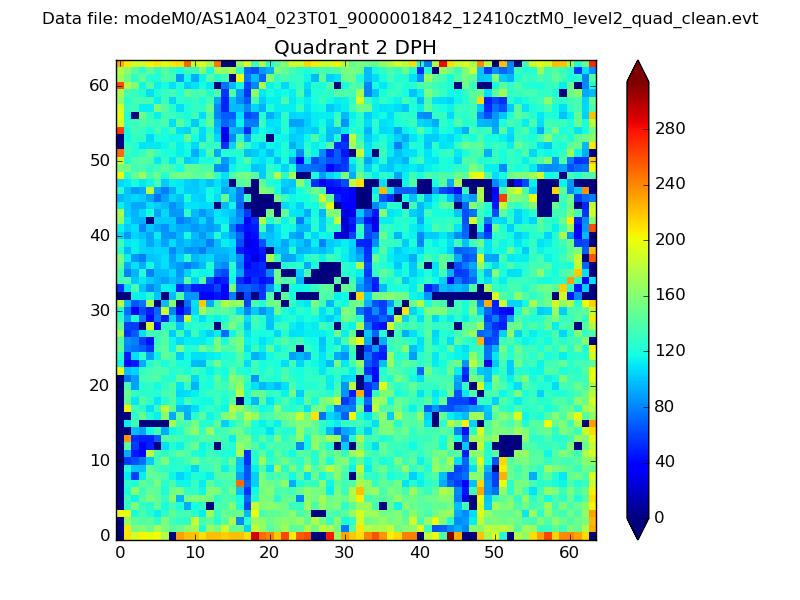
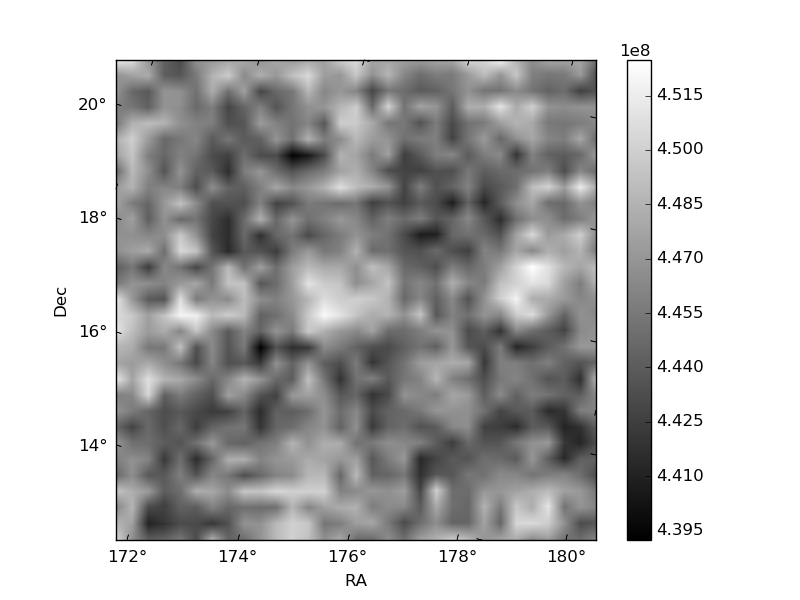
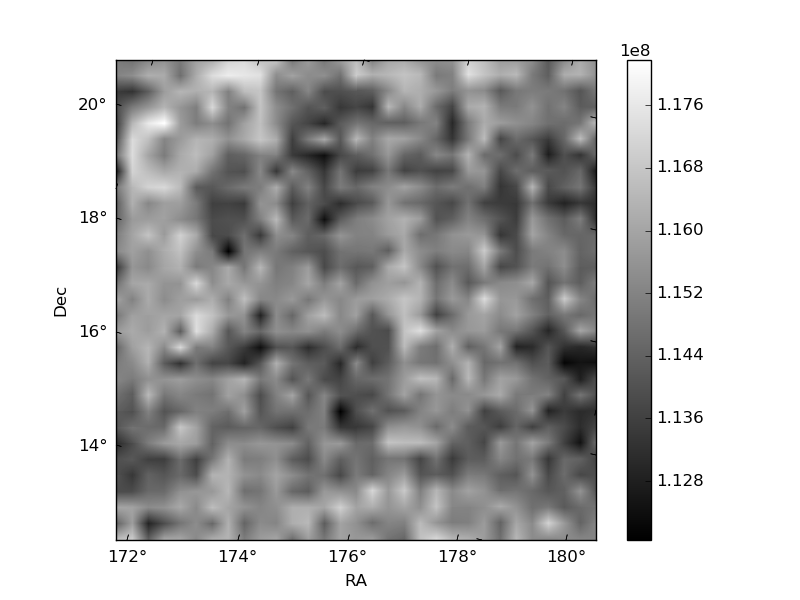
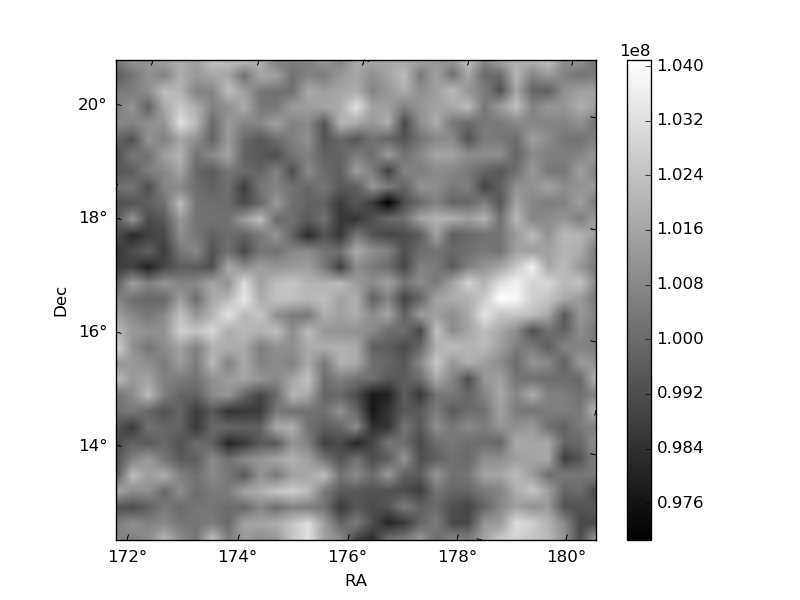
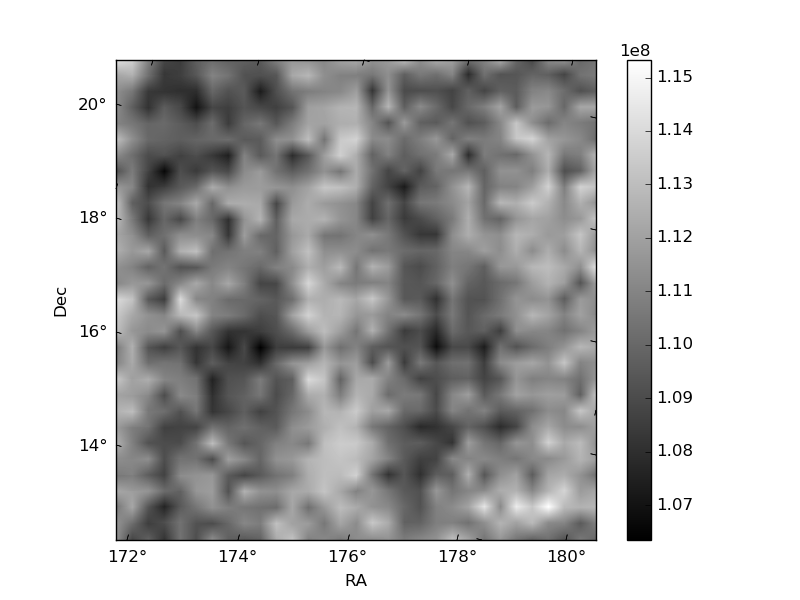
Histogram calculated using DETX and DETY for each event in the final _common_clean file
| Quadrant A | 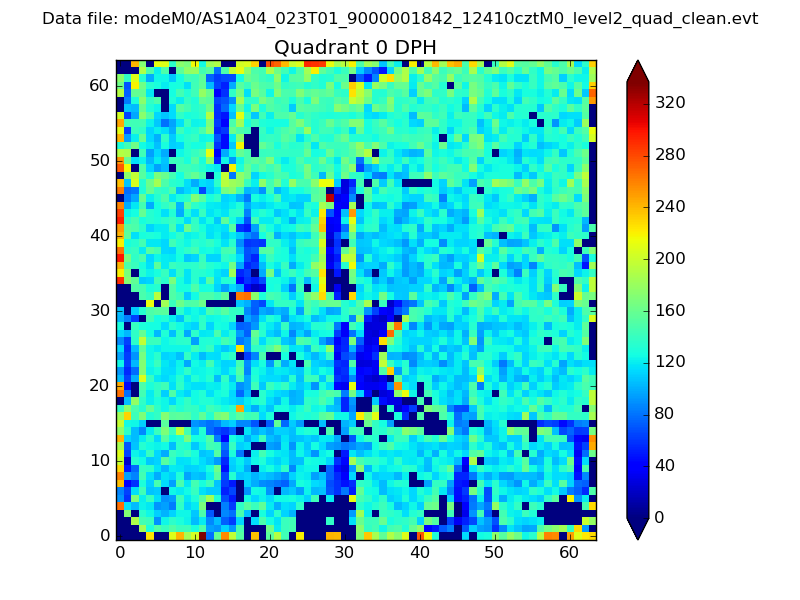 |
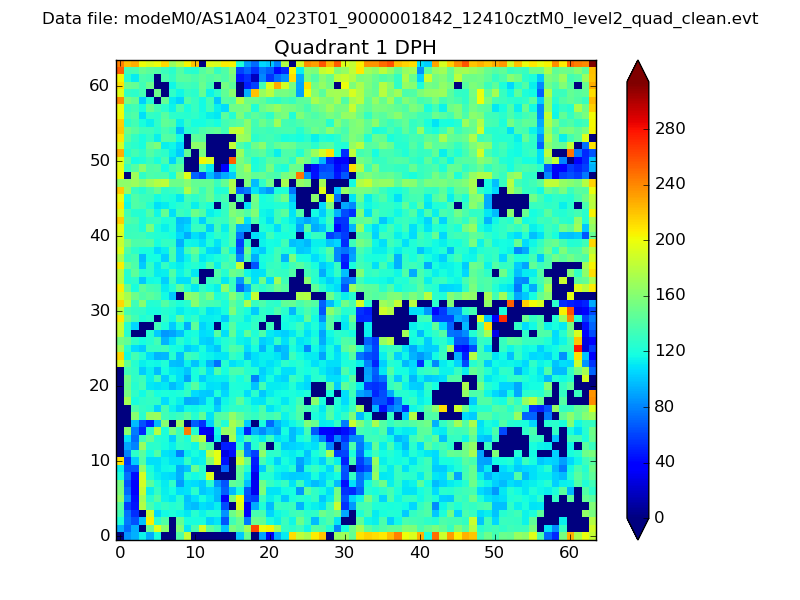 |
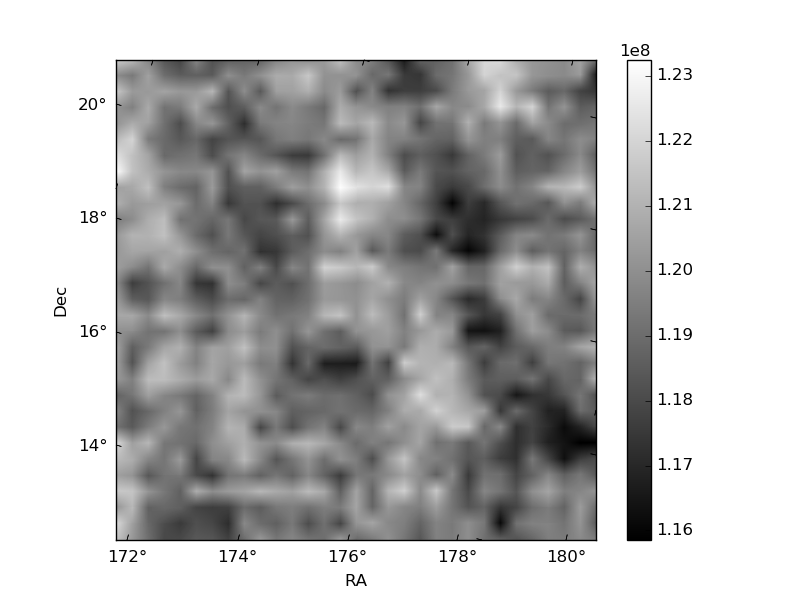
Quadrant B |
|---|---|---|---|
| Quadrant D | 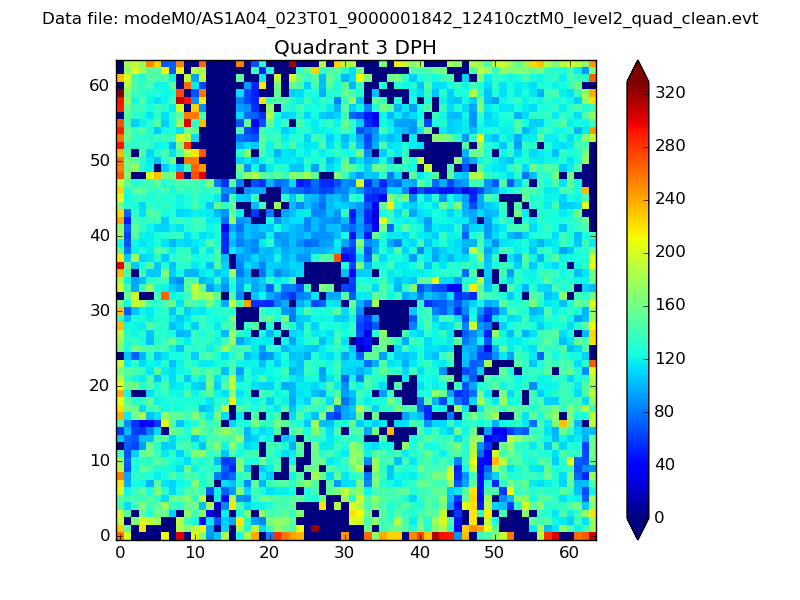 |
 |
Quadrant C |
| Plot type | Count rate plots | Images |
|---|---|---|
| Comparison with Poisson distribution Blue bars denote a histogram of data divided into 1 sec bins. Red curve is a Poisson curve with rate = median count rate of data. |
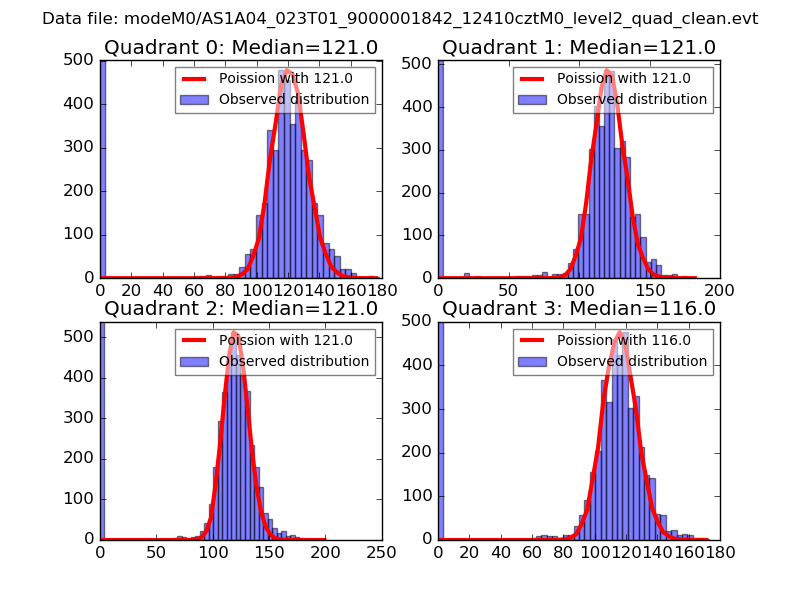 |
 |
| Quadrant-wise count rates Data is divided into 100 sec bins |
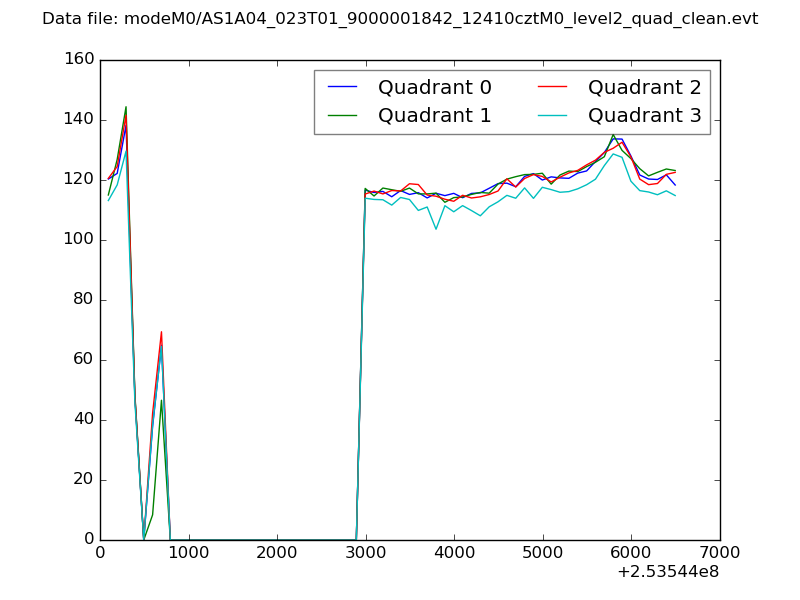 |
|
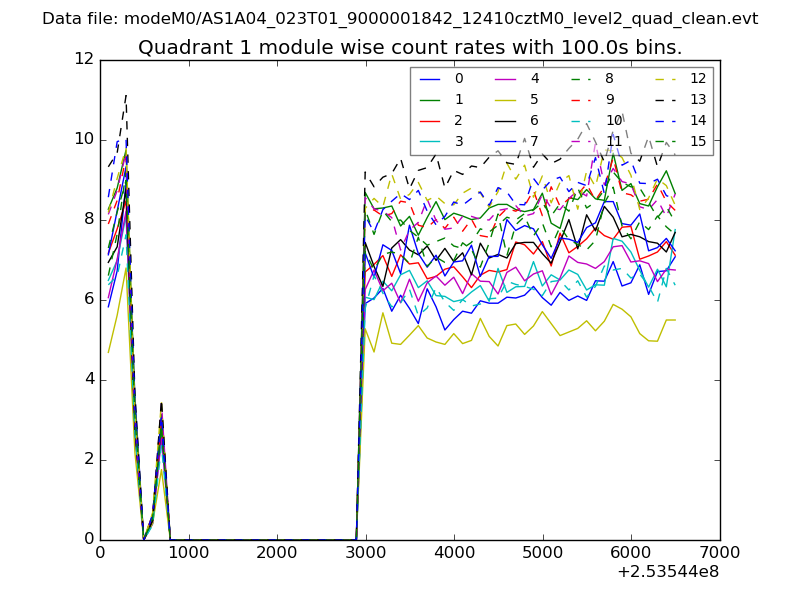
| Module-wise count rates for Quadrant A Data is divided into 100 sec bins |
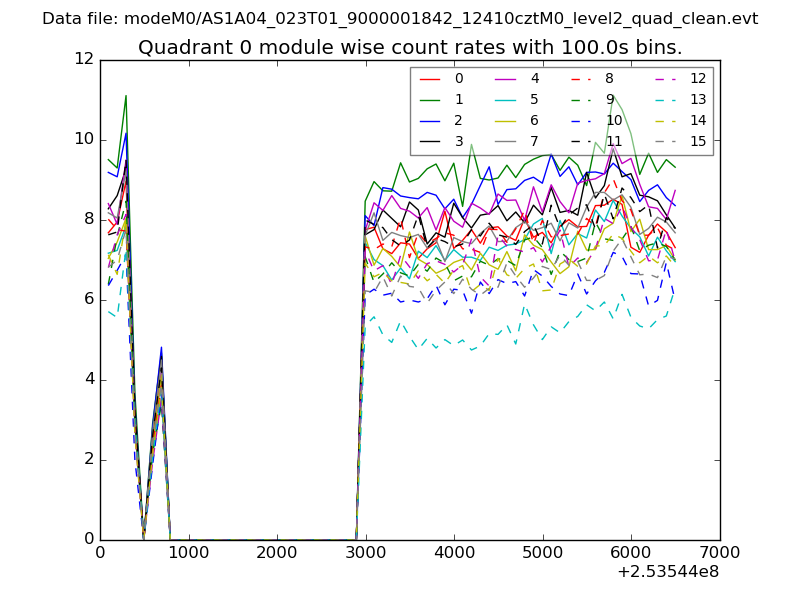 |
 |
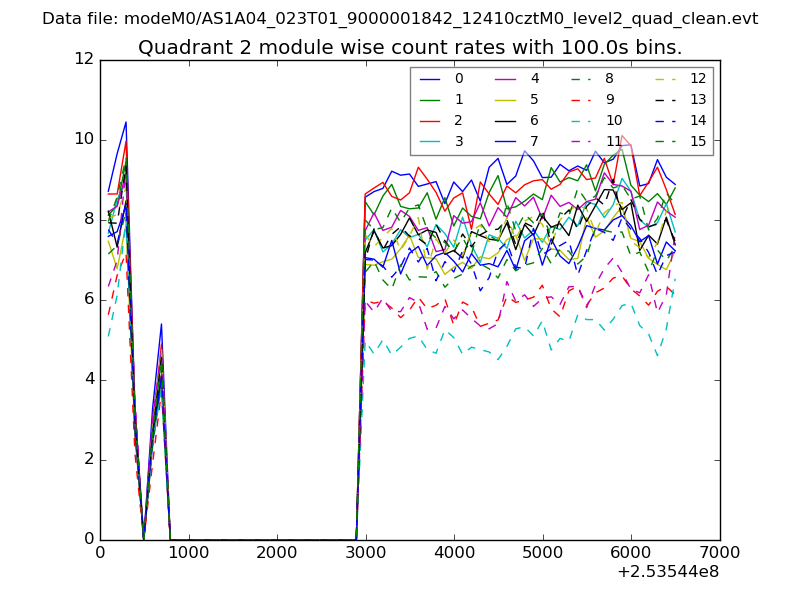
| Module-wise count rates for Quadrant B Data is divided into 100 sec bins |
 |
 |
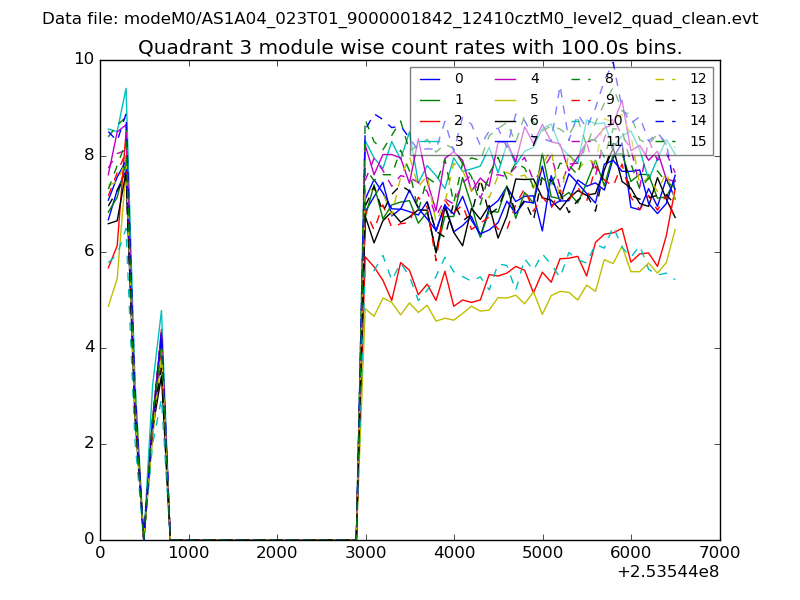
| Module-wise count rates for Quadrant C Data is divided into 100 sec bins |
 |
 |
| Module-wise count rates for Quadrant D Data is divided into 100 sec bins |
 |
 |
| Parameter | Plot |
|---|---|
| CZT HV Monitor | 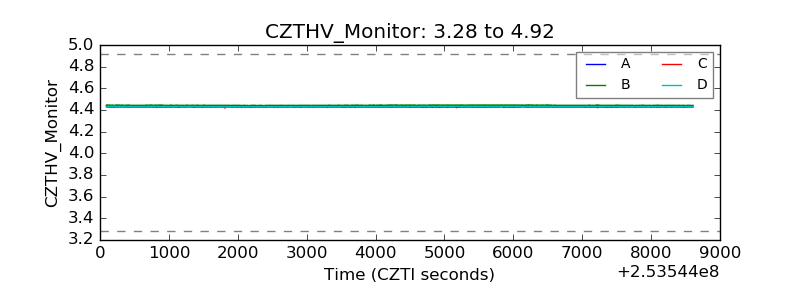 |
| D_VDD | 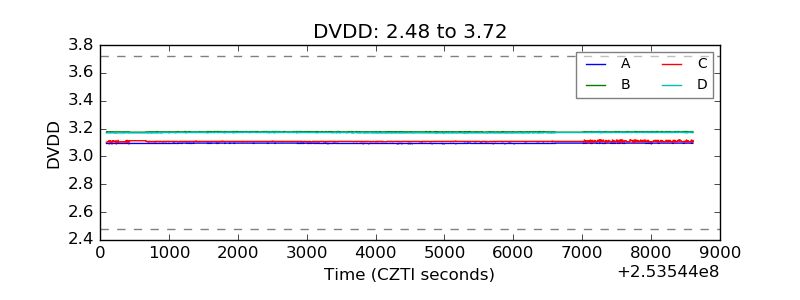 |
| Temperature 1 | 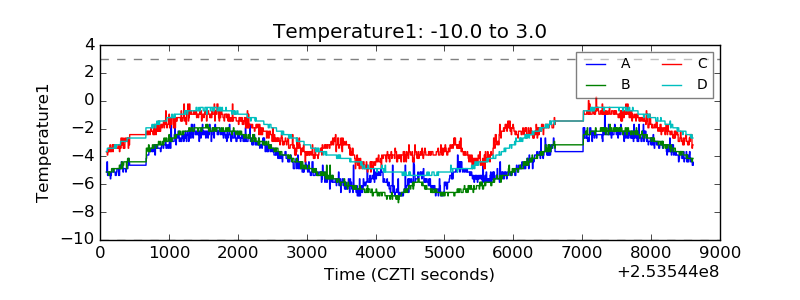 |
| Veto HV Monitor | 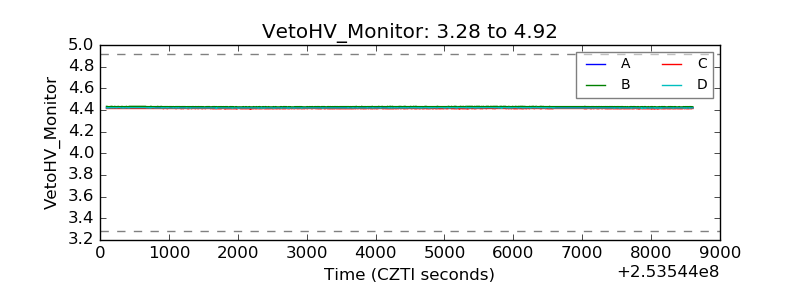 |
| Veto LLD | 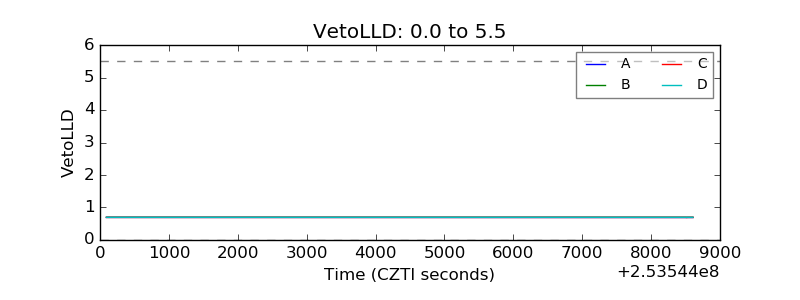 |
| Alpha Counter | 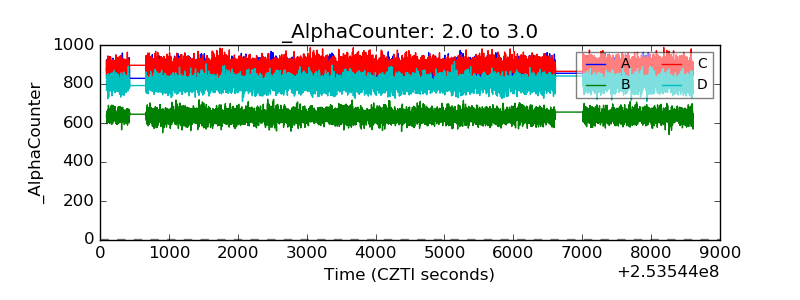 |
| _CPM_Rate | 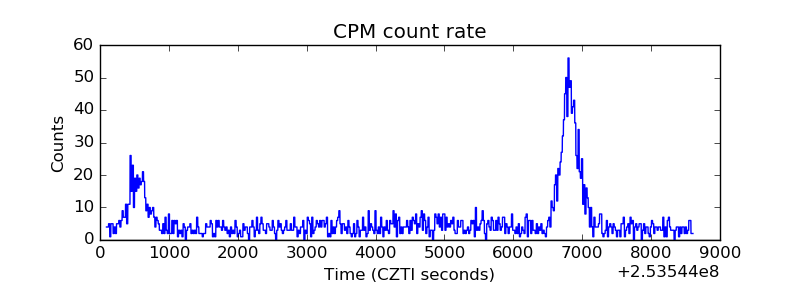 |
| CZT Counter | 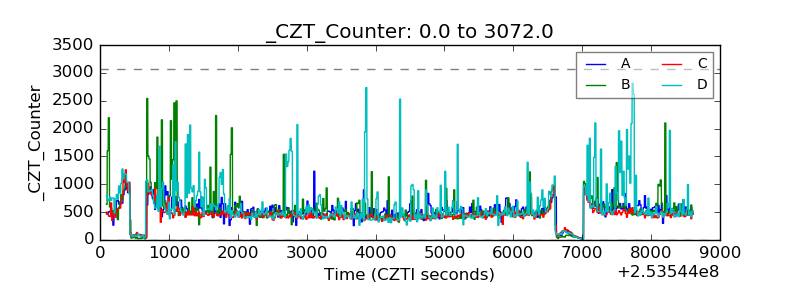 |
| +2.5 Volts monitor |  |
| +5 Volts monitor |  |
| _ROLL_ROT | 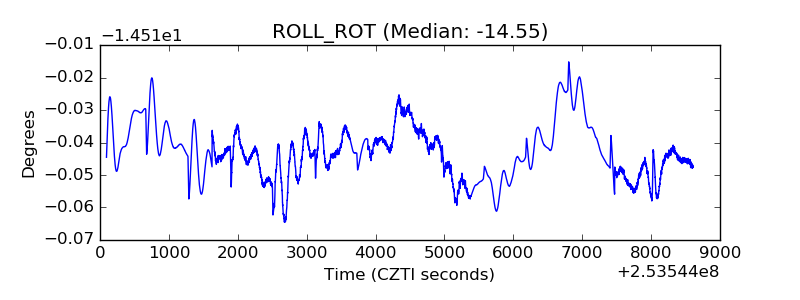 |
| _Roll_DEC | 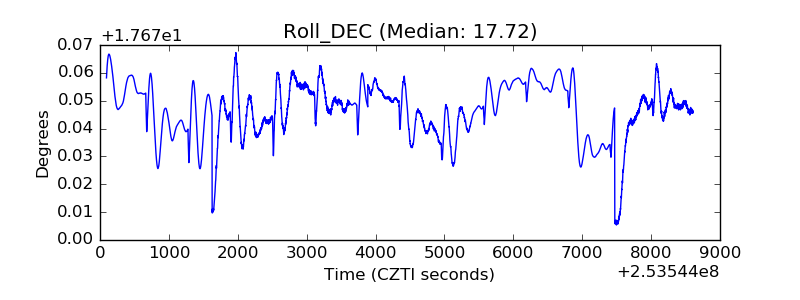 |
| _Roll_RA |  |
| Veto Counter | 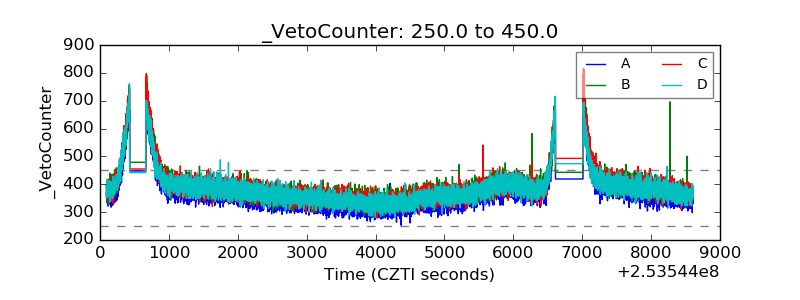 |