| Param | Original file | Final file |
|---|---|---|
| Filename | modeM0/AS1A04_023T01_9000001842_12412cztM0_level2.evt | modeM0/AS1A04_023T01_9000001842_12412cztM0_level2_quad_clean.evt |
| Size (bytes) | 670,245,120 | 106,951,680 |
| Size | 639.2 MB | 102.0 MB |
| Events in quadrant A | 4,785,240 | 656,799 |
| Events in quadrant B | 5,613,657 | 653,898 |
| Events in quadrant C | 4,129,389 | 660,821 |
| Events in quadrant D | 5,150,326 | 632,903 |
| Mode SS | |||
|---|---|---|---|
| Quadrant | BADHDUFLAG | Total packets | Discarded packets |
| A | 0 | 188 | 0 |
| B | 0 | 188 | 0 |
| C | 0 | 188 | 0 |
| D | 0 | 188 | 0 |
| Mode M0 | |||
|---|---|---|---|
| Quadrant | BADHDUFLAG | Total packets | Discarded packets |
| A | 0 | 20129 | 2 |
| B | 0 | 22712 | 2 |
| C | 0 | 18686 | 2 |
| D | 0 | 21769 | 2 |
| Mode M9 | |||
|---|---|---|---|
| Quadrant | BADHDUFLAG | Total packets | Discarded packets |
| A | 0 | 10 | 0 |
| B | 0 | 10 | 0 |
| C | 0 | 10 | 0 |
| D | 0 | 10 | 0 |
| Quadrant | Total seconds | Saturated seconds | Saturation percentage |
|---|---|---|---|
| A | 9140 | 147 | 1.608315% |
| B | 9140 | 469 | 5.131291% |
| C | 9140 | 77 | 0.842451% |
| D | 9140 | 234 | 2.560175% |
Noise dominated data is calculated using 1-second bins in cleaned event files. If a bin has >2000 counts, and if more than 50% of those come from <1% of pixels, then it is considered to be noise-dominated and hence unusable.
| Quadrant | # 1 sec bins | Bins with >0 counts | Bins with >2000 counts | High rate bins dominated by noise | Noise dominated (total time) | Noise dominated (detector-on time) | Marked lightcurve |
|---|---|---|---|---|---|---|---|
| A | 10146 | 9142 | 7 | 7 | 0.07% | 0.08% | 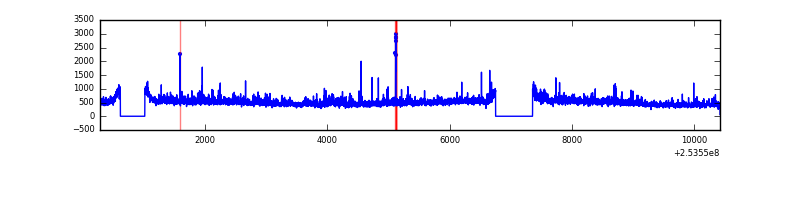 |
| B | 10146 | 9141 | 258 | 258 | 2.54% | 2.82% | 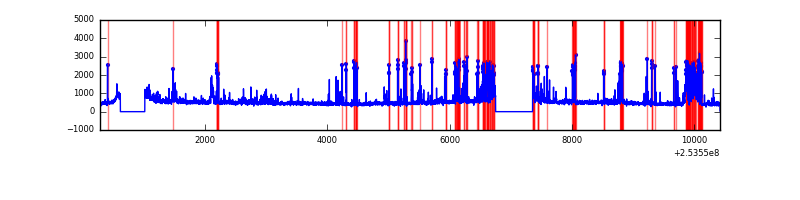 |
| C | 10146 | 9142 | 0 | 0 | 0.00% | 0.00% | 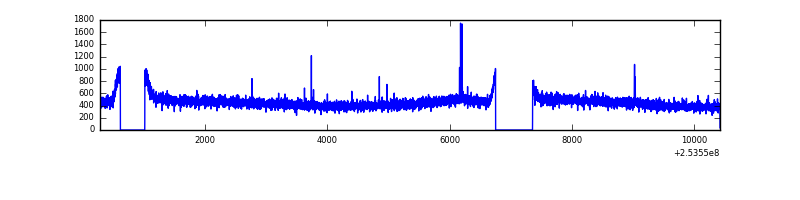 |
| D | 10146 | 9142 | 117 | 117 | 1.15% | 1.28% | 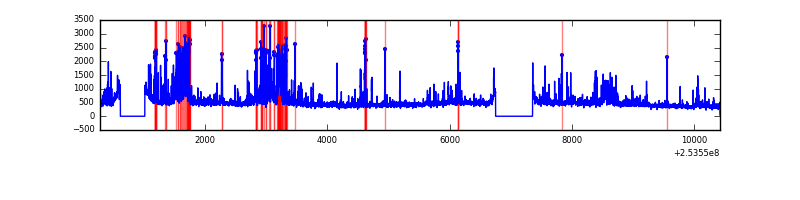 |
Top three noisy pixels from each quadrant. If the there are fewer than three noisy pixels in the level2.evt file, extra rows are filled as -1
| Pixel properties | Quadrant properties | ||||||
|---|---|---|---|---|---|---|---|
| Quadrant | DetID | PixID | Counts | Sigma | Mean | Median | Sigma |
| A | 1 | 162 | 151879 | 685.94 | 1077 | 1055 | 219.9 |
| A | 13 | 251 | 111569 | 502.61 | 1077 | 1055 | 219.9 |
| A | 12 | 189 | 89596 | 402.68 | 1077 | 1055 | 219.9 |
| B | 4 | 239 | 710500 | 3441.98 | 1062 | 1034 | 206.1 |
| B | 3 | 64 | 459958 | 2226.47 | 1062 | 1034 | 206.1 |
| B | 3 | 209 | 81568 | 390.71 | 1062 | 1034 | 206.1 |
| C | 14 | 234 | 13838 | 51.82 | 1052 | 1056 | 246.7 |
| C | 8 | 128 | 9775 | 35.34 | 1052 | 1056 | 246.7 |
| C | 13 | 61 | 7670 | 26.81 | 1052 | 1056 | 246.7 |
| D | 1 | 52 | 566167 | 2228.78 | 1043 | 1015 | 253.6 |
| D | 2 | 14 | 133315 | 521.75 | 1043 | 1015 | 253.6 |
| D | 10 | 157 | 116639 | 455.98 | 1043 | 1015 | 253.6 |
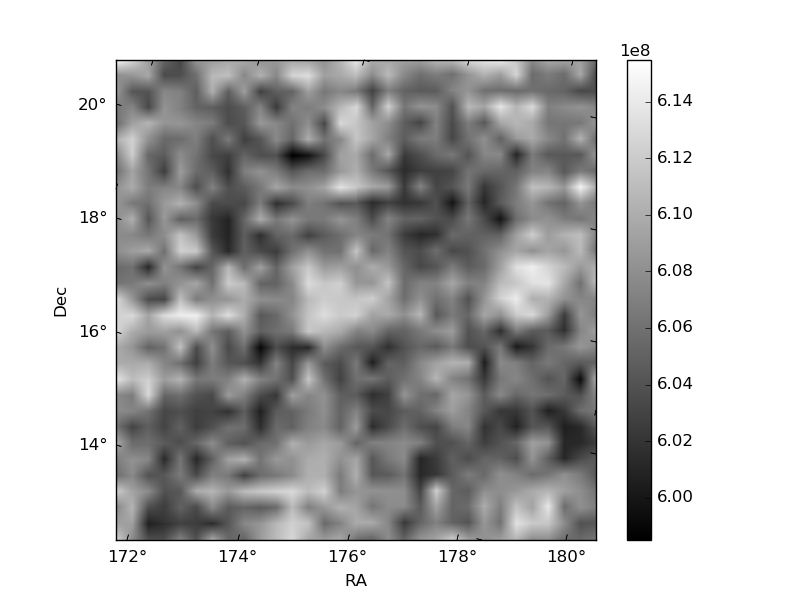
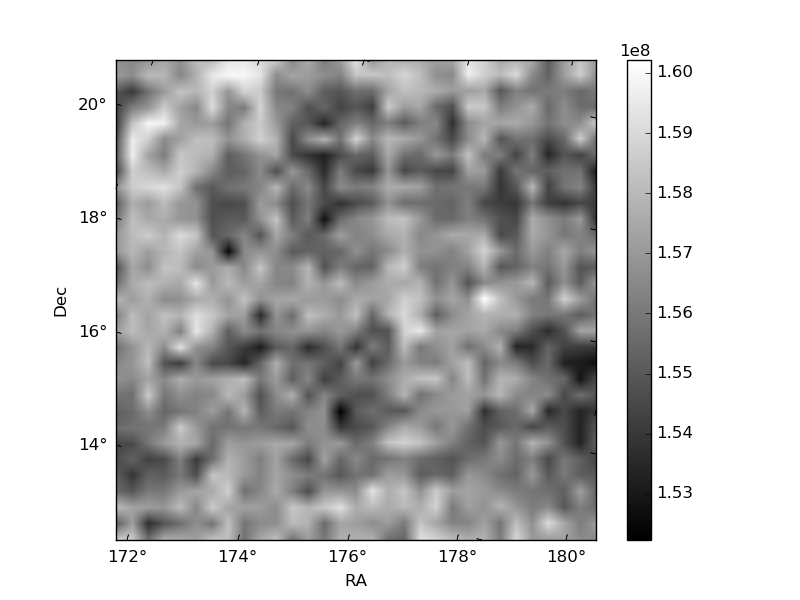
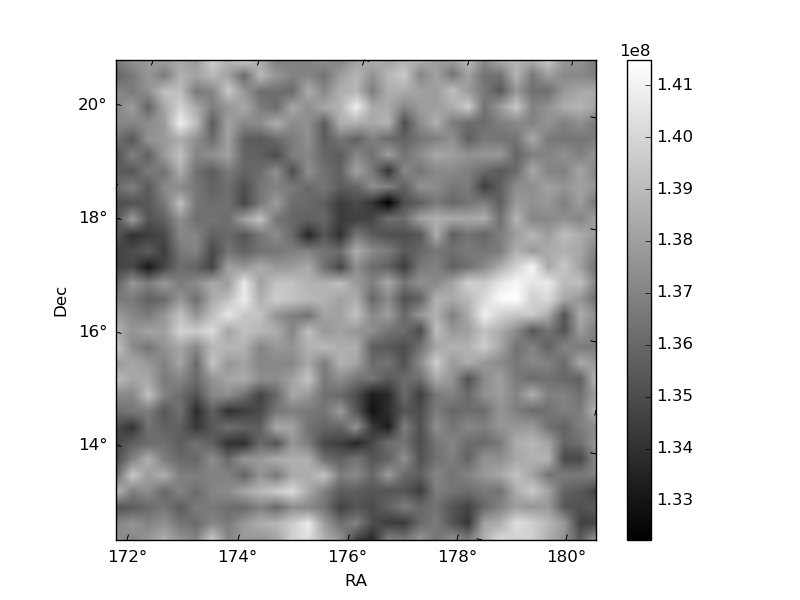
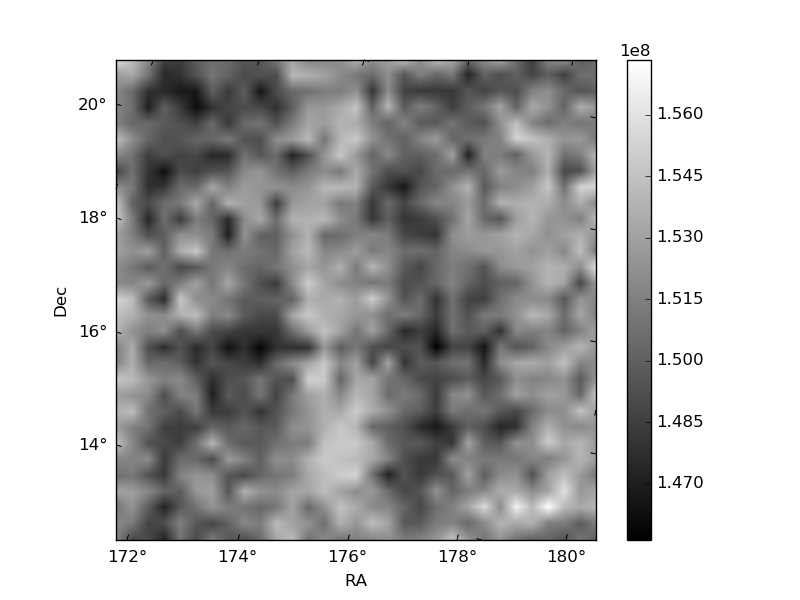
Histogram calculated using DETX and DETY for each event in the final _common_clean file
| Quadrant A | 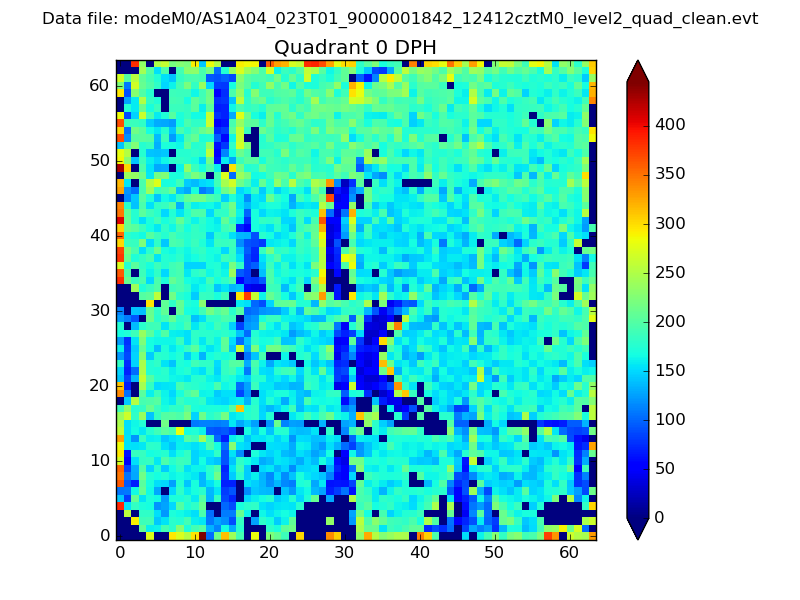 |
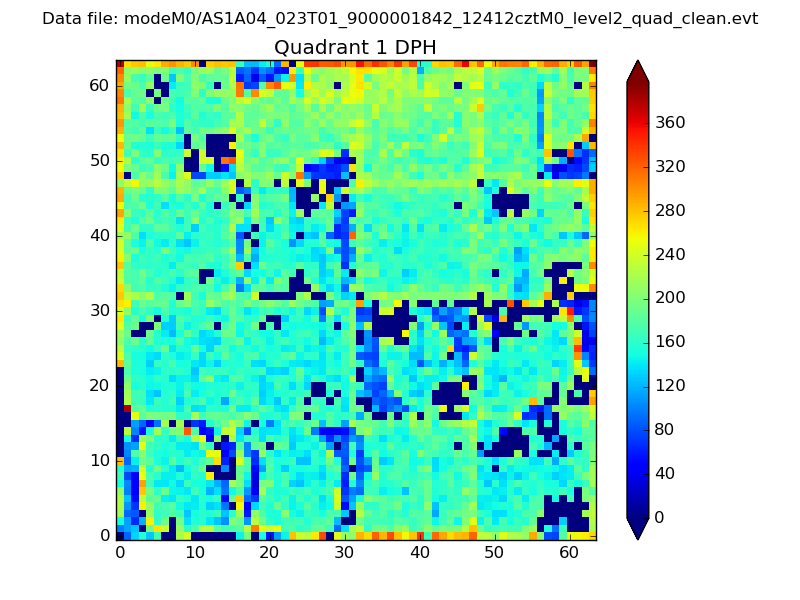 |
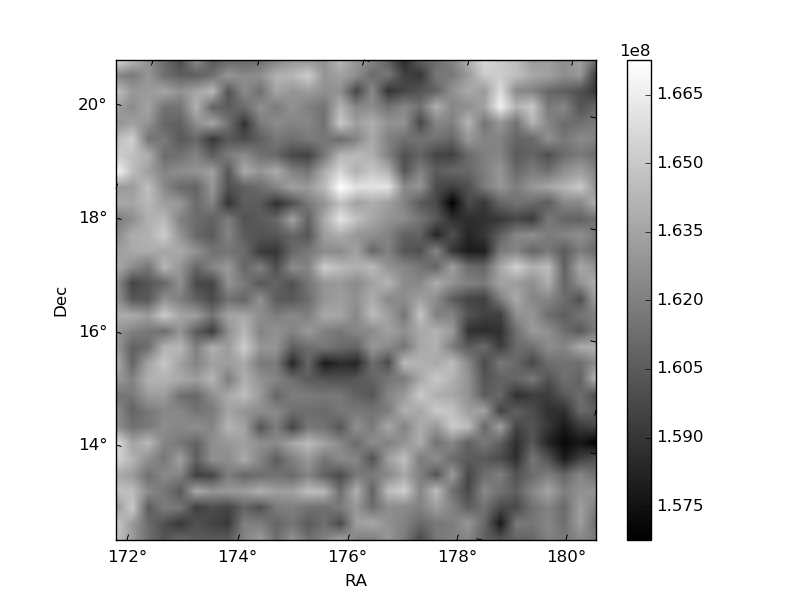
Quadrant B |
|---|---|---|---|
| Quadrant D | 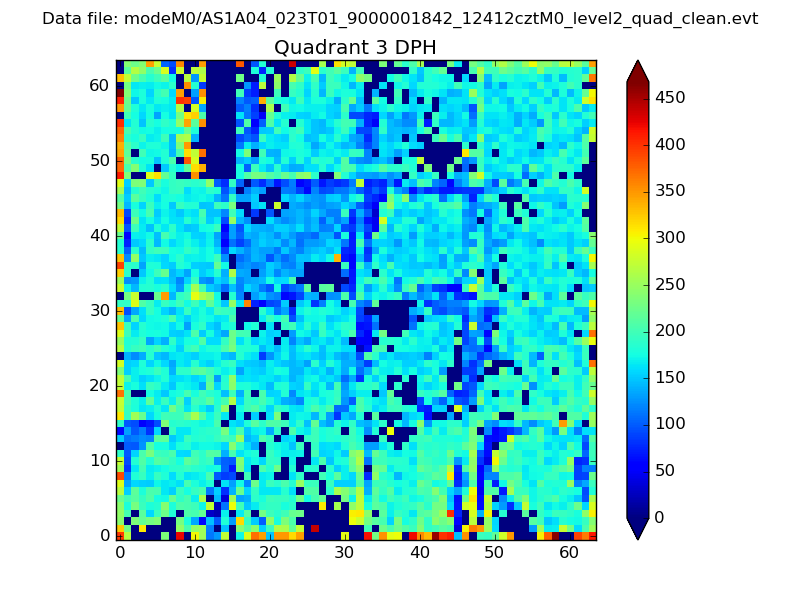 |
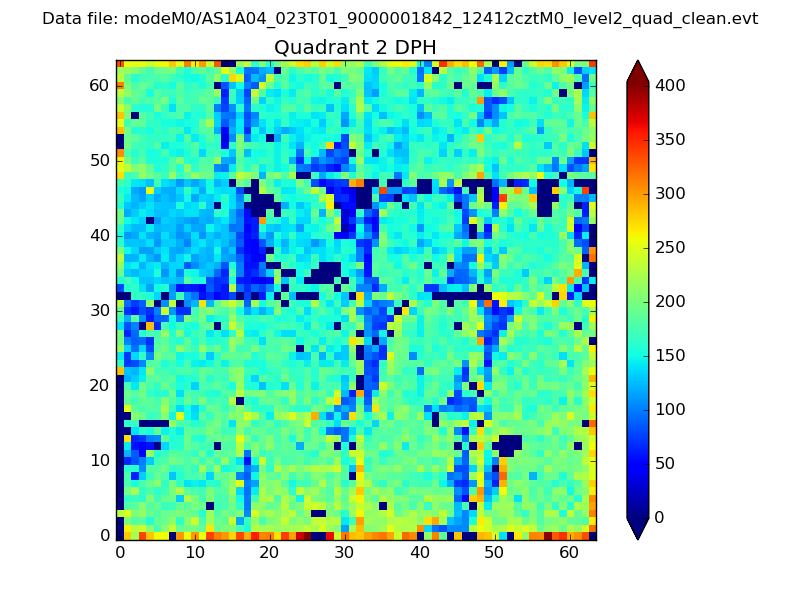 |
Quadrant C |
| Plot type | Count rate plots | Images |
|---|---|---|
| Comparison with Poisson distribution Blue bars denote a histogram of data divided into 1 sec bins. Red curve is a Poisson curve with rate = median count rate of data. |
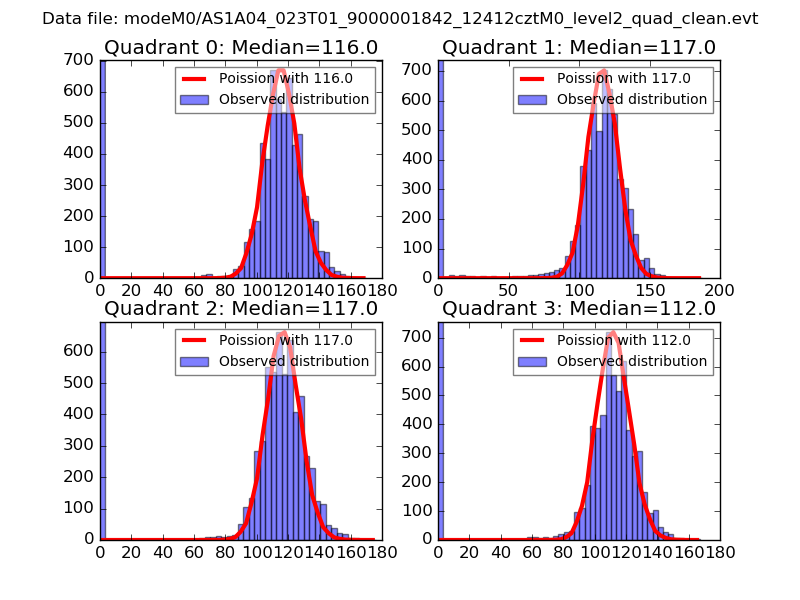 |
 |
| Quadrant-wise count rates Data is divided into 100 sec bins |
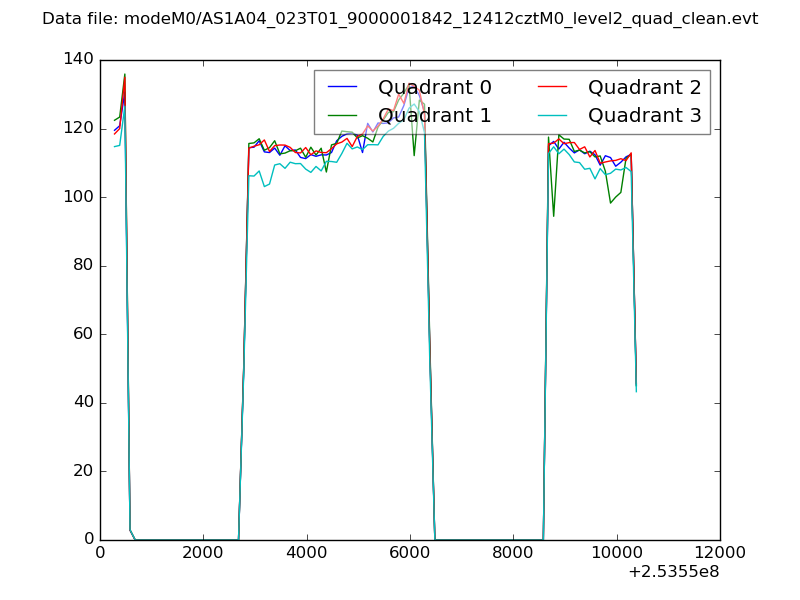 |
|
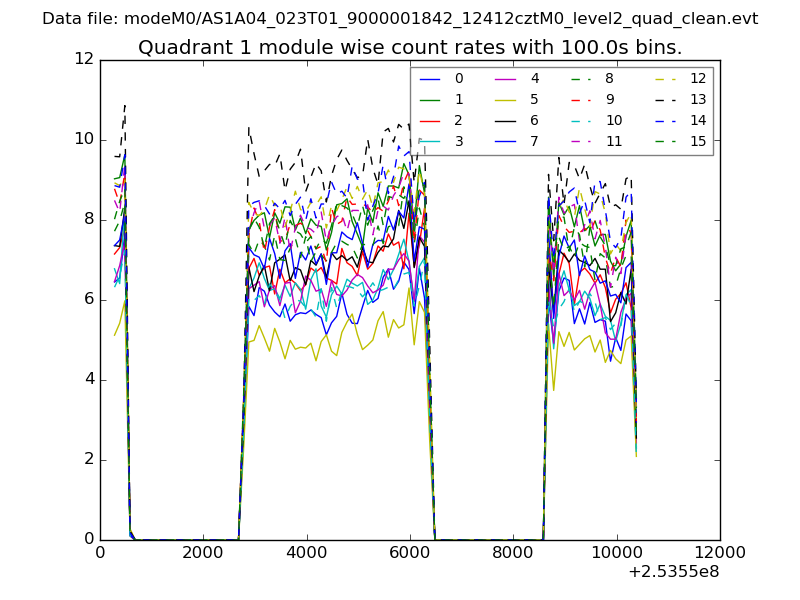
| Module-wise count rates for Quadrant A Data is divided into 100 sec bins |
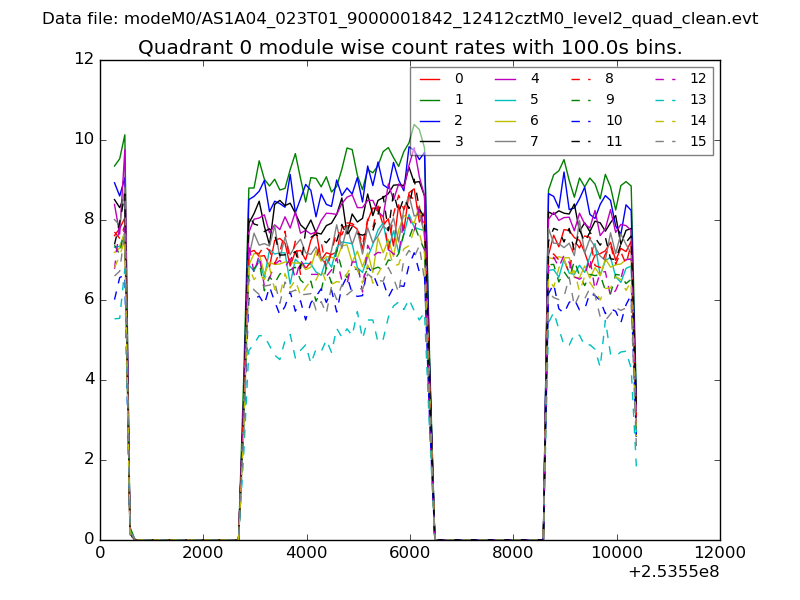 |
 |
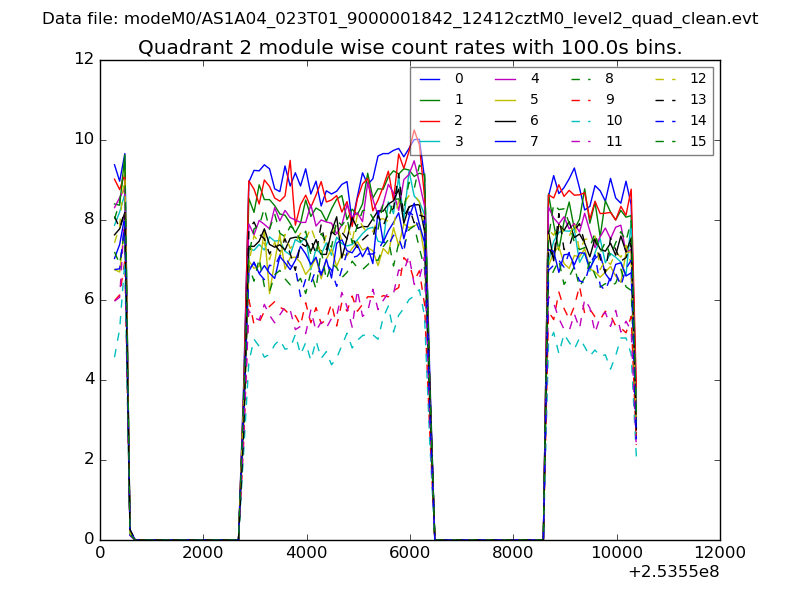
| Module-wise count rates for Quadrant B Data is divided into 100 sec bins |
 |
 |
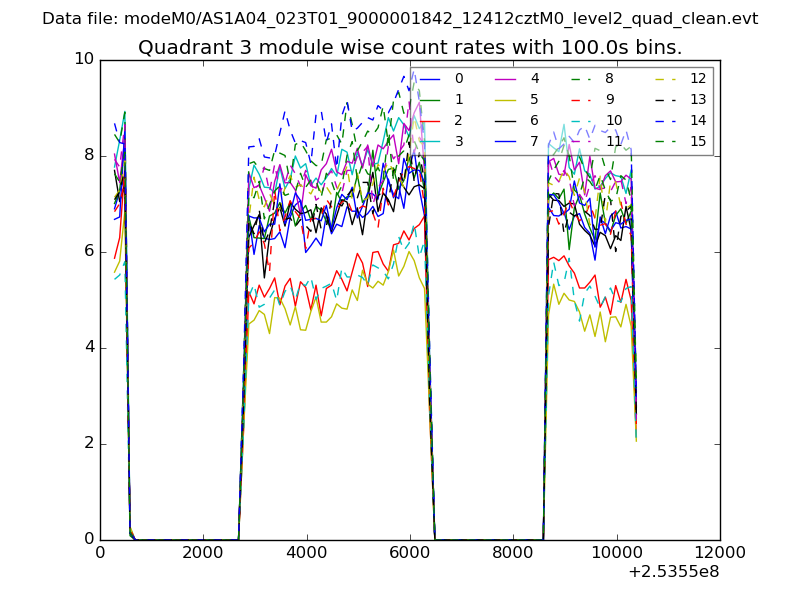
| Module-wise count rates for Quadrant C Data is divided into 100 sec bins |
 |
 |
| Module-wise count rates for Quadrant D Data is divided into 100 sec bins |
 |
 |
| Parameter | Plot |
|---|---|
| CZT HV Monitor | 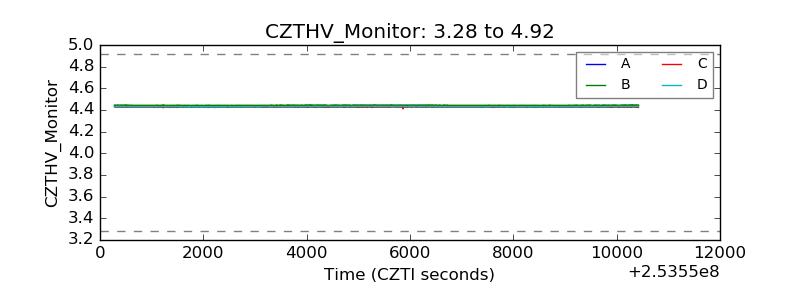 |
| D_VDD |  |
| Temperature 1 | 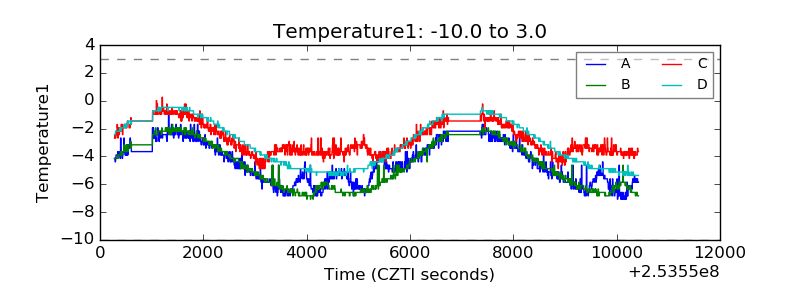 |
| Veto HV Monitor | 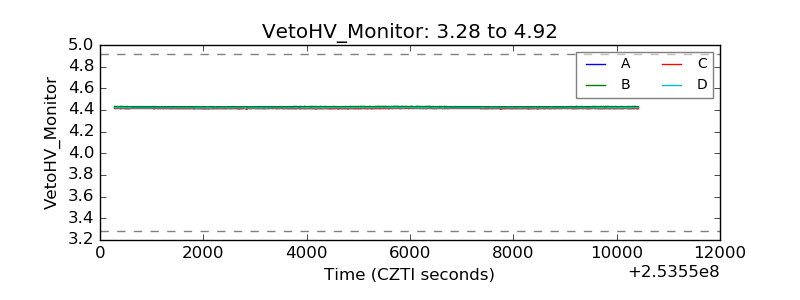 |
| Veto LLD | 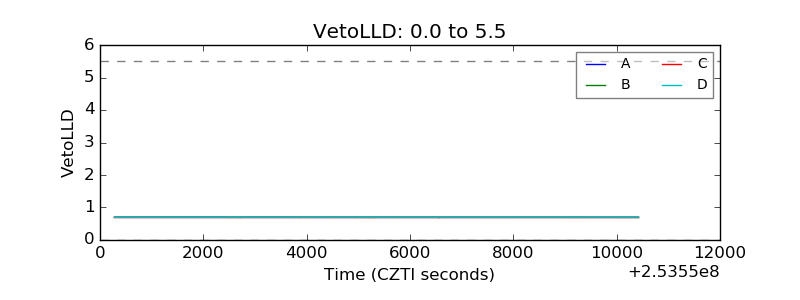 |
| Alpha Counter | 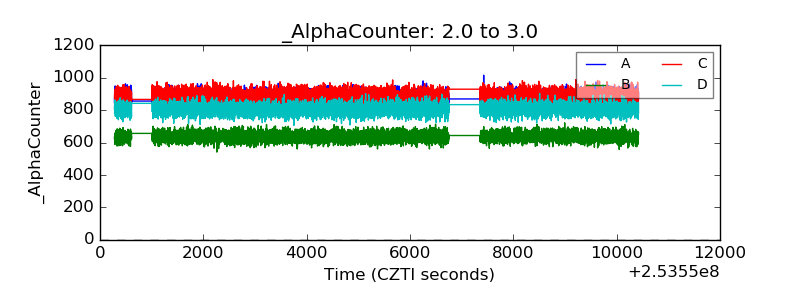 |
| _CPM_Rate | 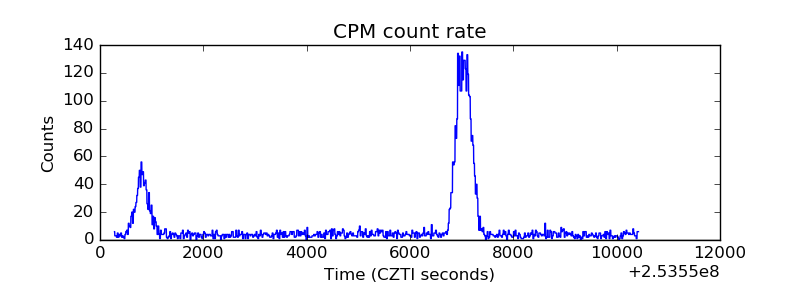 |
| CZT Counter | 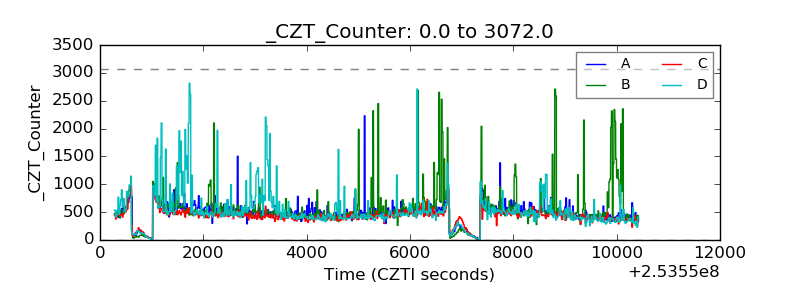 |
| +2.5 Volts monitor |  |
| +5 Volts monitor |  |
| _ROLL_ROT | 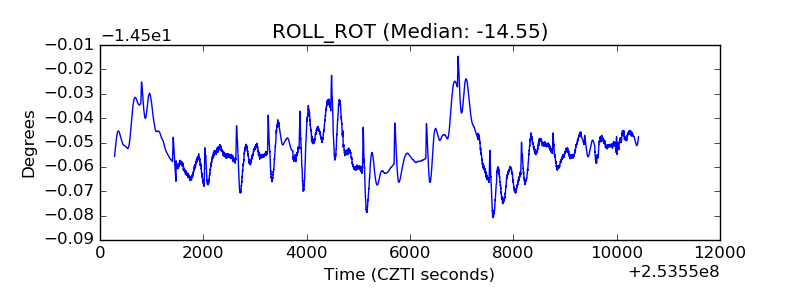 |
| _Roll_DEC | 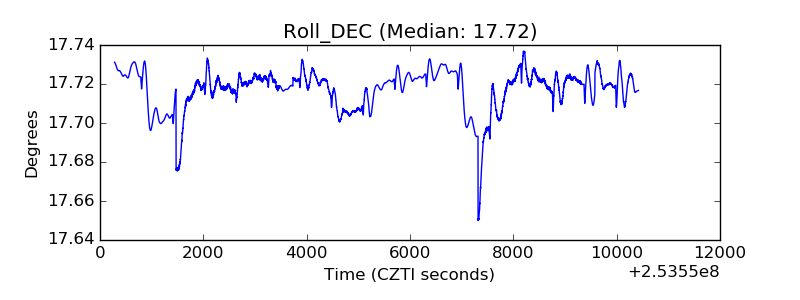 |
| _Roll_RA | 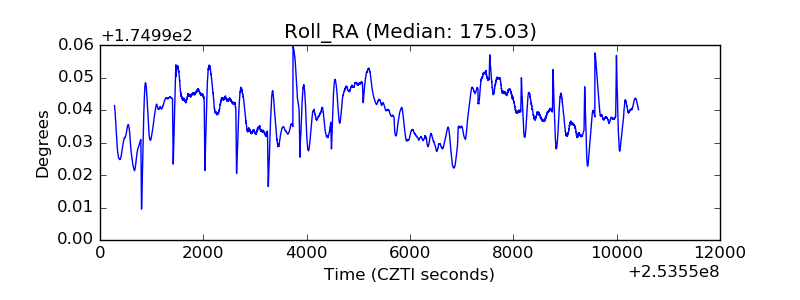 |
| Veto Counter | 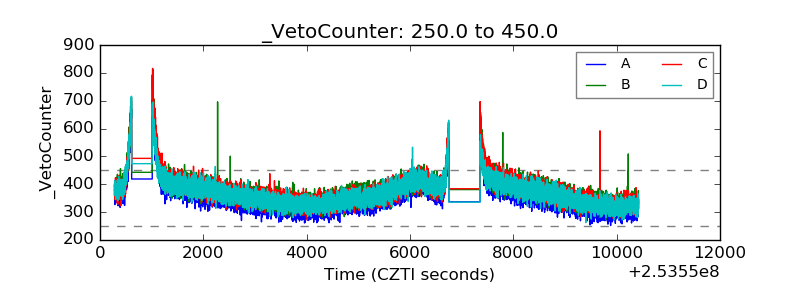 |