| Param | Original file | Final file |
|---|---|---|
| Filename | modeM0/AS1A04_201T01_9000001844_12412cztM0_level2.evt | modeM0/AS1A04_201T01_9000001844_12412cztM0_level2_quad_clean.evt |
| Size (bytes) | 49,596,480 | 13,942,080 |
| Size | 47.3 MB | 13.3 MB |
| Events in quadrant A | 357,311 | 90,425 |
| Events in quadrant B | 393,855 | 90,395 |
| Events in quadrant C | 318,213 | 91,355 |
| Events in quadrant D | 376,357 | 87,744 |
| Mode SS | |||
|---|---|---|---|
| Quadrant | BADHDUFLAG | Total packets | Discarded packets |
| A | 0 | 16 | 0 |
| B | 0 | 16 | 0 |
| C | 0 | 16 | 0 |
| D | 0 | 16 | 0 |
| Mode M0 | |||
|---|---|---|---|
| Quadrant | BADHDUFLAG | Total packets | Discarded packets |
| A | 0 | 1584 | 1 |
| B | 0 | 1742 | 0 |
| C | 0 | 1549 | 0 |
| D | 0 | 1710 | 0 |
| Quadrant | Total seconds | Saturated seconds | Saturation percentage |
|---|---|---|---|
| A | 775 | 1 | 0.129032% |
| B | 775 | 18 | 2.322581% |
| C | 775 | 1 | 0.129032% |
| D | 775 | 4 | 0.516129% |
Noise dominated data is calculated using 1-second bins in cleaned event files. If a bin has >2000 counts, and if more than 50% of those come from <1% of pixels, then it is considered to be noise-dominated and hence unusable.
| Quadrant | # 1 sec bins | Bins with >0 counts | Bins with >2000 counts | High rate bins dominated by noise | Noise dominated (total time) | Noise dominated (detector-on time) | Marked lightcurve |
|---|---|---|---|---|---|---|---|
| A | 776 | 776 | 0 | 0 | 0.00% | 0.00% | 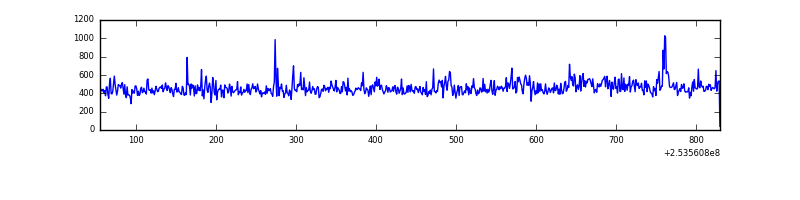 |
| B | 776 | 776 | 17 | 17 | 2.19% | 2.19% | 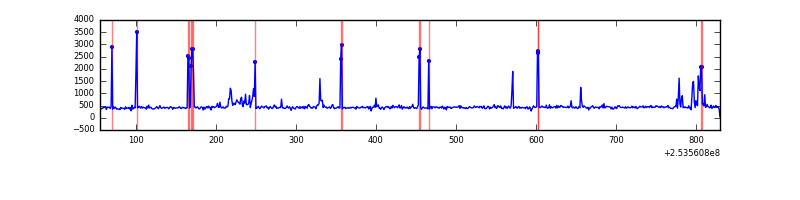 |
| C | 776 | 776 | 0 | 0 | 0.00% | 0.00% | 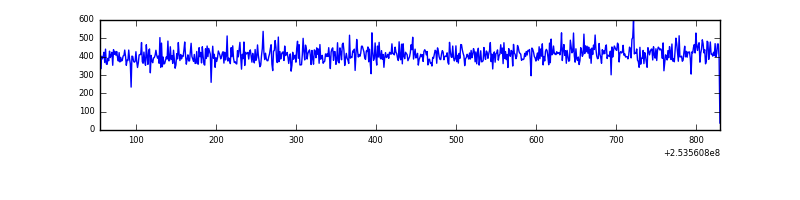 |
| D | 776 | 776 | 1 | 1 | 0.13% | 0.13% | 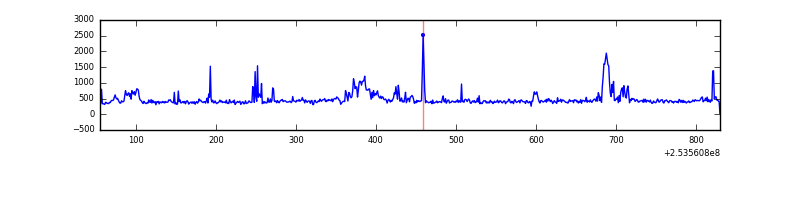 |
Top three noisy pixels from each quadrant. If the there are fewer than three noisy pixels in the level2.evt file, extra rows are filled as -1
| Pixel properties | Quadrant properties | ||||||
|---|---|---|---|---|---|---|---|
| Quadrant | DetID | PixID | Counts | Sigma | Mean | Median | Sigma |
| A | 13 | 251 | 12220 | 617.92 | 84 | 82 | 19.6 |
| A | 12 | 189 | 7656 | 385.58 | 84 | 82 | 19.6 |
| A | 9 | 143 | 3863 | 192.48 | 84 | 82 | 19.6 |
| B | 3 | 64 | 65194 | 3554.0 | 83 | 81 | 18.3 |
| B | 4 | 239 | 4494 | 240.87 | 83 | 81 | 18.3 |
| B | 12 | 111 | 1890 | 98.74 | 83 | 81 | 18.3 |
| C | 13 | 61 | 616 | 25.6 | 81 | 81 | 20.9 |
| C | 14 | 234 | 277 | 9.37 | 81 | 81 | 20.9 |
| C | 12 | 4 | 255 | 8.31 | 81 | 81 | 20.9 |
| D | 2 | 14 | 56513 | 2678.41 | 80 | 78 | 21.1 |
| D | 1 | 52 | 11870 | 559.65 | 80 | 78 | 21.1 |
| D | 8 | 195 | 4411 | 205.64 | 80 | 78 | 21.1 |
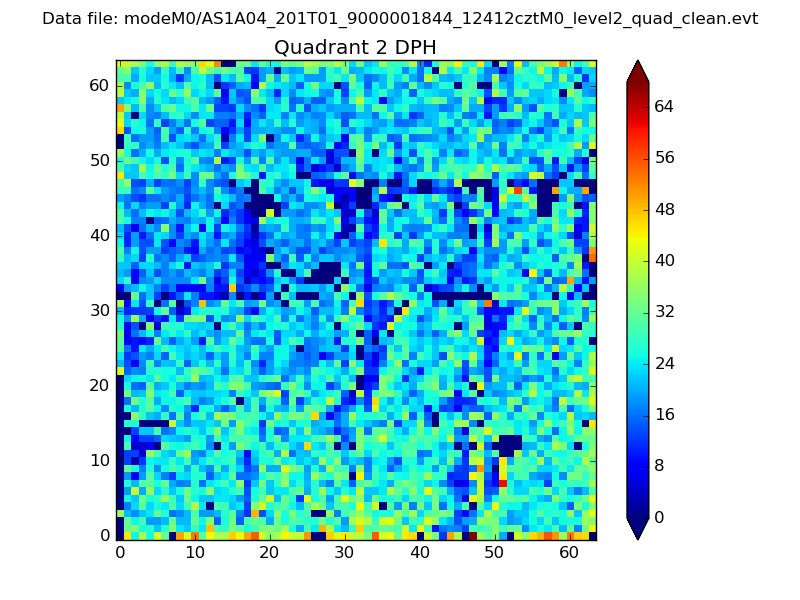
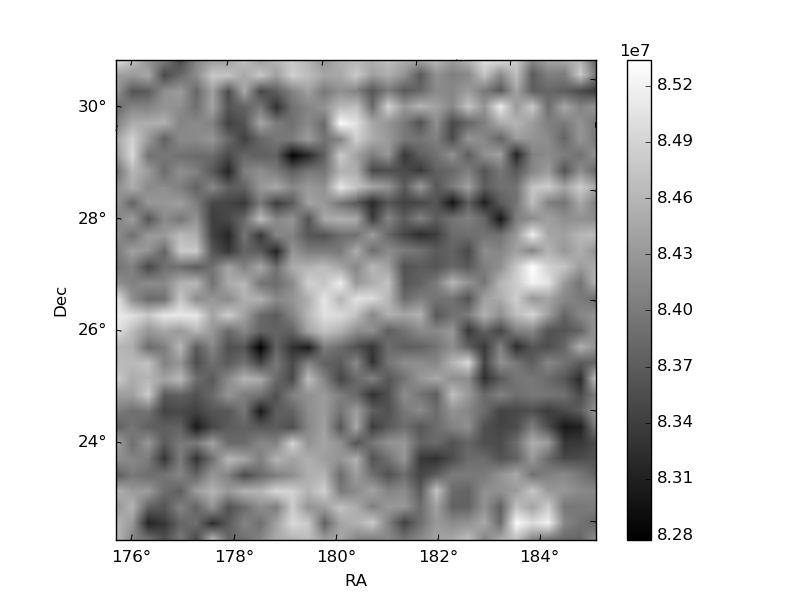
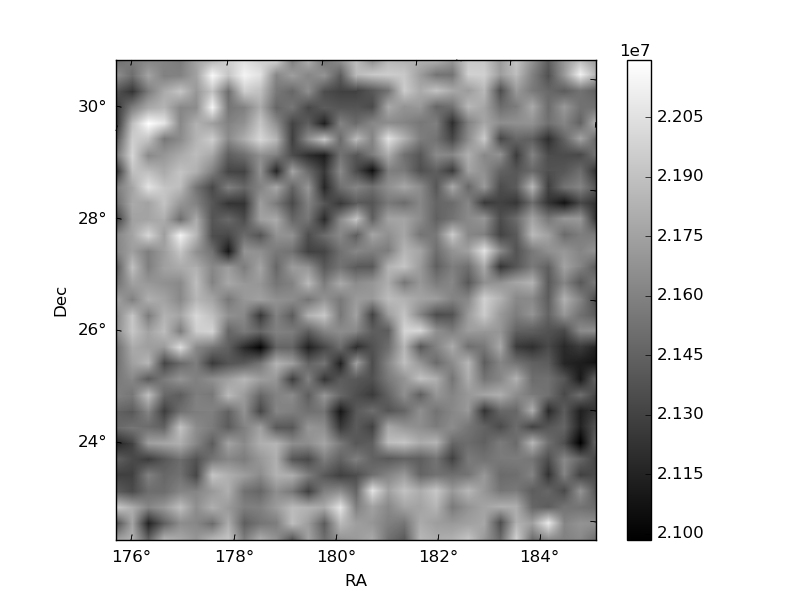
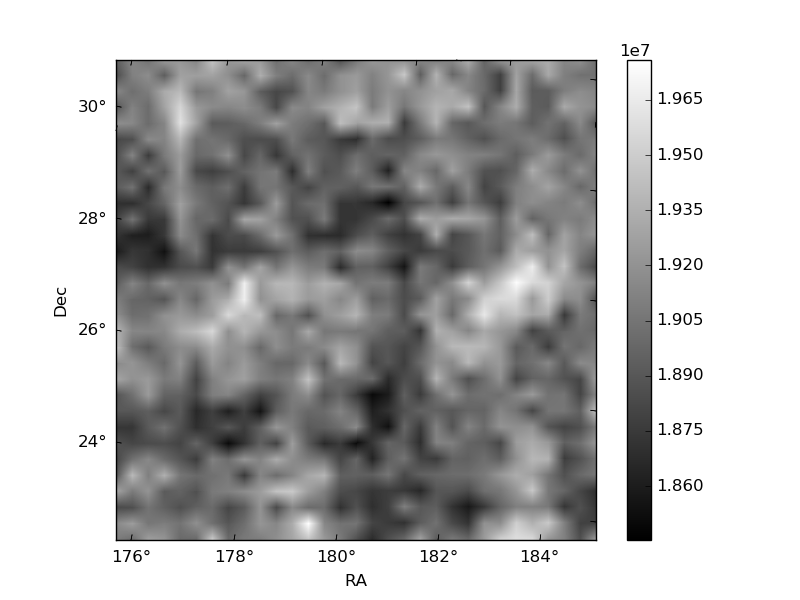
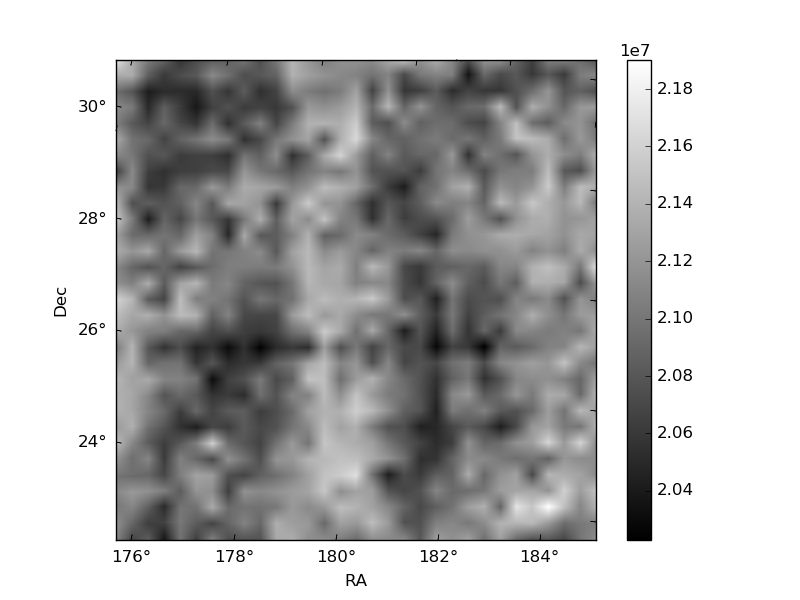
Histogram calculated using DETX and DETY for each event in the final _common_clean file
| Quadrant A | 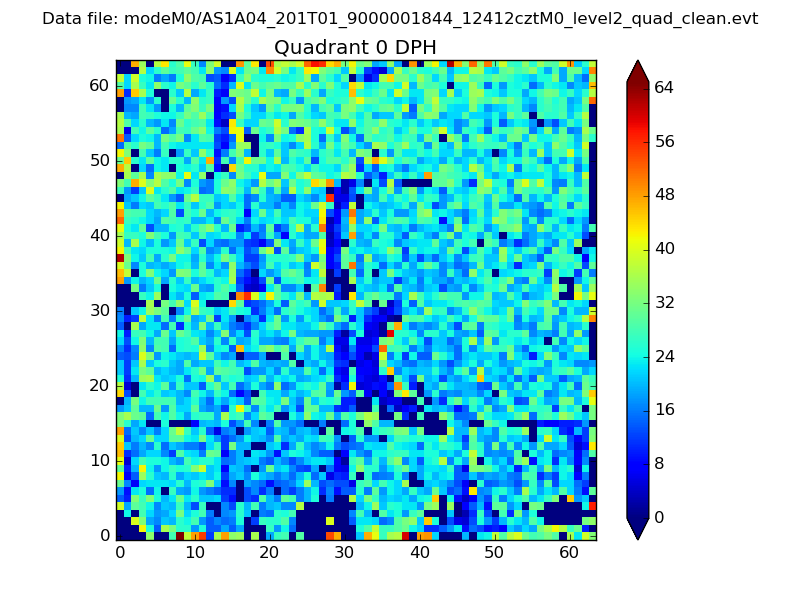 |
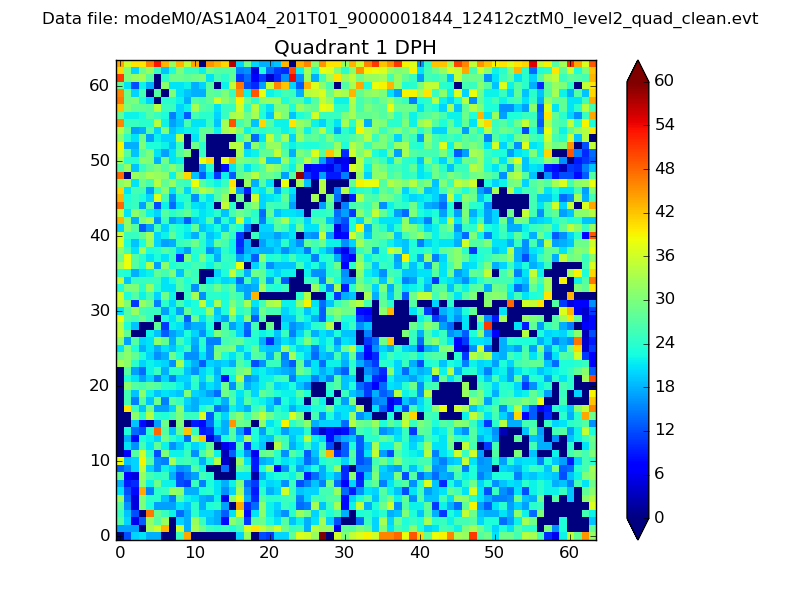 |
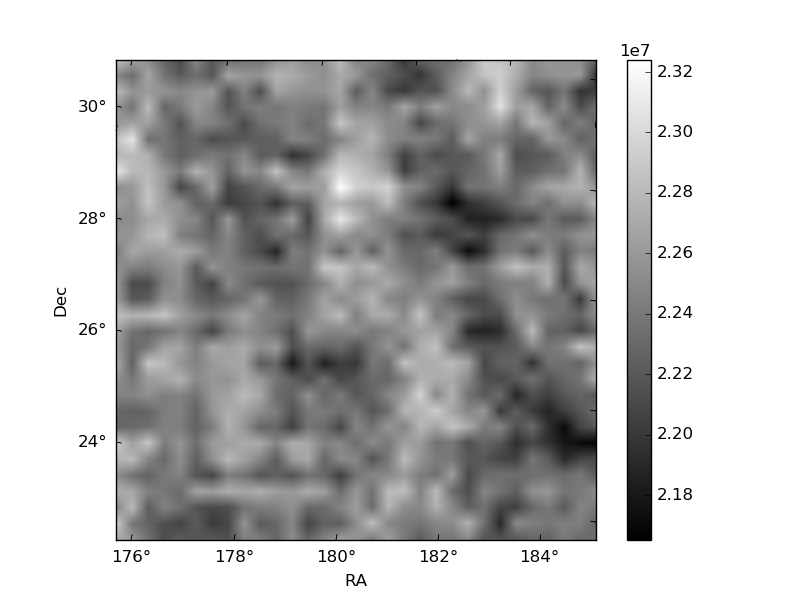
Quadrant B |
|---|---|---|---|
| Quadrant D | 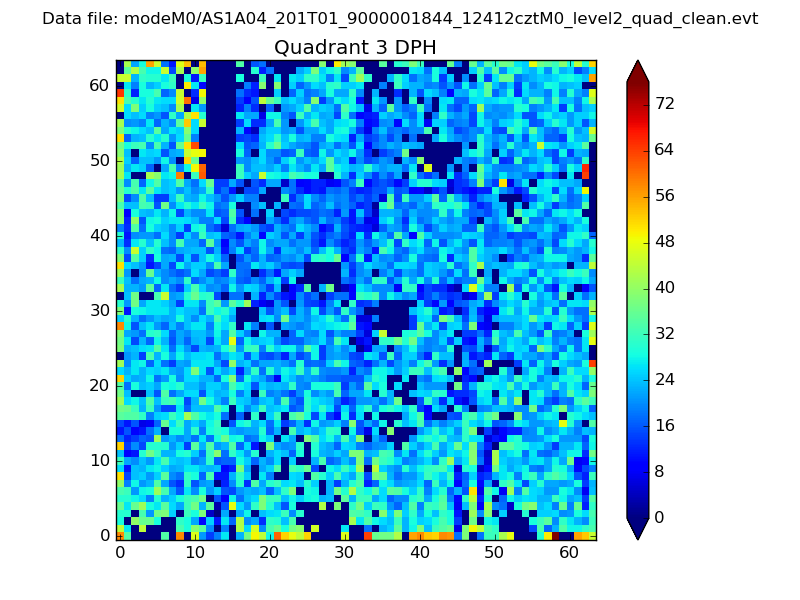 |
 |
Quadrant C |
| Plot type | Count rate plots | Images |
|---|---|---|
| Comparison with Poisson distribution Blue bars denote a histogram of data divided into 1 sec bins. Red curve is a Poisson curve with rate = median count rate of data. |
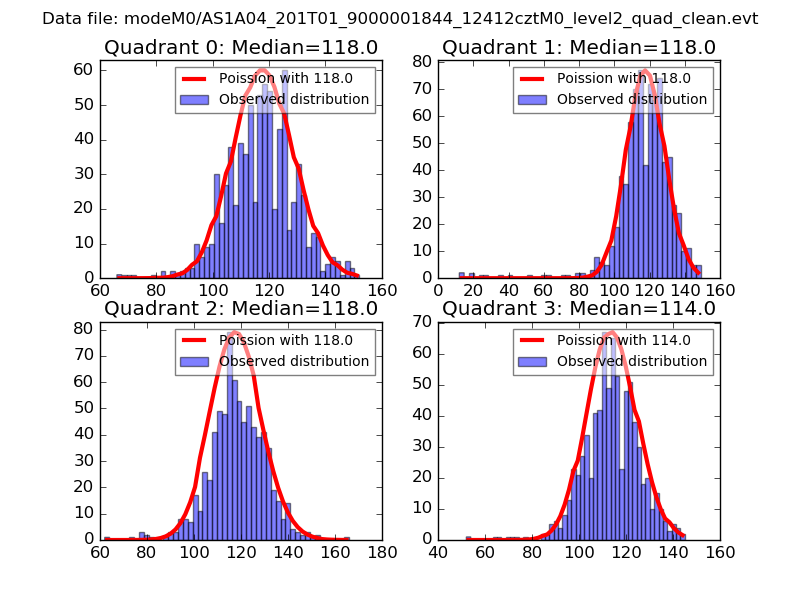 |
 |
| Quadrant-wise count rates Data is divided into 100 sec bins |
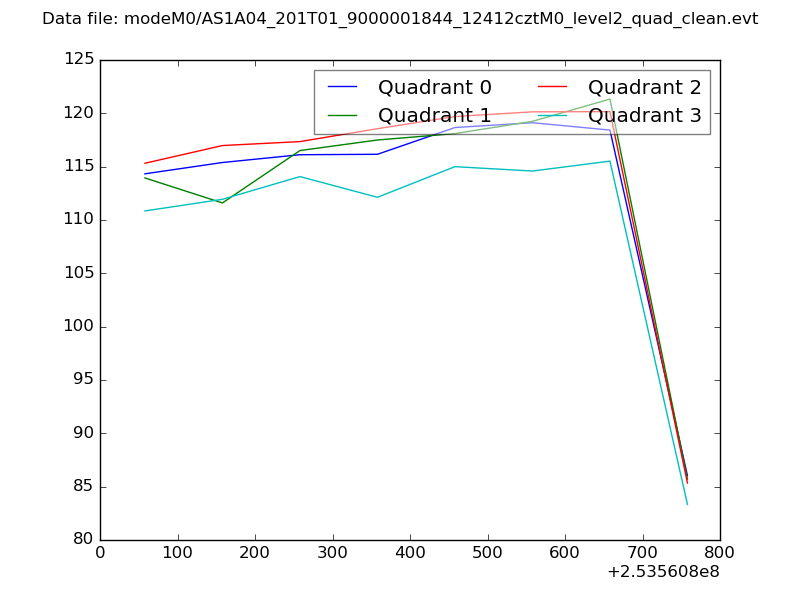 |
|
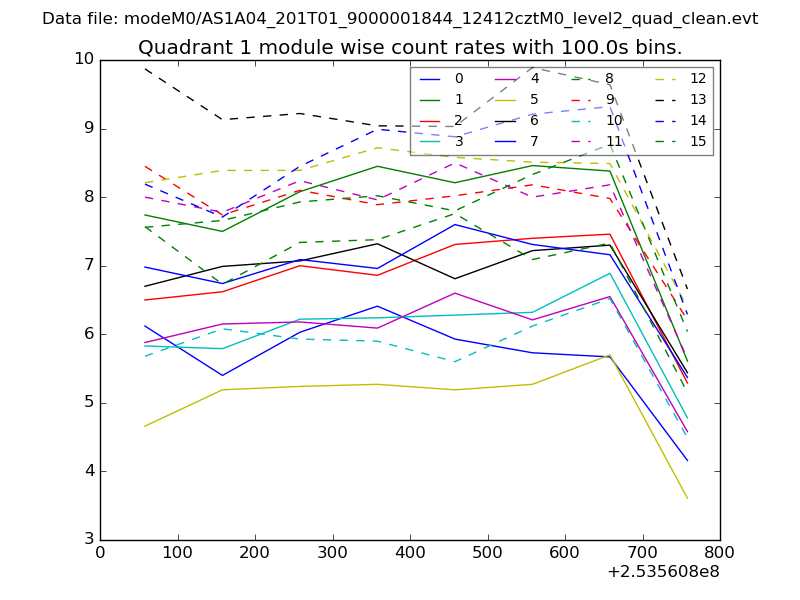
| Module-wise count rates for Quadrant A Data is divided into 100 sec bins |
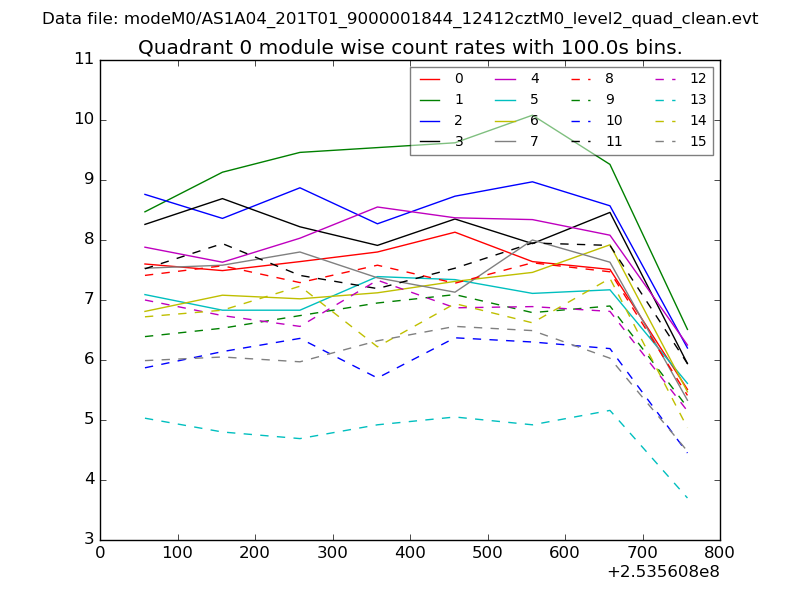 |
 |
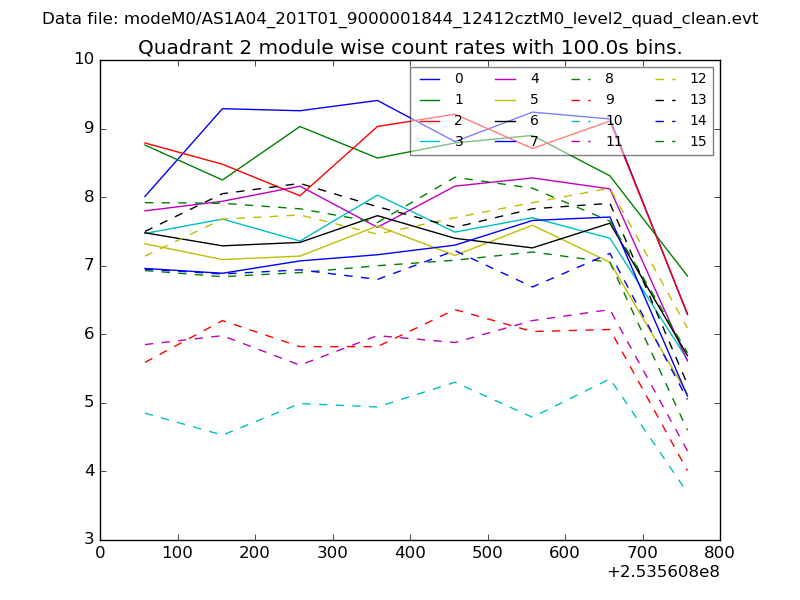
| Module-wise count rates for Quadrant B Data is divided into 100 sec bins |
 |
 |
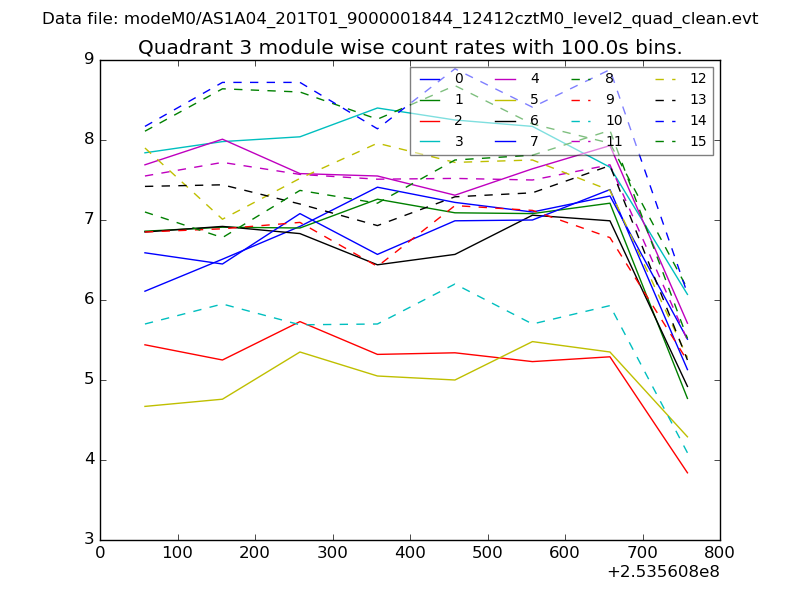
| Module-wise count rates for Quadrant C Data is divided into 100 sec bins |
 |
 |
| Module-wise count rates for Quadrant D Data is divided into 100 sec bins |
 |
 |
| Parameter | Plot |
|---|---|
| CZT HV Monitor | 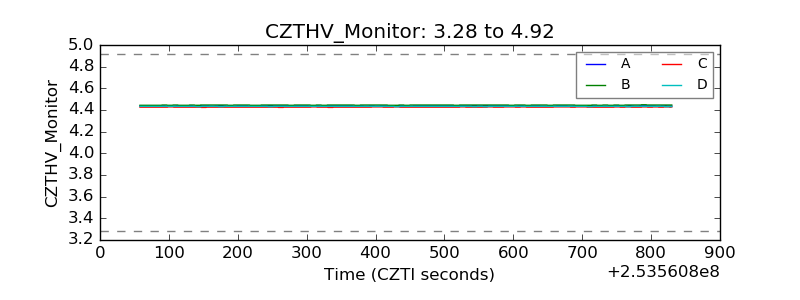 |
| D_VDD | 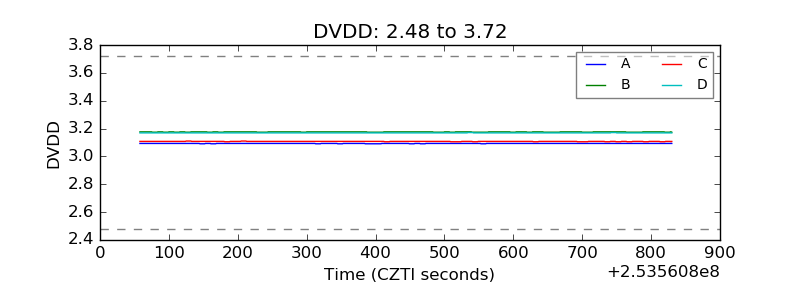 |
| Temperature 1 | 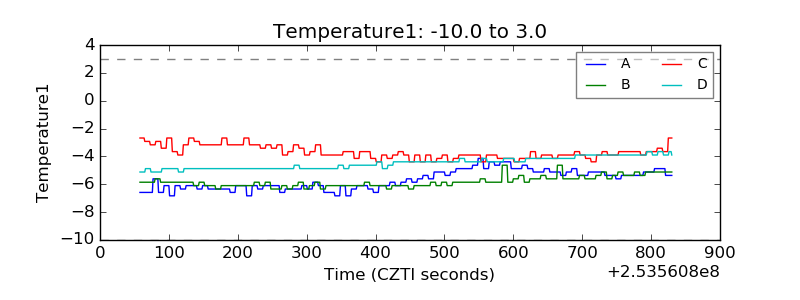 |
| Veto HV Monitor |  |
| Veto LLD | 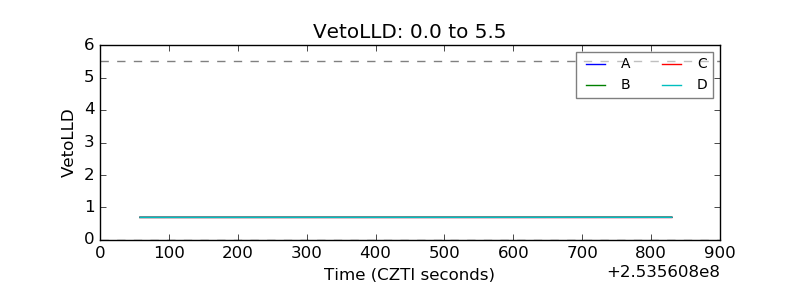 |
| Alpha Counter | 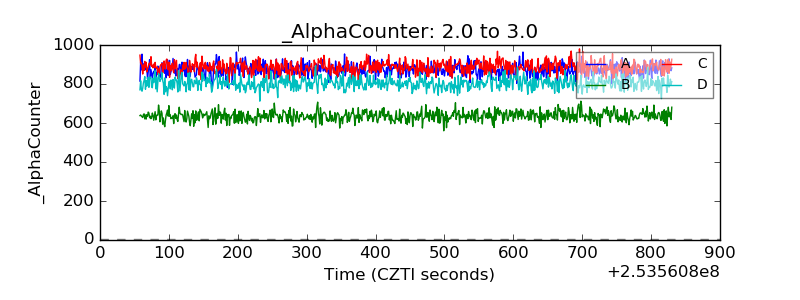 |
| _CPM_Rate | 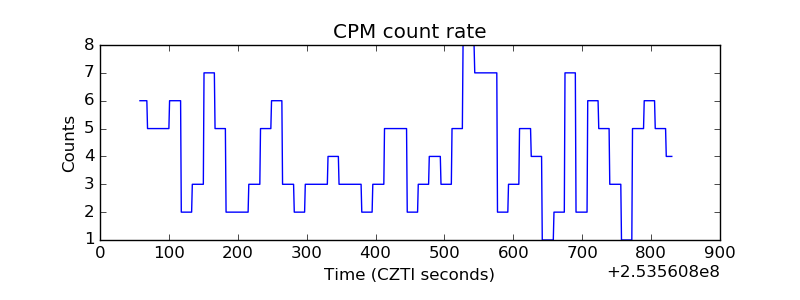 |
| CZT Counter | 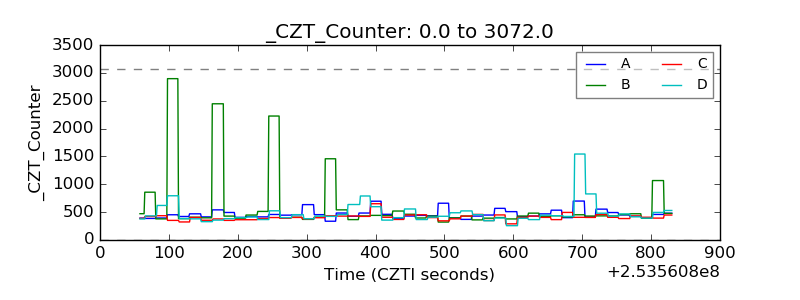 |
| +2.5 Volts monitor |  |
| +5 Volts monitor |  |
| _ROLL_ROT | 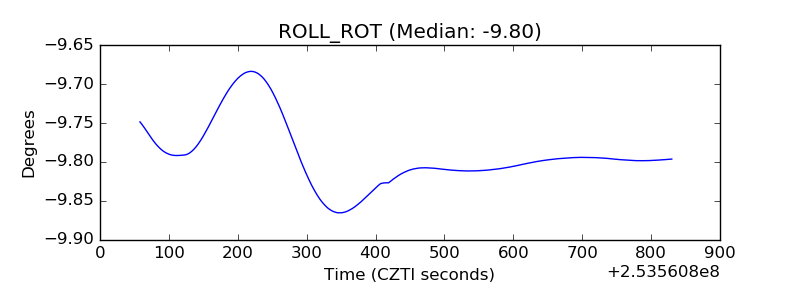 |
| _Roll_DEC | 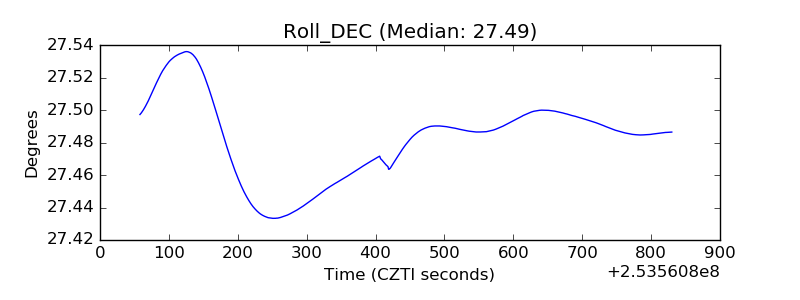 |
| _Roll_RA | 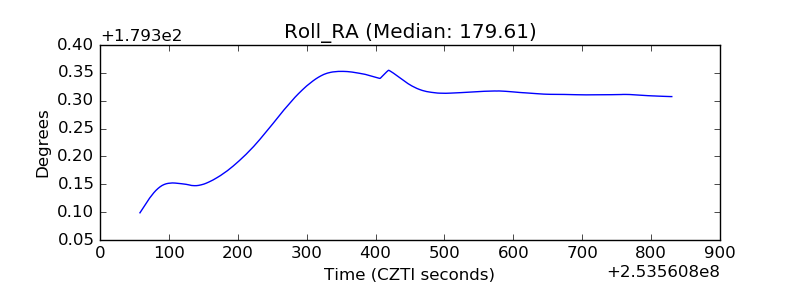 |
| Veto Counter | 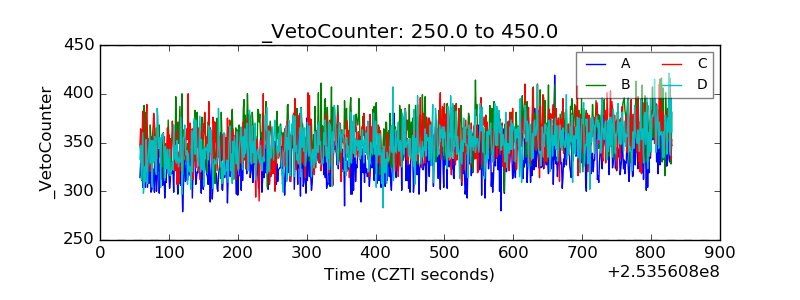 |