| Param | Original file | Final file |
|---|---|---|
| Filename | modeM0/AS1A04_201T01_9000001844_12413cztM0_level2.evt | modeM0/AS1A04_201T01_9000001844_12413cztM0_level2_quad_clean.evt |
| Size (bytes) | 597,844,800 | 109,333,440 |
| Size | 570.1 MB | 104.3 MB |
| Events in quadrant A | 4,490,185 | 682,187 |
| Events in quadrant B | 4,908,492 | 690,809 |
| Events in quadrant C | 3,879,483 | 689,240 |
| Events in quadrant D | 4,253,360 | 660,916 |
| Mode M9 | |||
|---|---|---|---|
| Quadrant | BADHDUFLAG | Total packets | Discarded packets |
| A | 0 | 16 | 0 |
| B | 0 | 16 | 0 |
| C | 0 | 16 | 0 |
| D | 0 | 16 | 0 |
| Mode SS | |||
|---|---|---|---|
| Quadrant | BADHDUFLAG | Total packets | Discarded packets |
| A | 0 | 176 | 0 |
| B | 0 | 176 | 0 |
| C | 0 | 176 | 0 |
| D | 0 | 176 | 0 |
| Mode M0 | |||
|---|---|---|---|
| Quadrant | BADHDUFLAG | Total packets | Discarded packets |
| A | 0 | 18809 | 3 |
| B | 0 | 20248 | 2 |
| C | 0 | 17259 | 2 |
| D | 0 | 18429 | 2 |
| Quadrant | Total seconds | Saturated seconds | Saturation percentage |
|---|---|---|---|
| A | 8458 | 68 | 0.803973% |
| B | 8458 | 260 | 3.074013% |
| C | 8458 | 33 | 0.390163% |
| D | 8458 | 84 | 0.993143% |
Noise dominated data is calculated using 1-second bins in cleaned event files. If a bin has >2000 counts, and if more than 50% of those come from <1% of pixels, then it is considered to be noise-dominated and hence unusable.
| Quadrant | # 1 sec bins | Bins with >0 counts | Bins with >2000 counts | High rate bins dominated by noise | Noise dominated (total time) | Noise dominated (detector-on time) | Marked lightcurve |
|---|---|---|---|---|---|---|---|
| A | 10169 | 8460 | 3 | 3 | 0.03% | 0.04% | 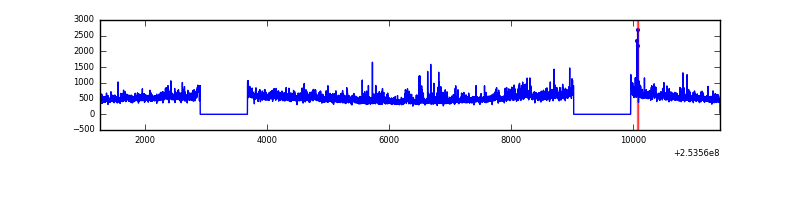 |
| B | 10169 | 8459 | 132 | 132 | 1.30% | 1.56% | 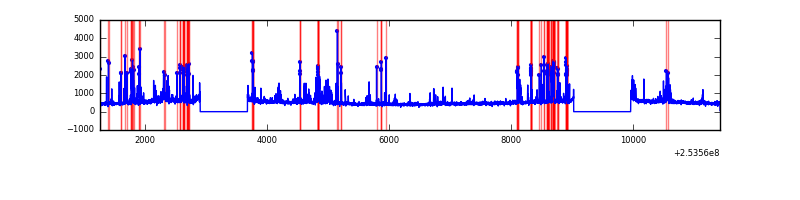 |
| C | 10169 | 8460 | 0 | 0 | 0.00% | 0.00% |  |
| D | 10169 | 8460 | 46 | 46 | 0.45% | 0.54% |  |
Top three noisy pixels from each quadrant. If the there are fewer than three noisy pixels in the level2.evt file, extra rows are filled as -1
| Pixel properties | Quadrant properties | ||||||
|---|---|---|---|---|---|---|---|
| Quadrant | DetID | PixID | Counts | Sigma | Mean | Median | Sigma |
| A | 13 | 251 | 155426 | 742.33 | 1015 | 994 | 208.0 |
| A | 12 | 189 | 105357 | 501.65 | 1015 | 994 | 208.0 |
| A | 1 | 162 | 95987 | 456.61 | 1015 | 994 | 208.0 |
| B | 4 | 239 | 533128 | 2750.89 | 1007 | 983 | 193.4 |
| B | 3 | 64 | 224975 | 1157.91 | 1007 | 983 | 193.4 |
| B | 0 | 197 | 70229 | 357.96 | 1007 | 983 | 193.4 |
| C | 14 | 234 | 20170 | 83.74 | 987 | 993 | 229.0 |
| C | 1 | 16 | 8669 | 33.52 | 987 | 993 | 229.0 |
| C | 13 | 61 | 6959 | 26.05 | 987 | 993 | 229.0 |
| D | 1 | 52 | 254956 | 1070.72 | 983 | 953 | 237.2 |
| D | 8 | 195 | 103830 | 433.67 | 983 | 953 | 237.2 |
| D | 13 | 104 | 59619 | 247.3 | 983 | 953 | 237.2 |
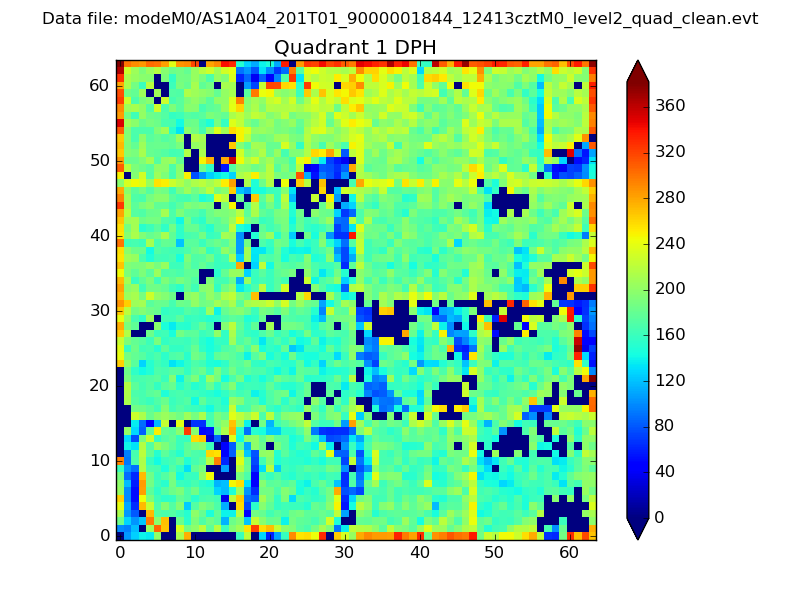
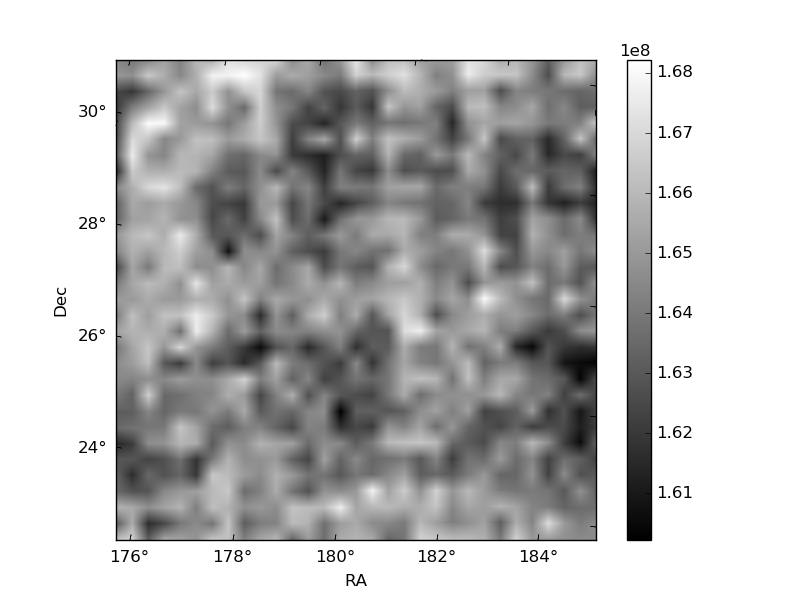
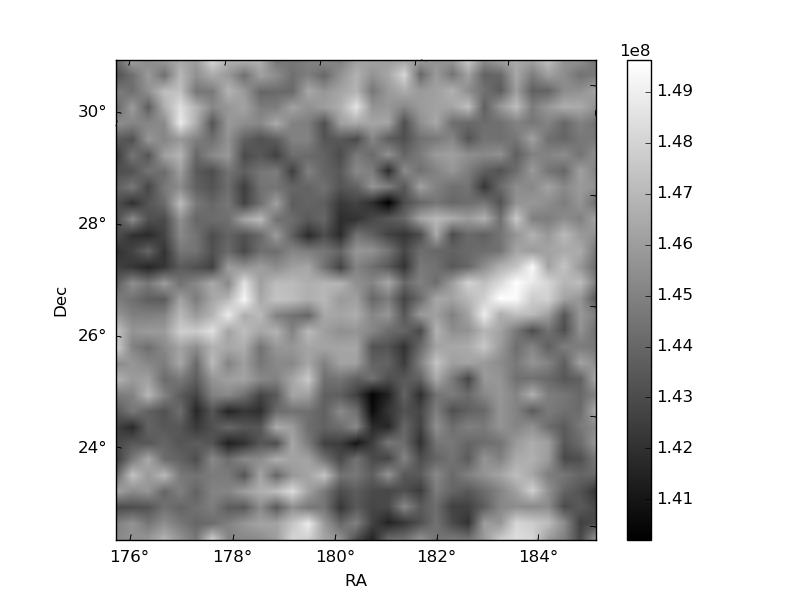
Histogram calculated using DETX and DETY for each event in the final _common_clean file
| Quadrant A |  |
 |
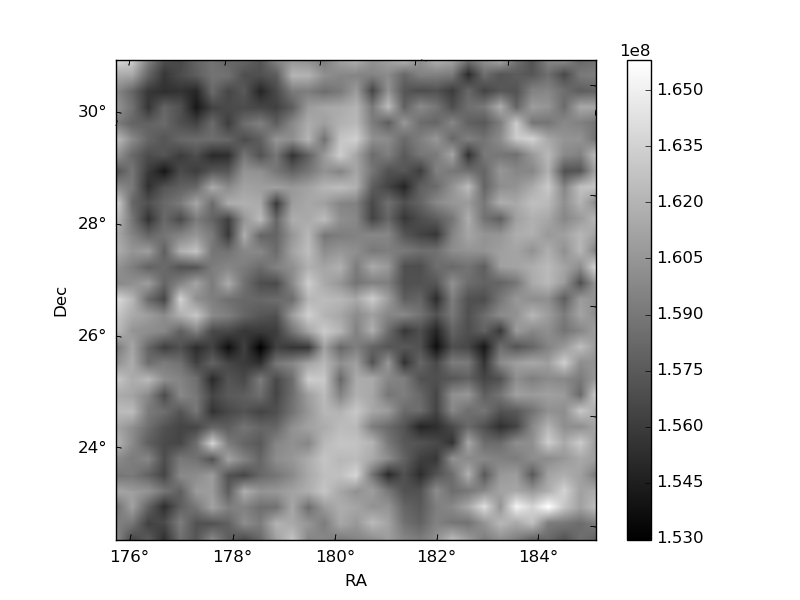
Quadrant B |
|---|---|---|---|
| Quadrant D | 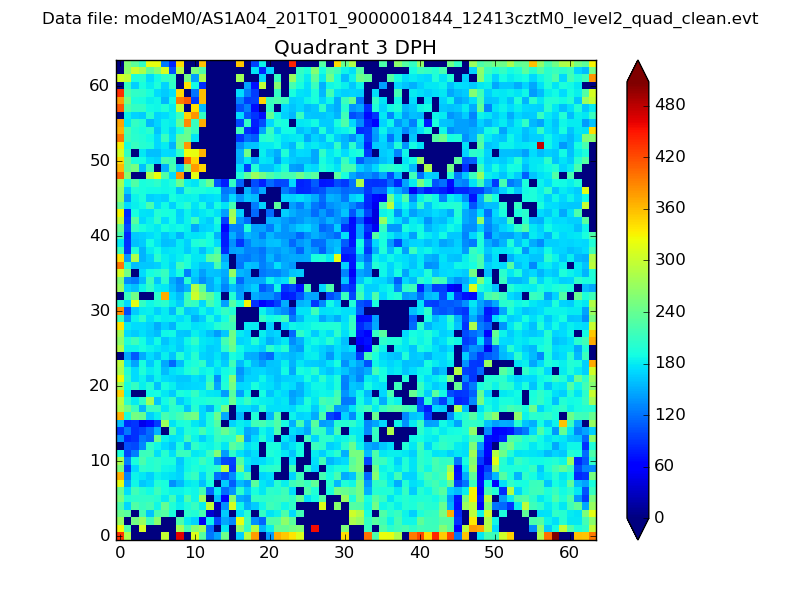 |
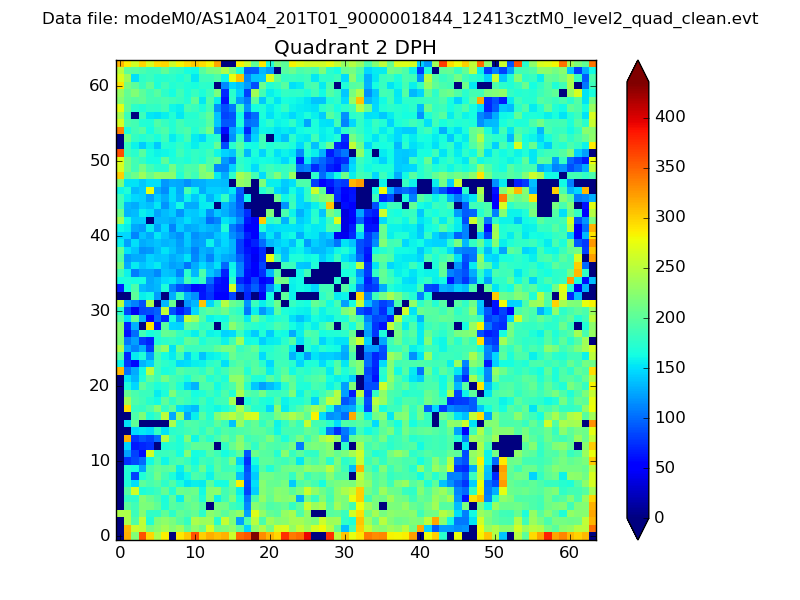 |
Quadrant C |
| Plot type | Count rate plots | Images |
|---|---|---|
| Comparison with Poisson distribution Blue bars denote a histogram of data divided into 1 sec bins. Red curve is a Poisson curve with rate = median count rate of data. |
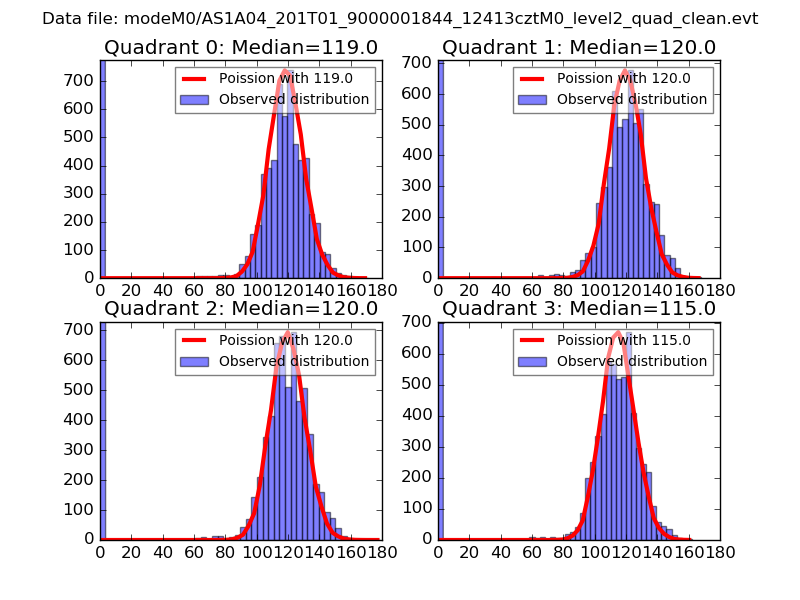 |
 |
| Quadrant-wise count rates Data is divided into 100 sec bins |
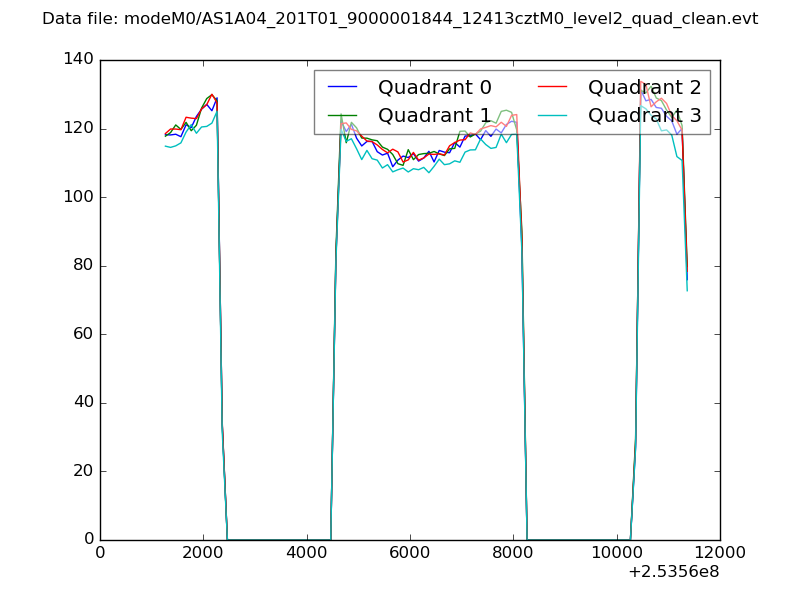 |
|
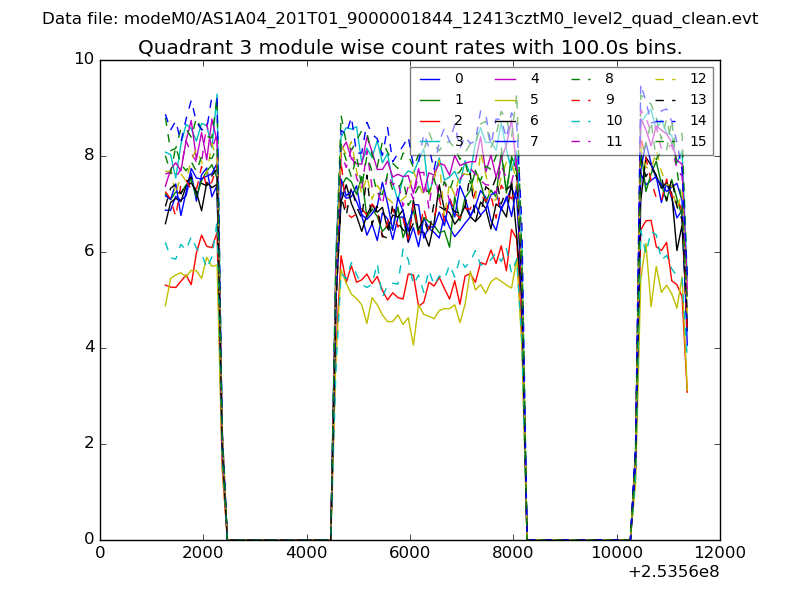
| Module-wise count rates for Quadrant A Data is divided into 100 sec bins |
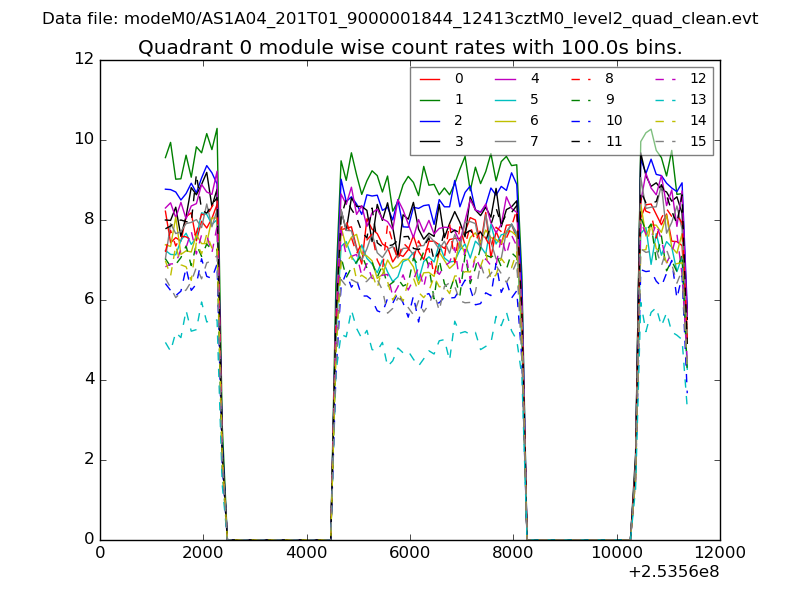 |
 |
| Module-wise count rates for Quadrant B Data is divided into 100 sec bins |
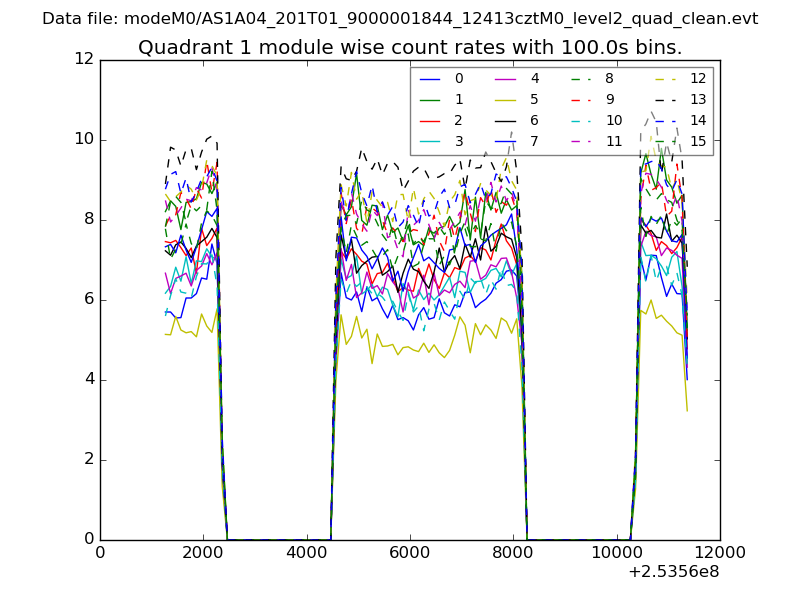 |
 |
| Module-wise count rates for Quadrant C Data is divided into 100 sec bins |
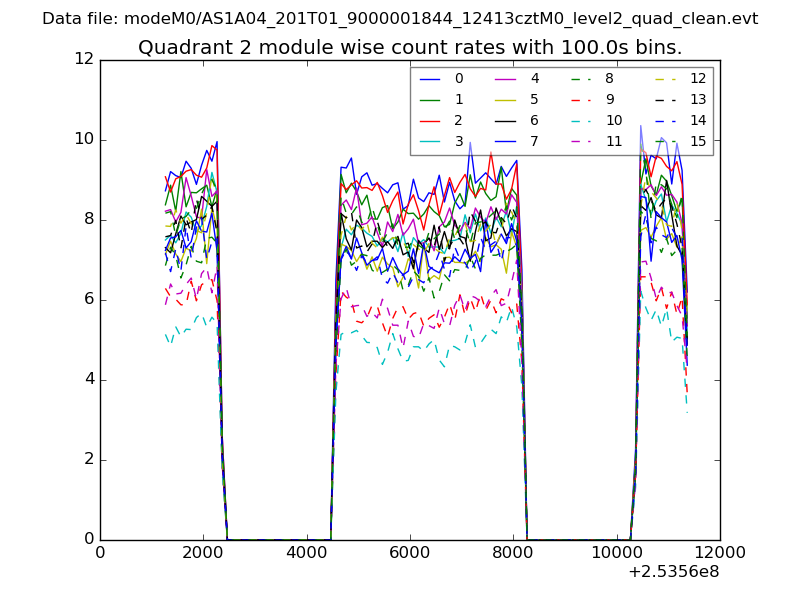 |
 |
| Module-wise count rates for Quadrant D Data is divided into 100 sec bins |
 |
 |
| Parameter | Plot |
|---|---|
| CZT HV Monitor | 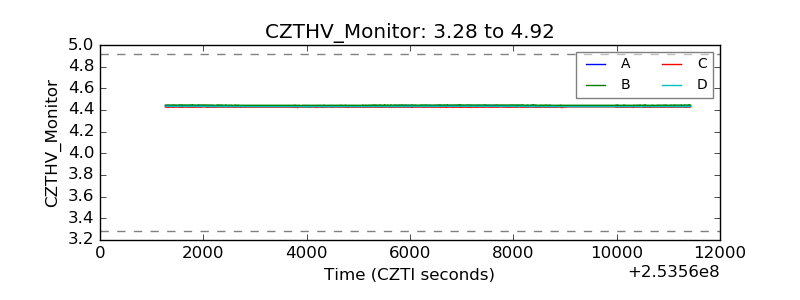 |
| D_VDD | 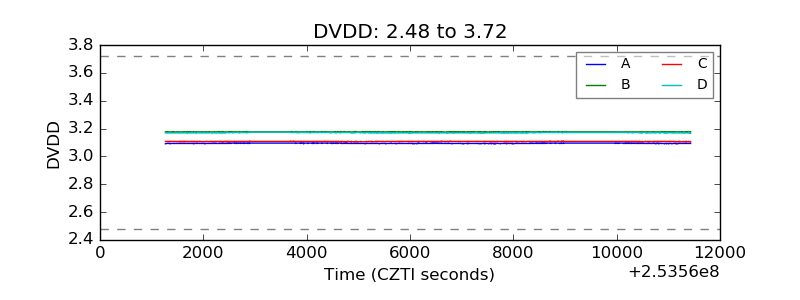 |
| Temperature 1 | 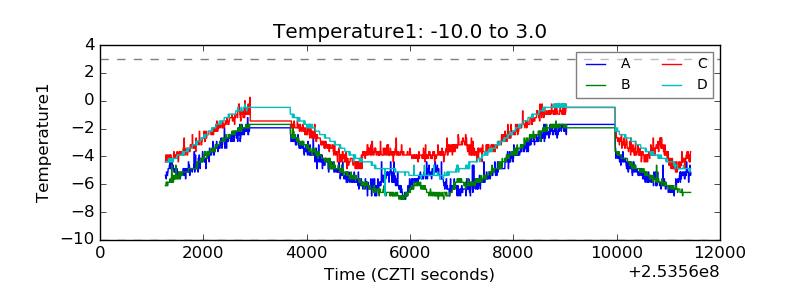 |
| Veto HV Monitor | 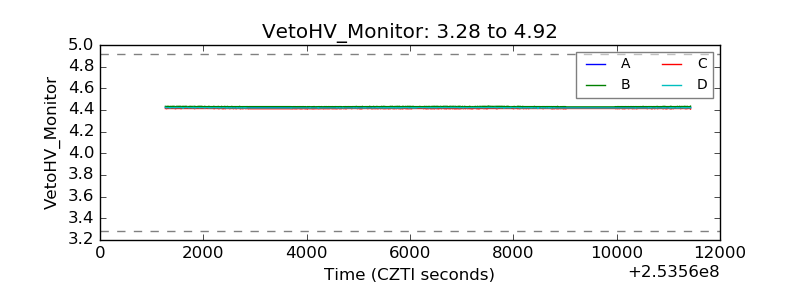 |
| Veto LLD | 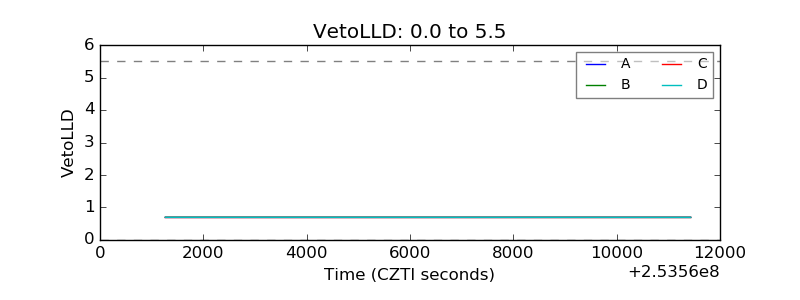 |
| Alpha Counter | 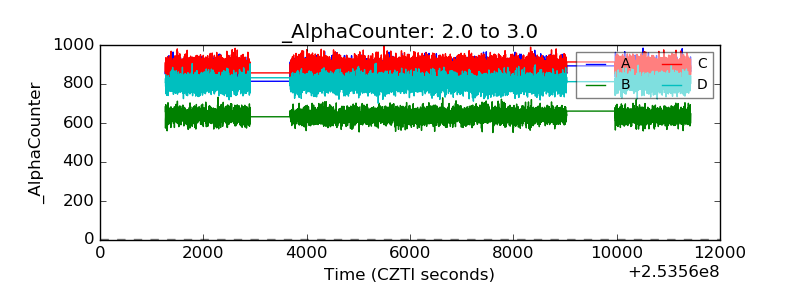 |
| _CPM_Rate | 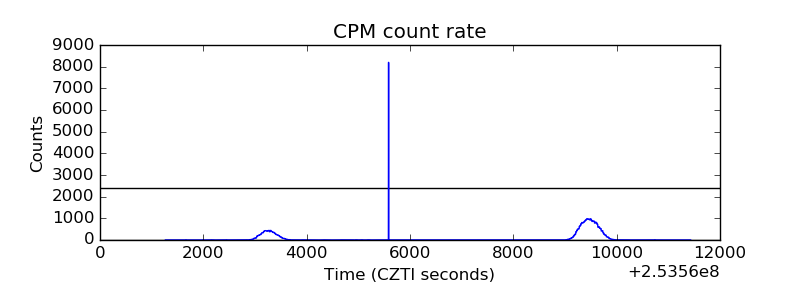 |
| CZT Counter | 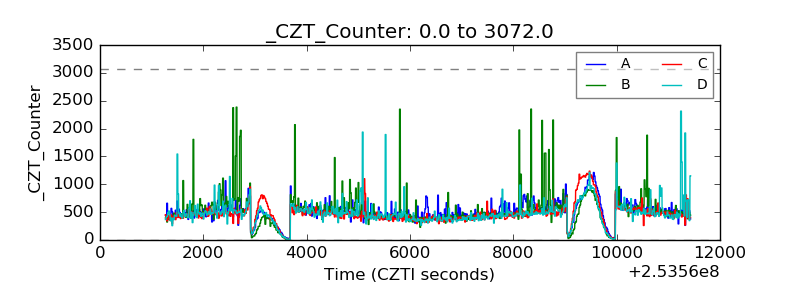 |
| +2.5 Volts monitor |  |
| +5 Volts monitor |  |
| _ROLL_ROT | 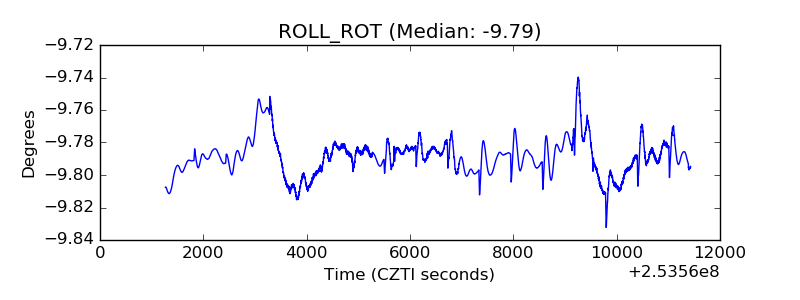 |
| _Roll_DEC | 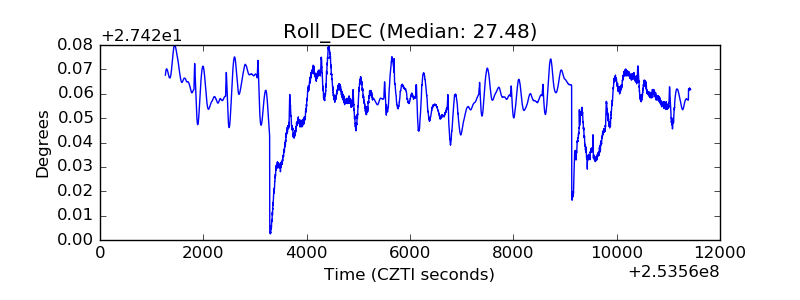 |
| _Roll_RA | 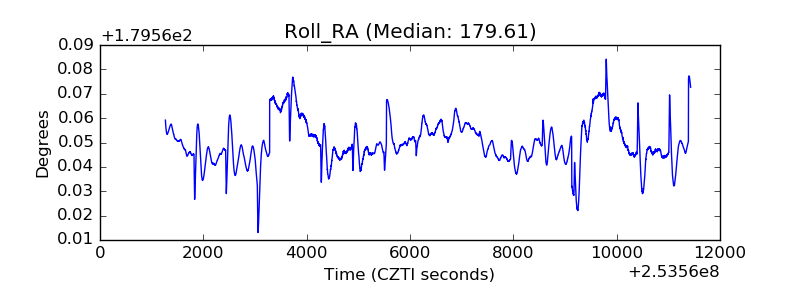 |
| Veto Counter | 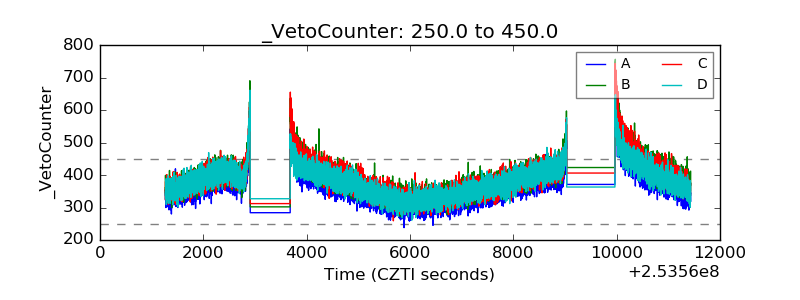 |