| Param | Original file | Final file |
|---|---|---|
| Filename | modeM0/AS1A04_201T01_9000001844_12414cztM0_level2.evt | modeM0/AS1A04_201T01_9000001844_12414cztM0_level2_quad_clean.evt |
| Size (bytes) | 541,252,800 | 95,339,520 |
| Size | 516.2 MB | 90.9 MB |
| Events in quadrant A | 3,925,113 | 601,810 |
| Events in quadrant B | 4,198,609 | 616,046 |
| Events in quadrant C | 3,305,962 | 610,049 |
| Events in quadrant D | 4,478,794 | 563,091 |
| Mode M9 | |||
|---|---|---|---|
| Quadrant | BADHDUFLAG | Total packets | Discarded packets |
| A | 0 | 19 | 0 |
| B | 0 | 19 | 0 |
| C | 0 | 19 | 0 |
| D | 0 | 19 | 0 |
| Mode SS | |||
|---|---|---|---|
| Quadrant | BADHDUFLAG | Total packets | Discarded packets |
| A | 0 | 148 | 0 |
| B | 0 | 148 | 0 |
| C | 0 | 148 | 0 |
| D | 0 | 148 | 0 |
| Mode M0 | |||
|---|---|---|---|
| Quadrant | BADHDUFLAG | Total packets | Discarded packets |
| A | 0 | 16440 | 3 |
| B | 0 | 17240 | 2 |
| C | 0 | 14691 | 2 |
| D | 0 | 18159 | 2 |
| Quadrant | Total seconds | Saturated seconds | Saturation percentage |
|---|---|---|---|
| A | 7119 | 83 | 1.165894% |
| B | 7119 | 218 | 3.062228% |
| C | 7119 | 34 | 0.477595% |
| D | 7119 | 292 | 4.101700% |
Noise dominated data is calculated using 1-second bins in cleaned event files. If a bin has >2000 counts, and if more than 50% of those come from <1% of pixels, then it is considered to be noise-dominated and hence unusable.
| Quadrant | # 1 sec bins | Bins with >0 counts | Bins with >2000 counts | High rate bins dominated by noise | Noise dominated (total time) | Noise dominated (detector-on time) | Marked lightcurve |
|---|---|---|---|---|---|---|---|
| A | 9110 | 7121 | 4 | 4 | 0.04% | 0.06% | 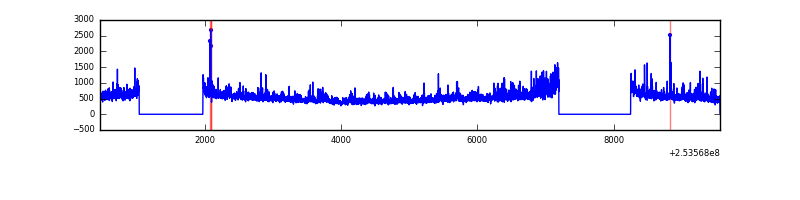 |
| B | 9110 | 7120 | 104 | 104 | 1.14% | 1.46% | 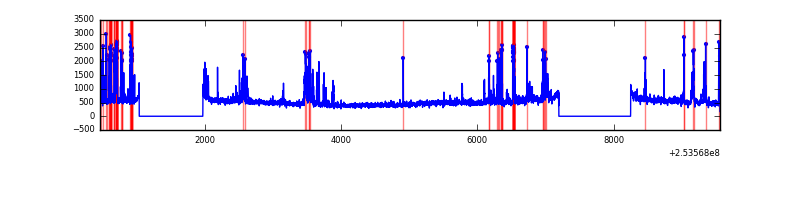 |
| C | 9110 | 7121 | 0 | 0 | 0.00% | 0.00% | 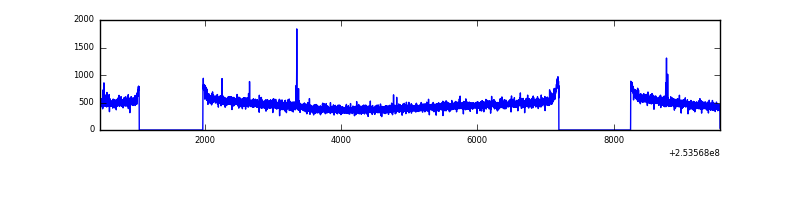 |
| D | 9110 | 7121 | 280 | 280 | 3.07% | 3.93% | 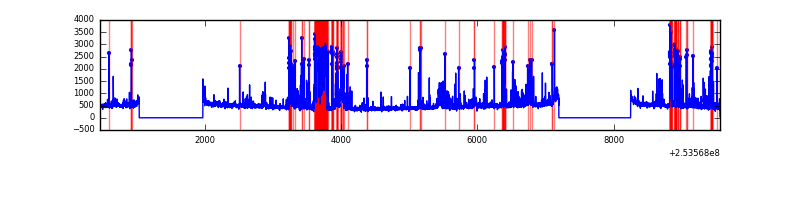 |
Top three noisy pixels from each quadrant. If the there are fewer than three noisy pixels in the level2.evt file, extra rows are filled as -1
| Pixel properties | Quadrant properties | ||||||
|---|---|---|---|---|---|---|---|
| Quadrant | DetID | PixID | Counts | Sigma | Mean | Median | Sigma |
| A | 13 | 251 | 211846 | 1205.11 | 860 | 842 | 175.1 |
| A | 1 | 162 | 112539 | 637.94 | 860 | 842 | 175.1 |
| A | 12 | 189 | 101246 | 573.44 | 860 | 842 | 175.1 |
| B | 4 | 239 | 547855 | 3345.24 | 859 | 839 | 163.5 |
| B | 3 | 64 | 86129 | 521.59 | 859 | 839 | 163.5 |
| B | 0 | 197 | 41017 | 245.71 | 859 | 839 | 163.5 |
| C | 14 | 234 | 11726 | 55.62 | 842 | 845 | 195.6 |
| C | 1 | 16 | 10223 | 47.94 | 842 | 845 | 195.6 |
| C | 13 | 61 | 6031 | 26.51 | 842 | 845 | 195.6 |
| D | 1 | 52 | 1159008 | 5793.56 | 825 | 802 | 199.9 |
| D | 8 | 195 | 64603 | 319.14 | 825 | 802 | 199.9 |
| D | 13 | 104 | 44031 | 216.24 | 825 | 802 | 199.9 |
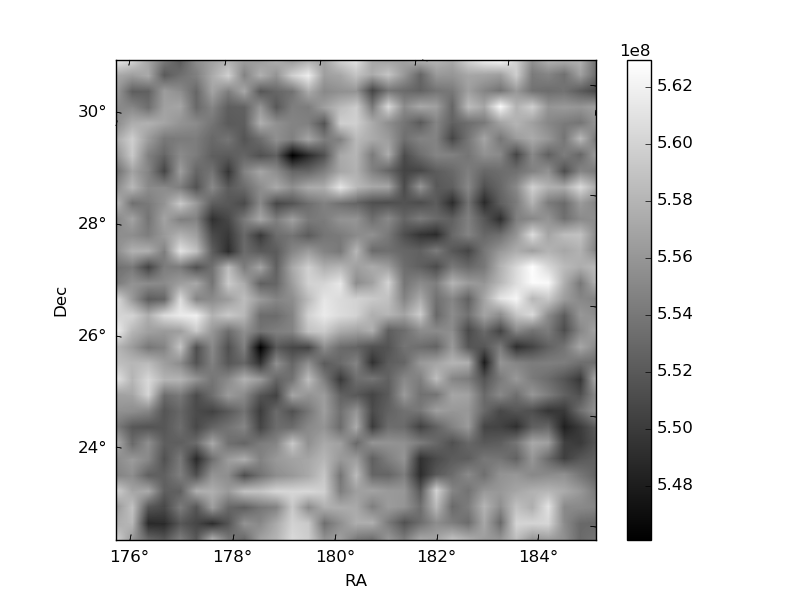
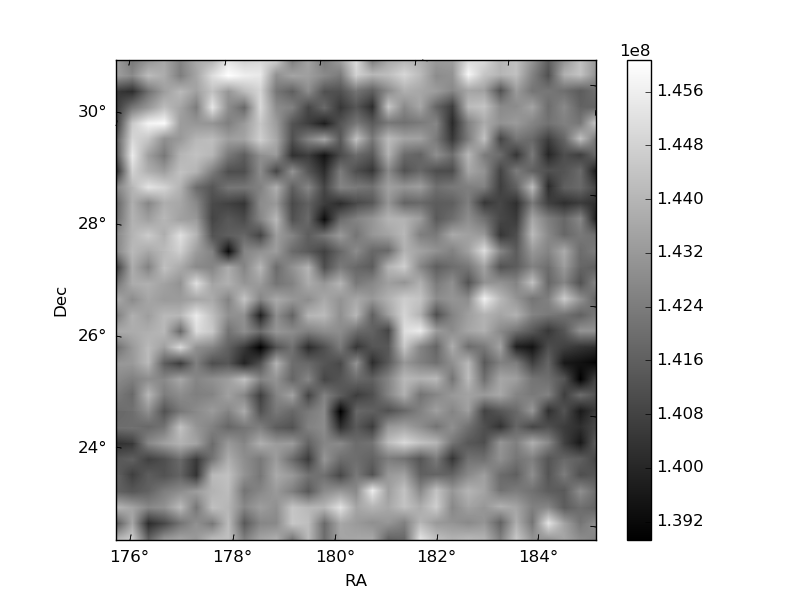
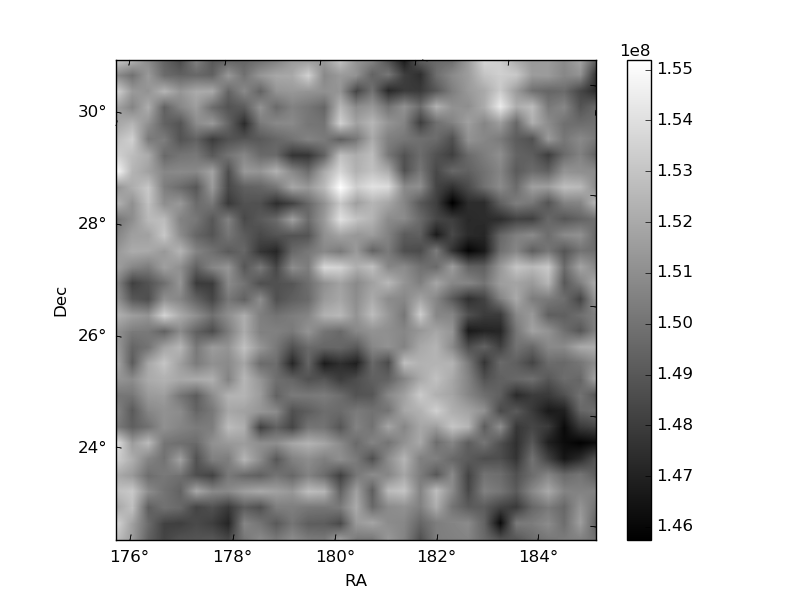
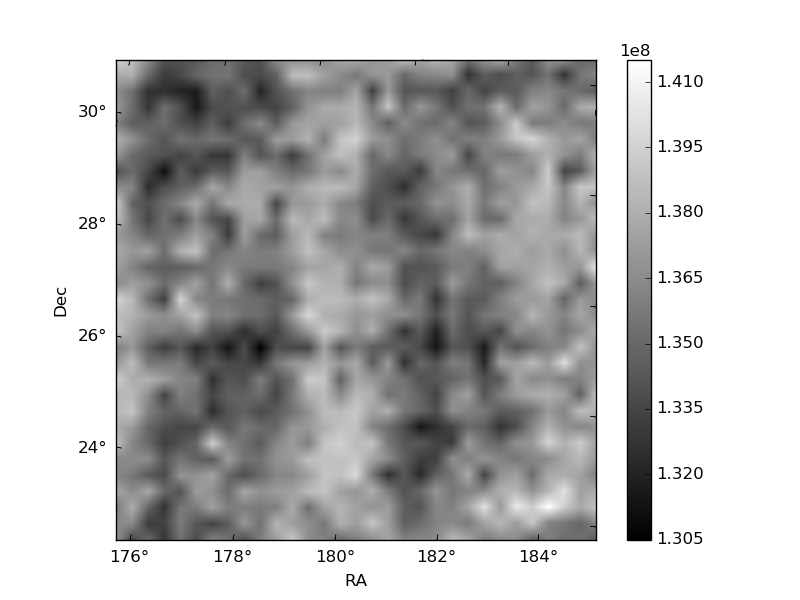
Histogram calculated using DETX and DETY for each event in the final _common_clean file
| Quadrant A | 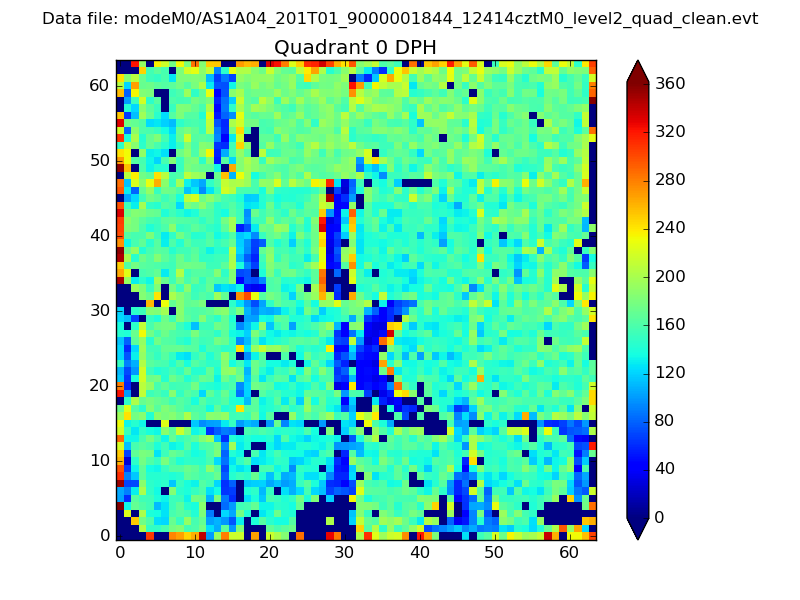 |
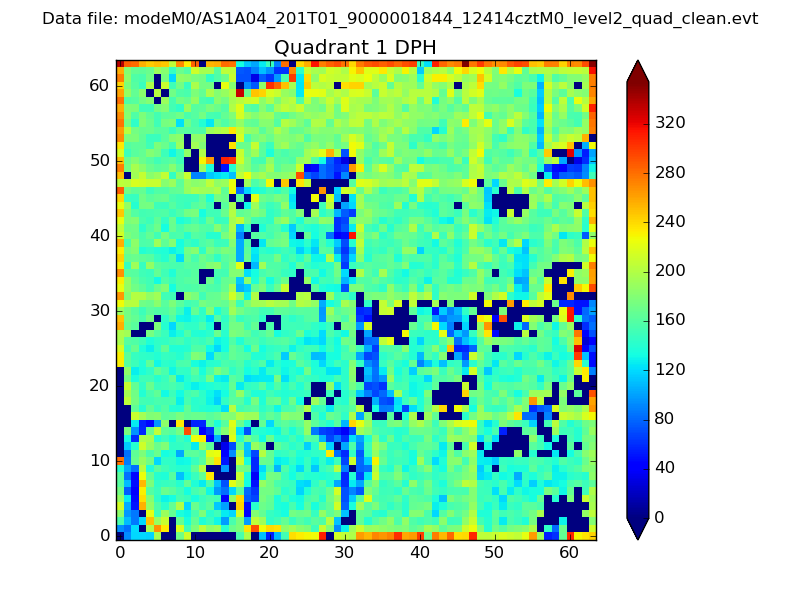 |
Quadrant B |
|---|---|---|---|
| Quadrant D | 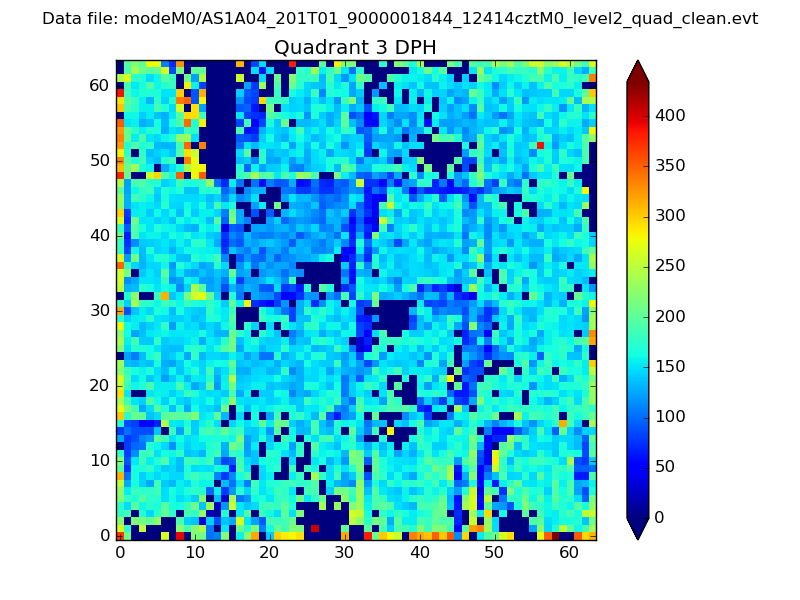 |
 |
Quadrant C |
| Plot type | Count rate plots | Images |
|---|---|---|
| Comparison with Poisson distribution Blue bars denote a histogram of data divided into 1 sec bins. Red curve is a Poisson curve with rate = median count rate of data. |
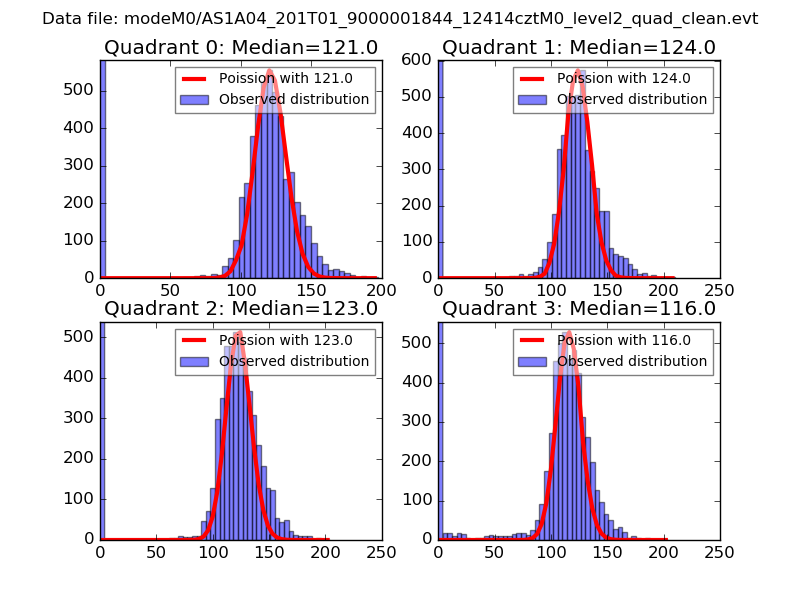 |
 |
| Quadrant-wise count rates Data is divided into 100 sec bins |
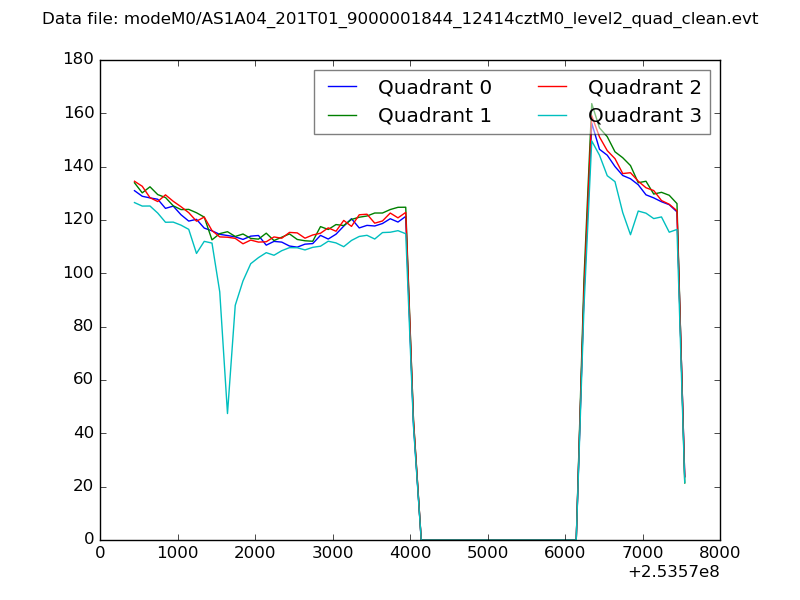 |
|
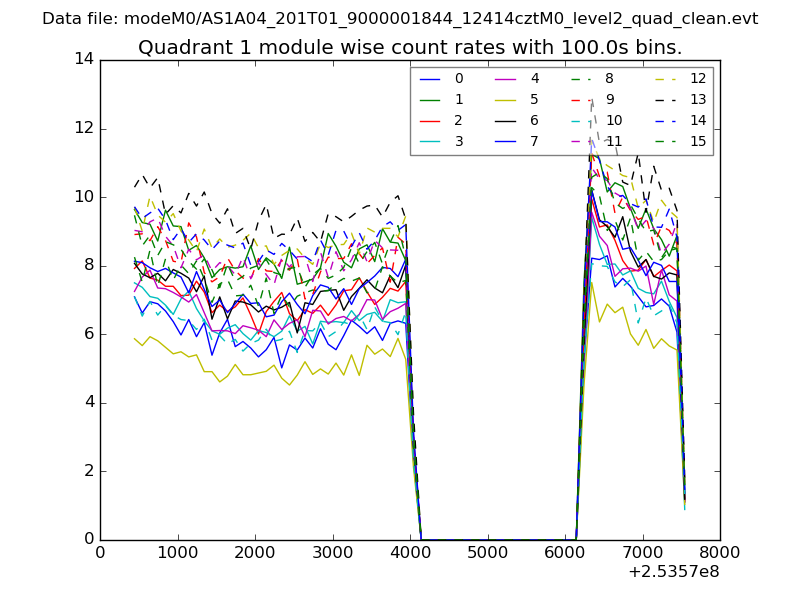
| Module-wise count rates for Quadrant A Data is divided into 100 sec bins |
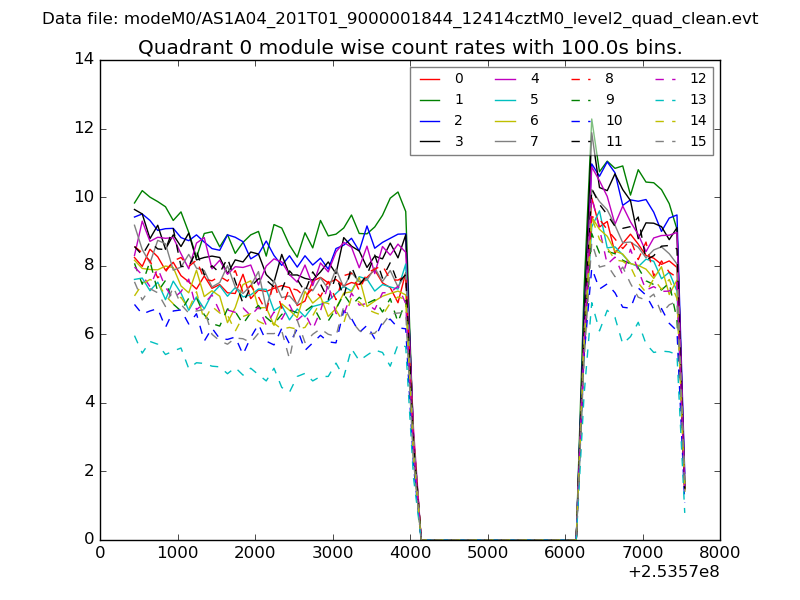 |
 |
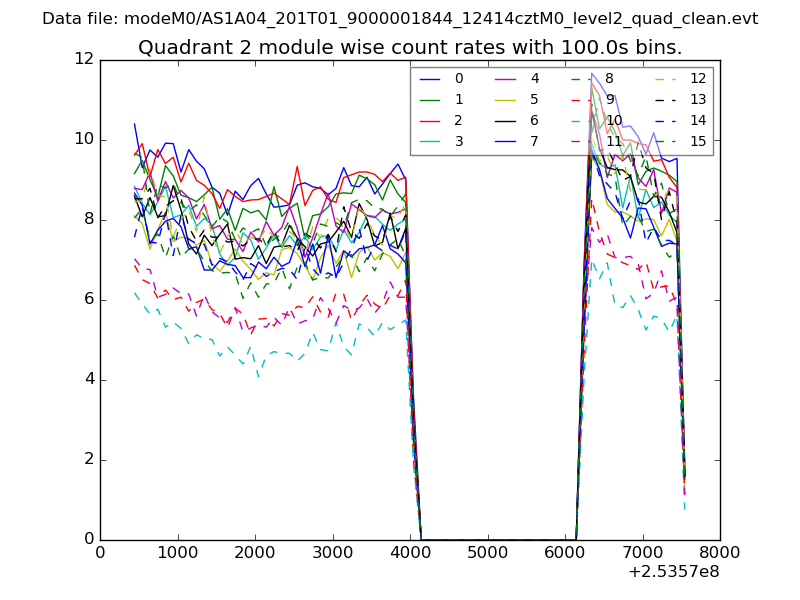
| Module-wise count rates for Quadrant B Data is divided into 100 sec bins |
 |
 |
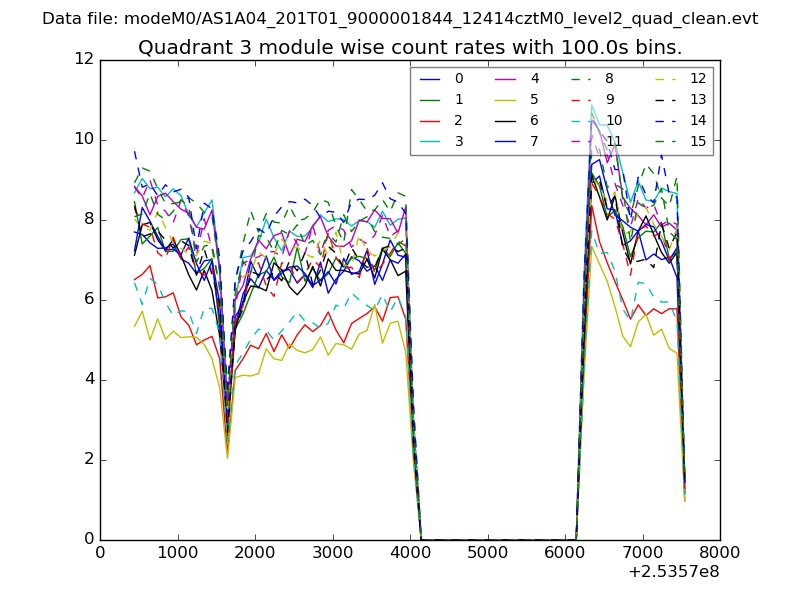
| Module-wise count rates for Quadrant C Data is divided into 100 sec bins |
 |
 |
| Module-wise count rates for Quadrant D Data is divided into 100 sec bins |
 |
 |
| Parameter | Plot |
|---|---|
| CZT HV Monitor | 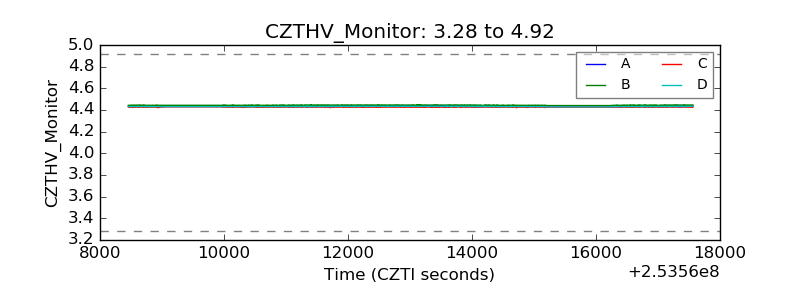 |
| D_VDD | 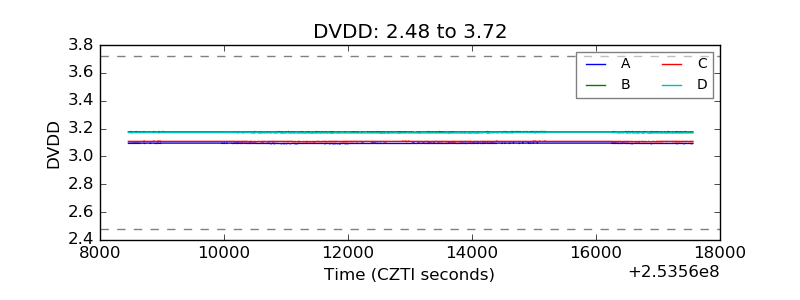 |
| Temperature 1 | 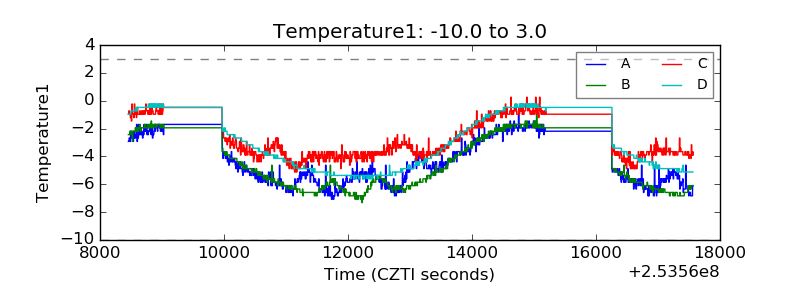 |
| Veto HV Monitor | 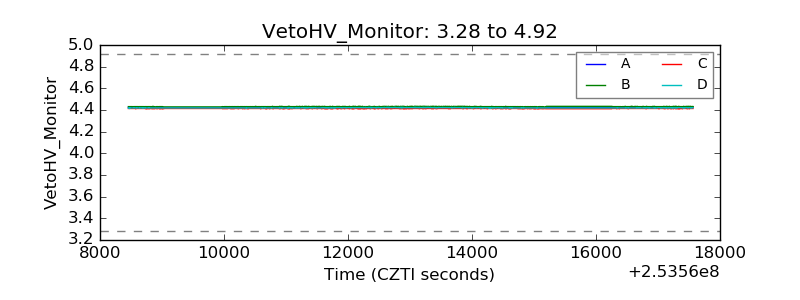 |
| Veto LLD | 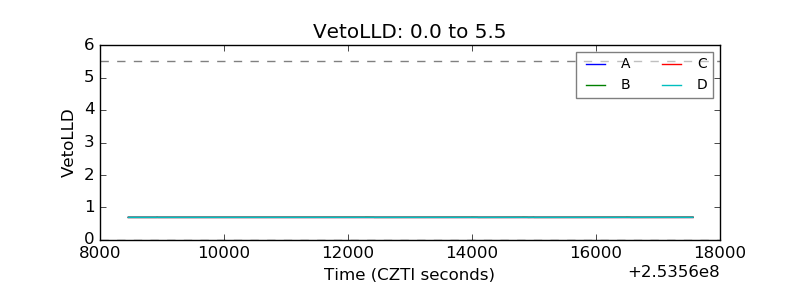 |
| Alpha Counter | 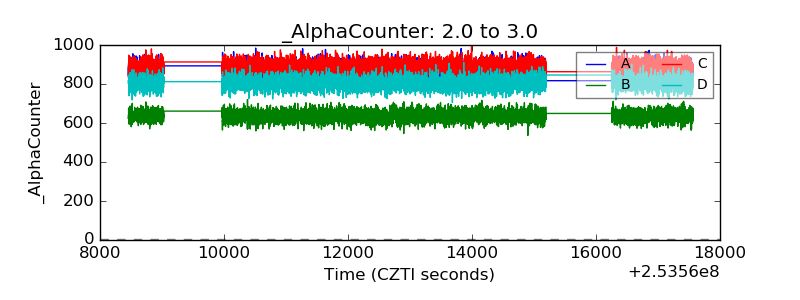 |
| _CPM_Rate | 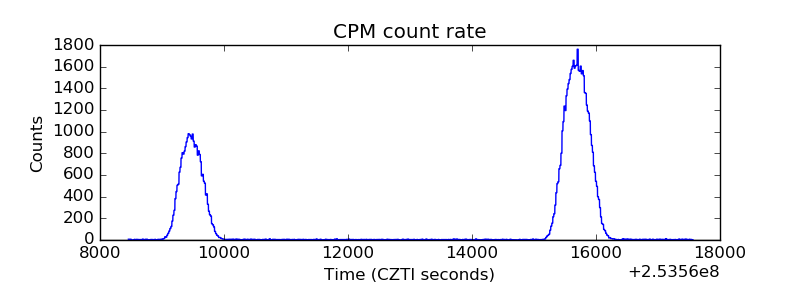 |
| CZT Counter | 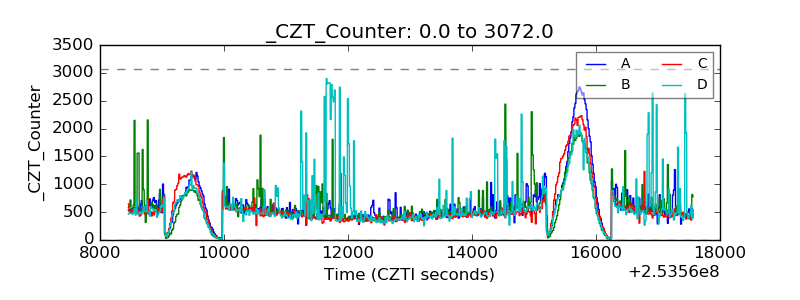 |
| +2.5 Volts monitor |  |
| +5 Volts monitor |  |
| _ROLL_ROT | 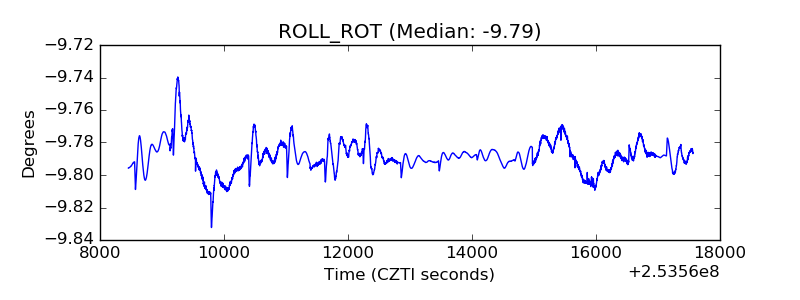 |
| _Roll_DEC | 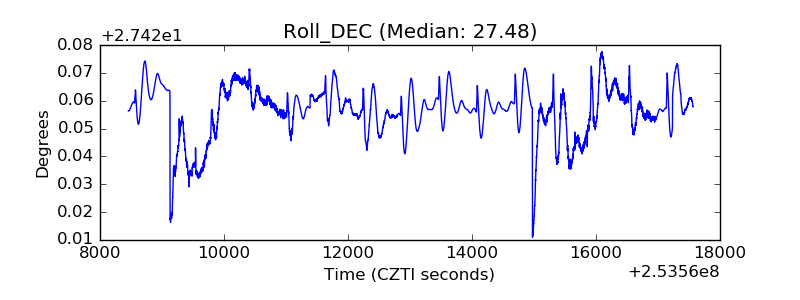 |
| _Roll_RA | 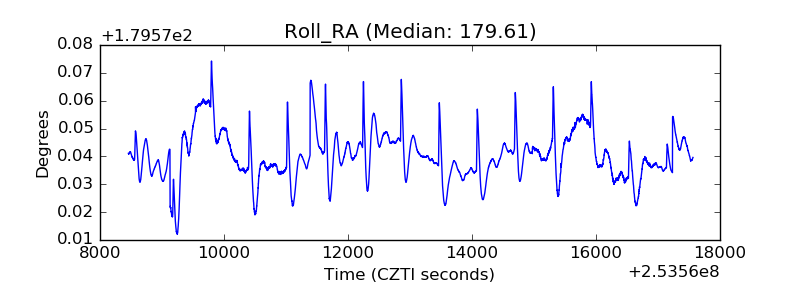 |
| Veto Counter | 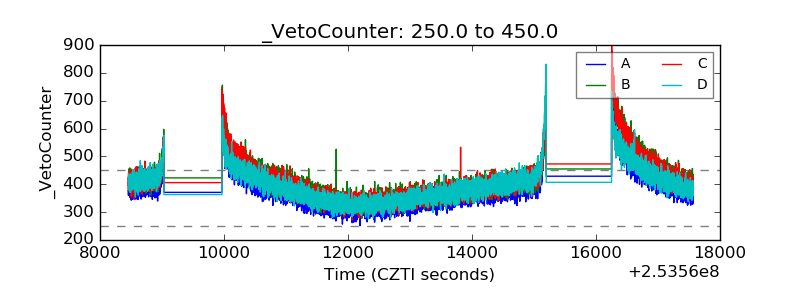 |