| Param | Original file | Final file |
|---|---|---|
| Filename | modeM0/AS1A04_201T01_9000001844_12417cztM0_level2.evt | modeM0/AS1A04_201T01_9000001844_12417cztM0_level2_quad_clean.evt |
| Size (bytes) | 903,484,800 | 173,373,120 |
| Size | 861.6 MB | 165.3 MB |
| Events in quadrant A | 6,304,323 | 1,117,241 |
| Events in quadrant B | 7,582,572 | 1,145,660 |
| Events in quadrant C | 5,438,959 | 1,128,662 |
| Events in quadrant D | 7,247,152 | 1,052,293 |
| Mode M9 | |||
|---|---|---|---|
| Quadrant | BADHDUFLAG | Total packets | Discarded packets |
| A | 0 | 33 | 0 |
| B | 0 | 33 | 0 |
| C | 0 | 33 | 0 |
| D | 0 | 33 | 0 |
| Mode SS | |||
|---|---|---|---|
| Quadrant | BADHDUFLAG | Total packets | Discarded packets |
| A | 0 | 238 | 0 |
| B | 0 | 238 | 0 |
| C | 0 | 238 | 0 |
| D | 0 | 238 | 0 |
| Mode M0 | |||
|---|---|---|---|
| Quadrant | BADHDUFLAG | Total packets | Discarded packets |
| A | 0 | 26409 | 4 |
| B | 0 | 30214 | 3 |
| C | 0 | 24255 | 3 |
| D | 0 | 29591 | 3 |
| Quadrant | Total seconds | Saturated seconds | Saturation percentage |
|---|---|---|---|
| A | 11668 | 89 | 0.762770% |
| B | 11668 | 478 | 4.096675% |
| C | 11668 | 40 | 0.342818% |
| D | 11668 | 389 | 3.333905% |
Noise dominated data is calculated using 1-second bins in cleaned event files. If a bin has >2000 counts, and if more than 50% of those come from <1% of pixels, then it is considered to be noise-dominated and hence unusable.
| Quadrant | # 1 sec bins | Bins with >0 counts | Bins with >2000 counts | High rate bins dominated by noise | Noise dominated (total time) | Noise dominated (detector-on time) | Marked lightcurve |
|---|---|---|---|---|---|---|---|
| A | 14089 | 11670 | 8 | 8 | 0.06% | 0.07% | 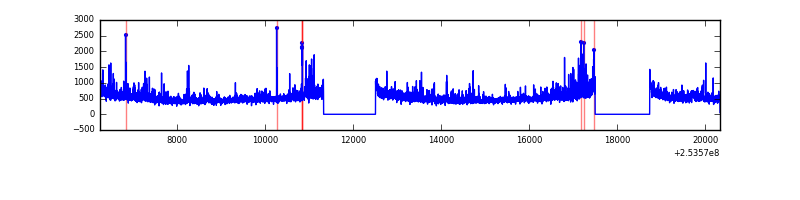 |
| B | 14089 | 11669 | 320 | 320 | 2.27% | 2.74% | 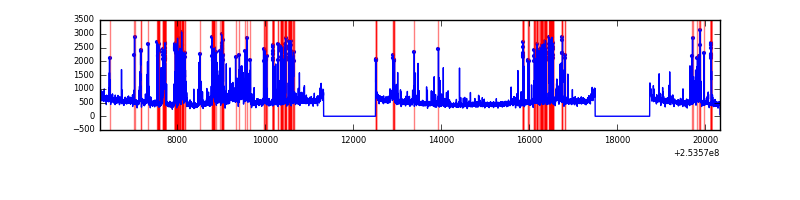 |
| C | 14089 | 11671 | 6 | 6 | 0.04% | 0.05% | 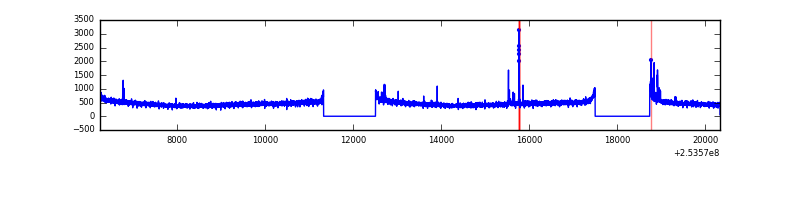 |
| D | 14089 | 11671 | 326 | 326 | 2.31% | 2.79% | 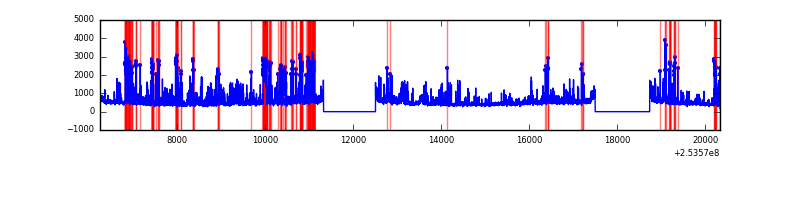 |
Top three noisy pixels from each quadrant. If the there are fewer than three noisy pixels in the level2.evt file, extra rows are filled as -1
| Pixel properties | Quadrant properties | ||||||
|---|---|---|---|---|---|---|---|
| Quadrant | DetID | PixID | Counts | Sigma | Mean | Median | Sigma |
| A | 13 | 251 | 219461 | 763.45 | 1412 | 1387 | 285.6 |
| A | 12 | 189 | 195772 | 680.52 | 1412 | 1387 | 285.6 |
| A | 1 | 162 | 176561 | 613.27 | 1412 | 1387 | 285.6 |
| B | 4 | 239 | 1749918 | 6660.68 | 1405 | 1369 | 262.5 |
| B | 3 | 64 | 159781 | 603.43 | 1405 | 1369 | 262.5 |
| B | 10 | 244 | 83842 | 314.16 | 1405 | 1369 | 262.5 |
| C | 15 | 208 | 50893 | 156.45 | 1375 | 1384 | 316.4 |
| C | 14 | 234 | 25459 | 76.08 | 1375 | 1384 | 316.4 |
| C | 13 | 61 | 10256 | 28.04 | 1375 | 1384 | 316.4 |
| D | 1 | 52 | 1889045 | 5977.82 | 1328 | 1290 | 315.8 |
| D | 13 | 104 | 136428 | 427.93 | 1328 | 1290 | 315.8 |
| D | 8 | 195 | 99707 | 311.65 | 1328 | 1290 | 315.8 |
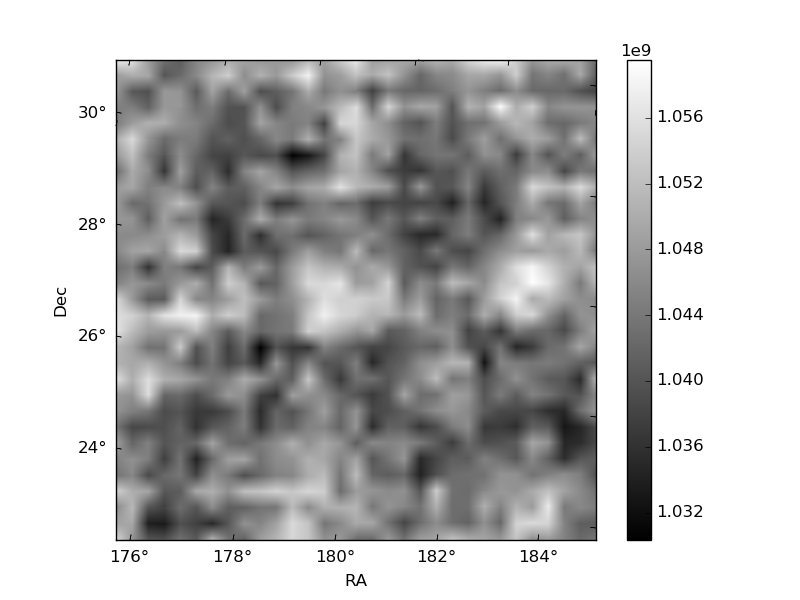
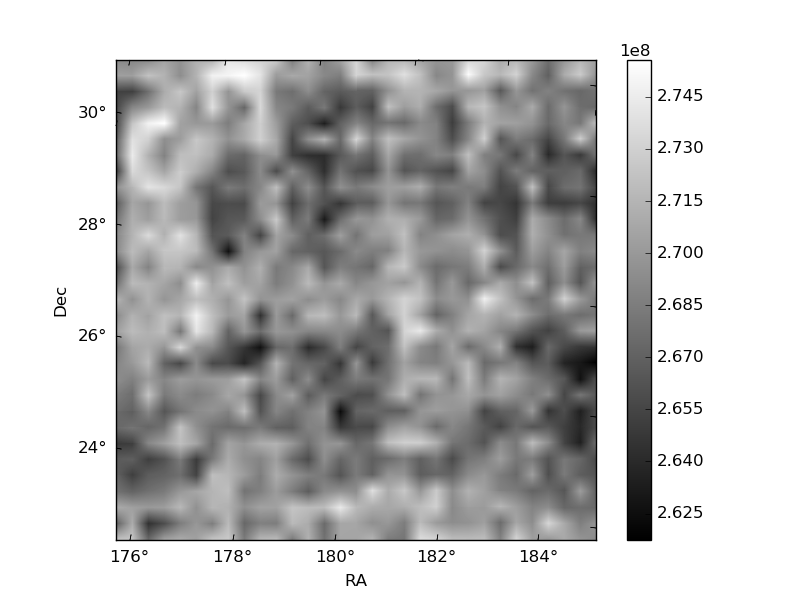
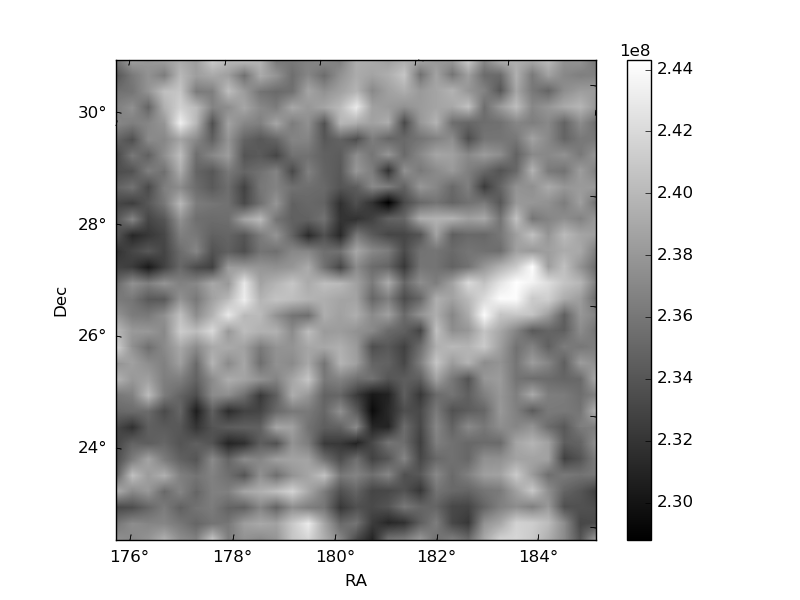
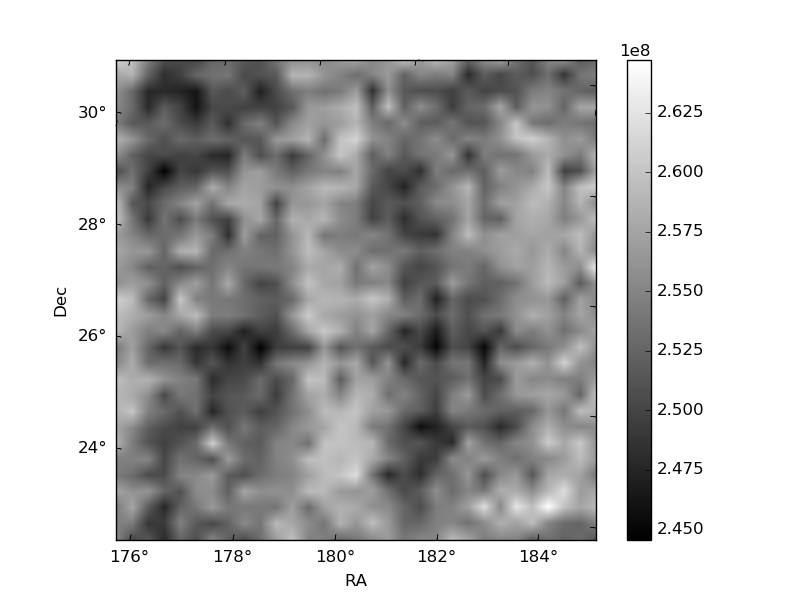
Histogram calculated using DETX and DETY for each event in the final _common_clean file
| Quadrant A | 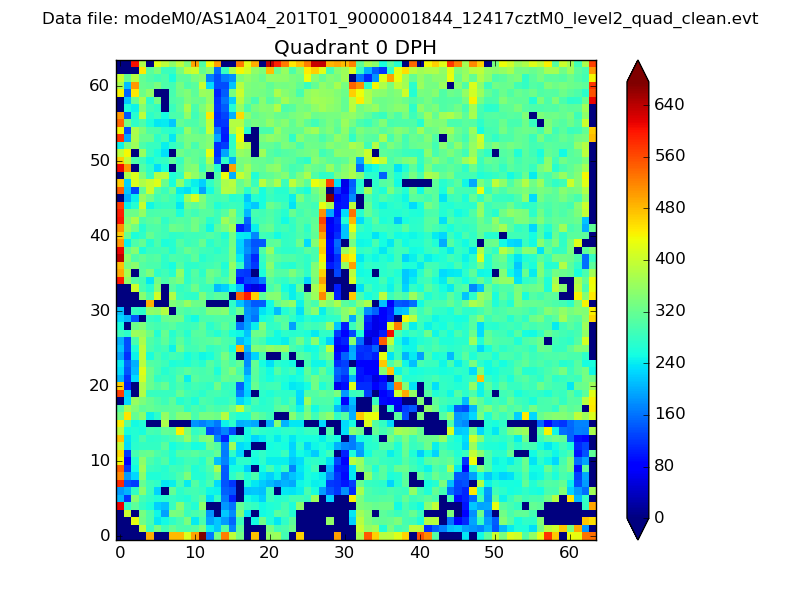 |
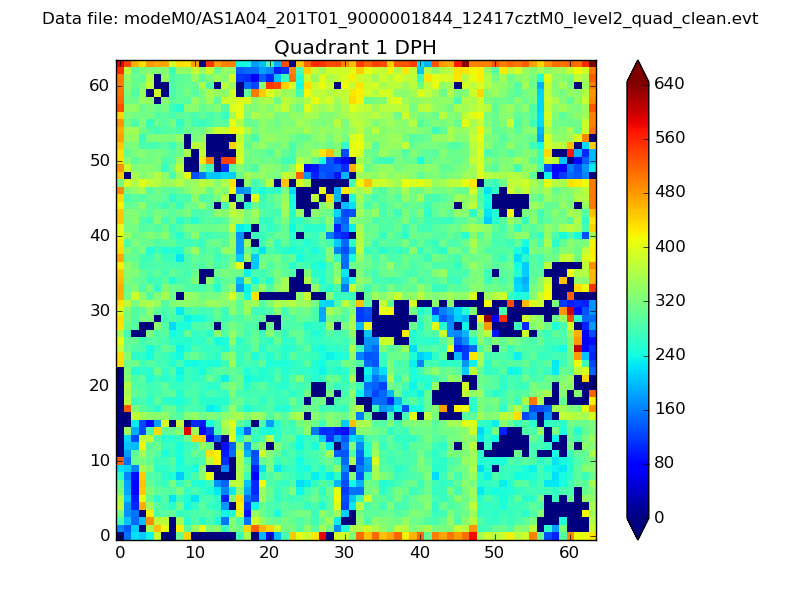 |
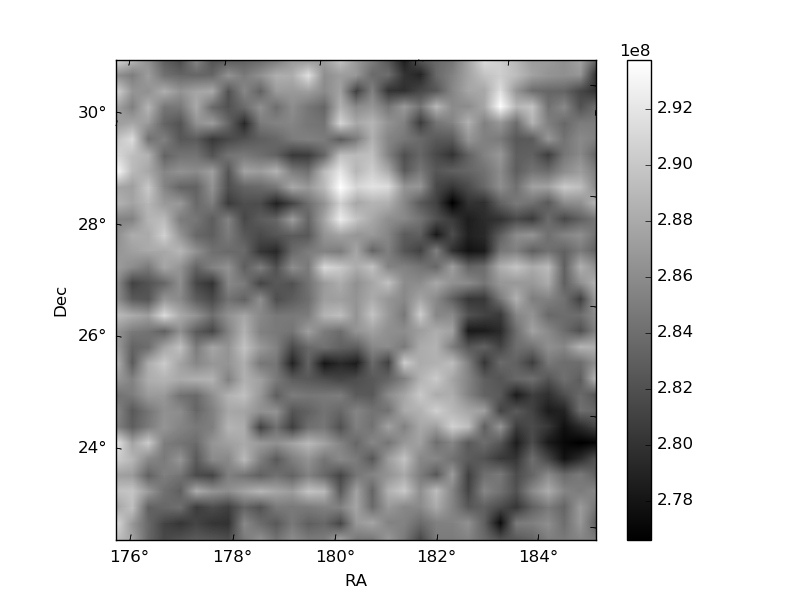
Quadrant B |
|---|---|---|---|
| Quadrant D | 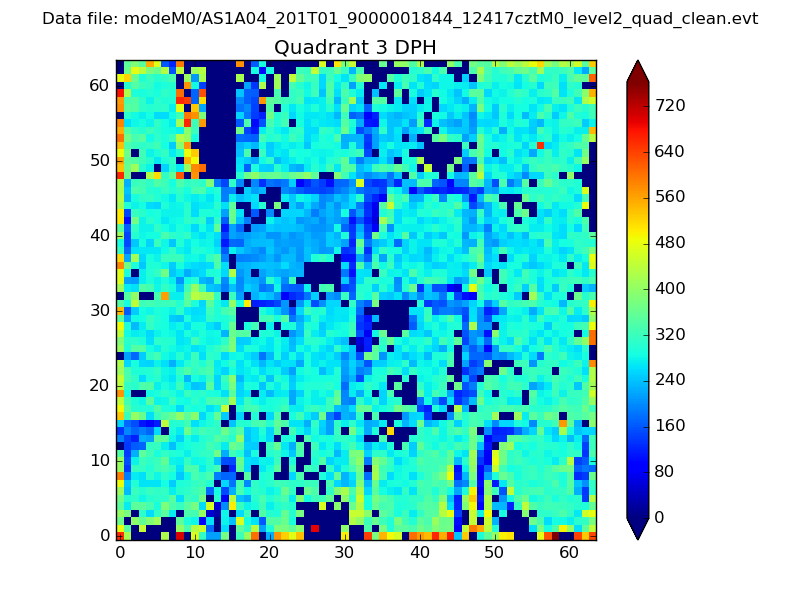 |
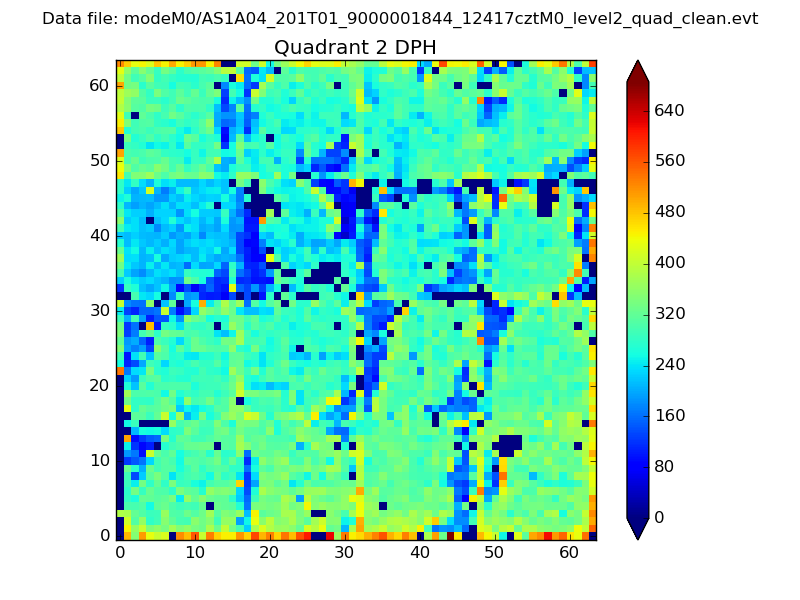 |
Quadrant C |
| Plot type | Count rate plots | Images |
|---|---|---|
| Comparison with Poisson distribution Blue bars denote a histogram of data divided into 1 sec bins. Red curve is a Poisson curve with rate = median count rate of data. |
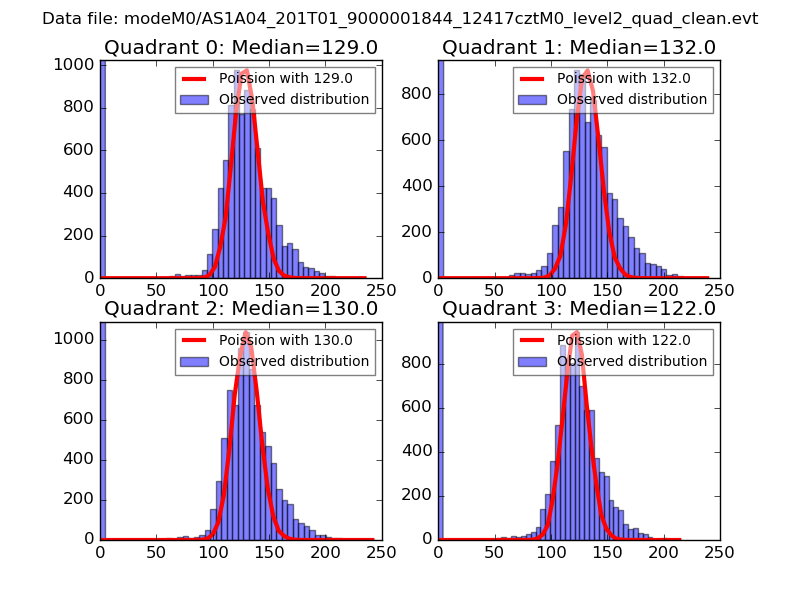 |
 |
| Quadrant-wise count rates Data is divided into 100 sec bins |
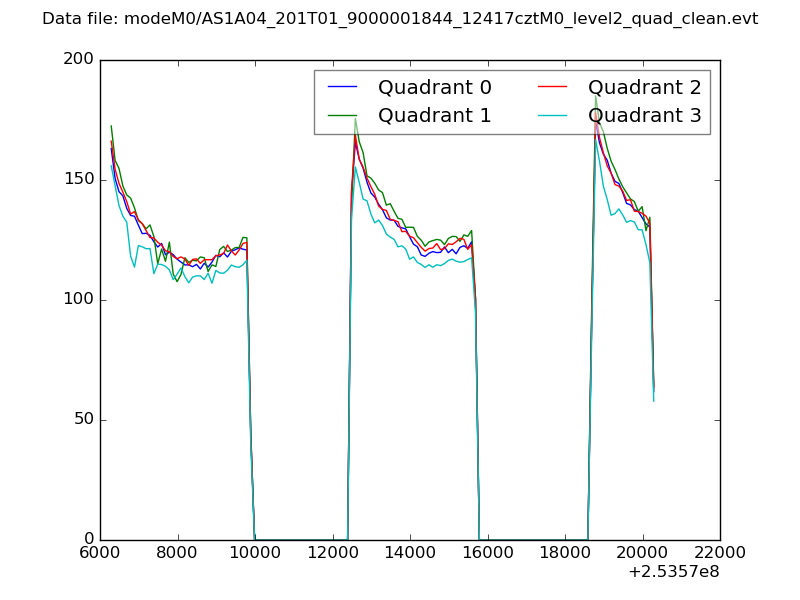 |
|
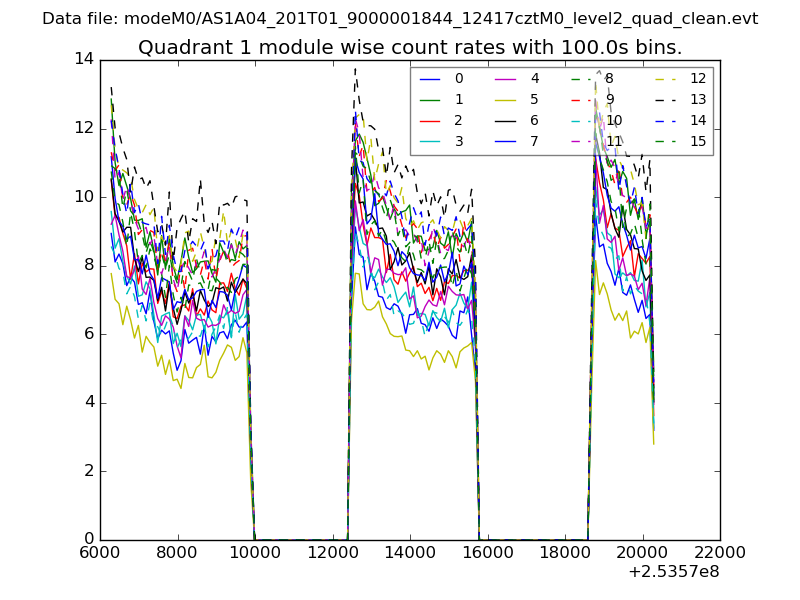
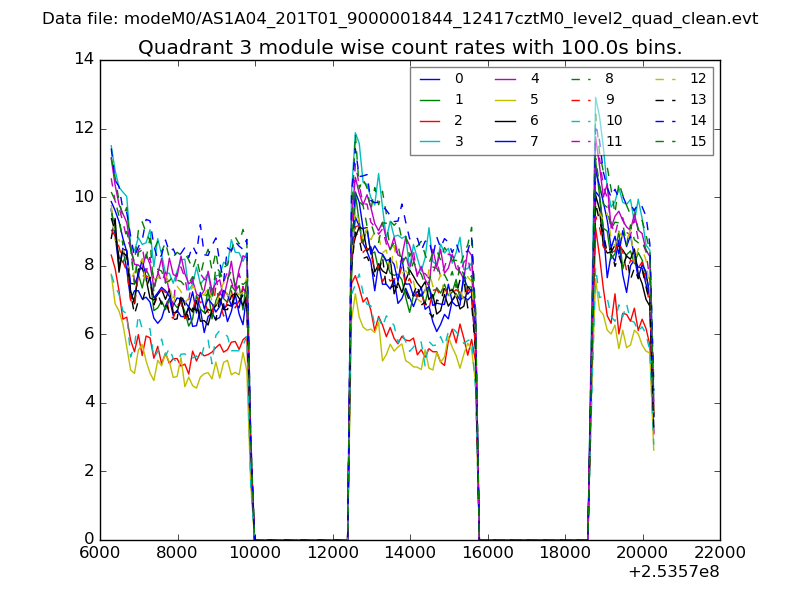
| Module-wise count rates for Quadrant A Data is divided into 100 sec bins |
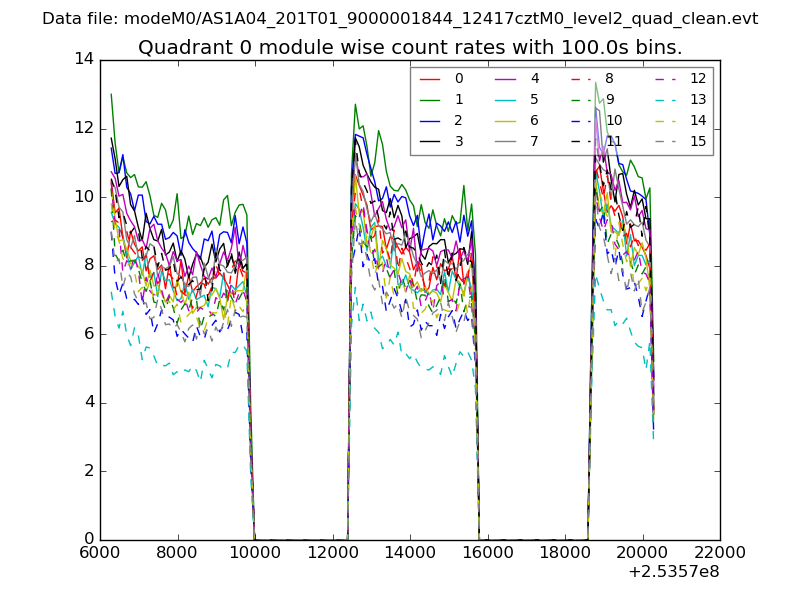 |
 |
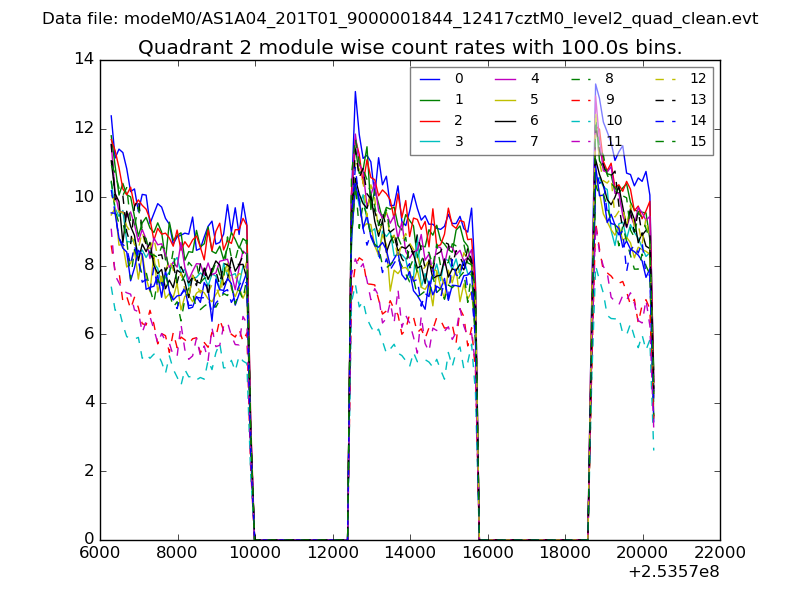
| Module-wise count rates for Quadrant B Data is divided into 100 sec bins |
 |
 |
| Module-wise count rates for Quadrant C Data is divided into 100 sec bins |
 |
 |
| Module-wise count rates for Quadrant D Data is divided into 100 sec bins |
 |
 |
| Parameter | Plot |
|---|---|
| CZT HV Monitor | 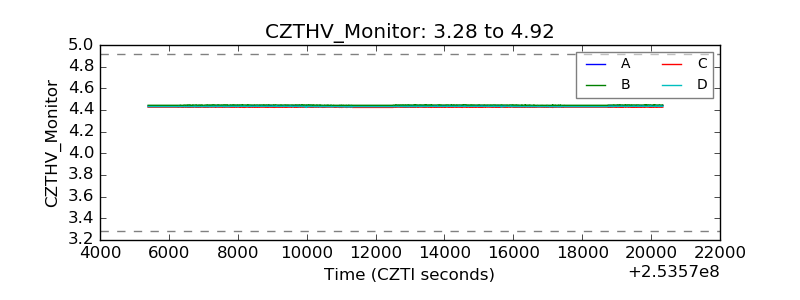 |
| D_VDD |  |
| Temperature 1 | 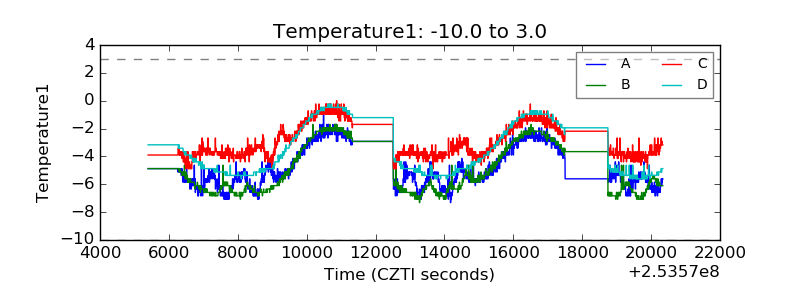 |
| Veto HV Monitor | 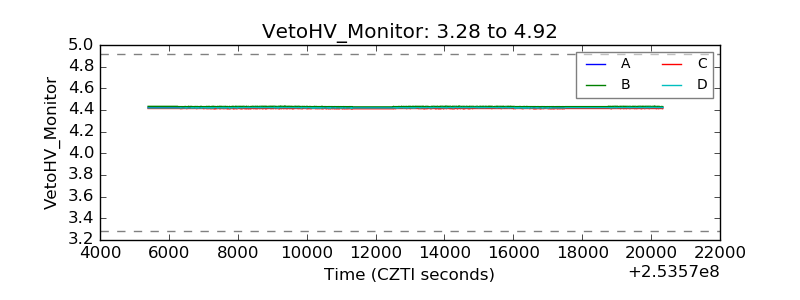 |
| Veto LLD | 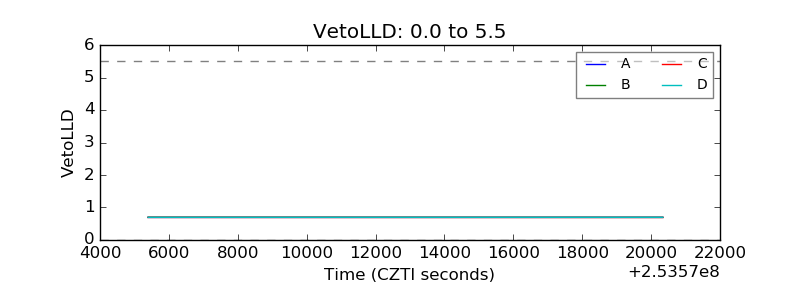 |
| Alpha Counter | 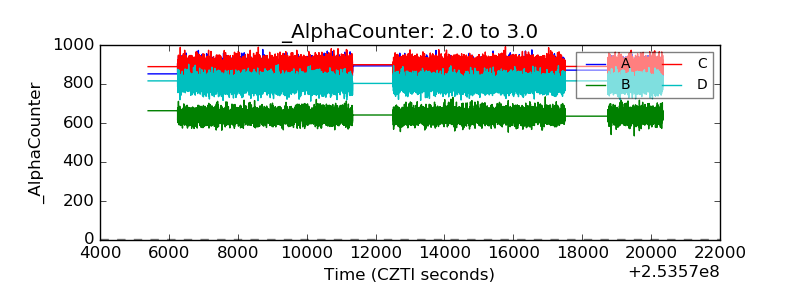 |
| _CPM_Rate | 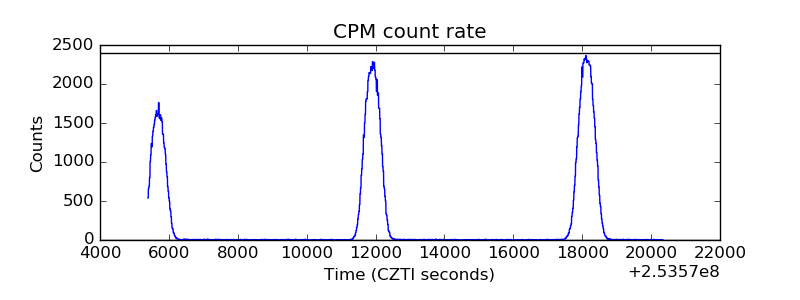 |
| CZT Counter | 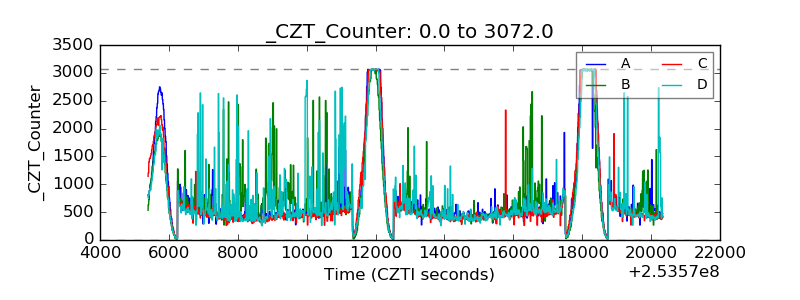 |
| +2.5 Volts monitor |  |
| +5 Volts monitor |  |
| _ROLL_ROT | 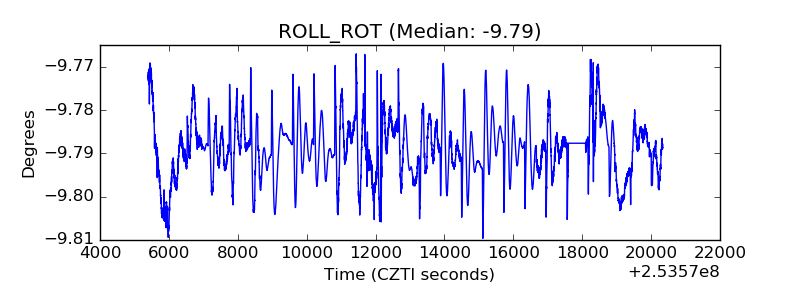 |
| _Roll_DEC | 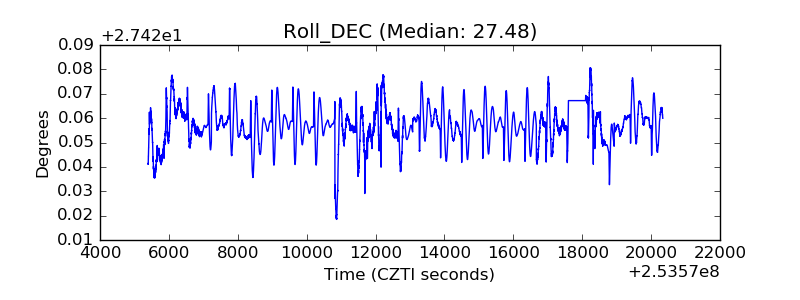 |
| _Roll_RA | 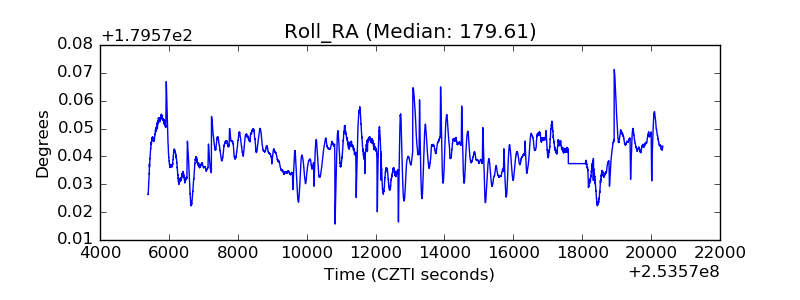 |
| Veto Counter | 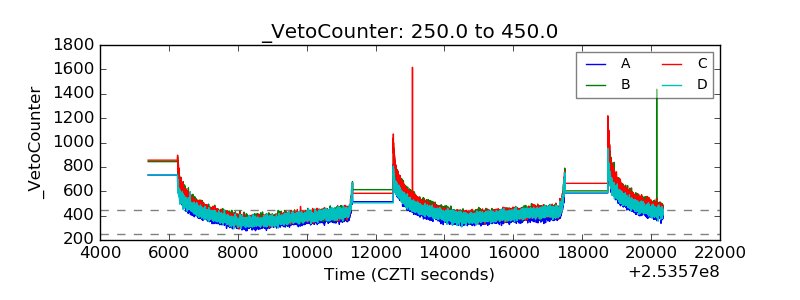 |