| Param | Original file | Final file |
|---|---|---|
| Filename | modeM0/AS1A04_201T01_9000001844_12418cztM0_level2.evt | modeM0/AS1A04_201T01_9000001844_12418cztM0_level2_quad_clean.evt |
| Size (bytes) | 508,351,680 | 96,972,480 |
| Size | 484.8 MB | 92.5 MB |
| Events in quadrant A | 3,721,803 | 623,530 |
| Events in quadrant B | 4,406,210 | 645,339 |
| Events in quadrant C | 3,085,568 | 628,652 |
| Events in quadrant D | 3,741,908 | 586,976 |
| Mode M9 | |||
|---|---|---|---|
| Quadrant | BADHDUFLAG | Total packets | Discarded packets |
| A | 0 | 24 | 0 |
| B | 0 | 24 | 0 |
| C | 0 | 24 | 0 |
| D | 0 | 24 | 0 |
| Mode SS | |||
|---|---|---|---|
| Quadrant | BADHDUFLAG | Total packets | Discarded packets |
| A | 0 | 132 | 0 |
| B | 0 | 132 | 0 |
| C | 0 | 132 | 0 |
| D | 0 | 132 | 0 |
| Mode M0 | |||
|---|---|---|---|
| Quadrant | BADHDUFLAG | Total packets | Discarded packets |
| A | 0 | 15192 | 3 |
| B | 0 | 17254 | 2 |
| C | 0 | 13452 | 2 |
| D | 0 | 15500 | 2 |
| Quadrant | Total seconds | Saturated seconds | Saturation percentage |
|---|---|---|---|
| A | 6484 | 33 | 0.508945% |
| B | 6484 | 450 | 6.940160% |
| C | 6484 | 15 | 0.231339% |
| D | 6484 | 109 | 1.681061% |
Noise dominated data is calculated using 1-second bins in cleaned event files. If a bin has >2000 counts, and if more than 50% of those come from <1% of pixels, then it is considered to be noise-dominated and hence unusable.
| Quadrant | # 1 sec bins | Bins with >0 counts | Bins with >2000 counts | High rate bins dominated by noise | Noise dominated (total time) | Noise dominated (detector-on time) | Marked lightcurve |
|---|---|---|---|---|---|---|---|
| A | 7825 | 6486 | 0 | 0 | 0.00% | 0.00% | 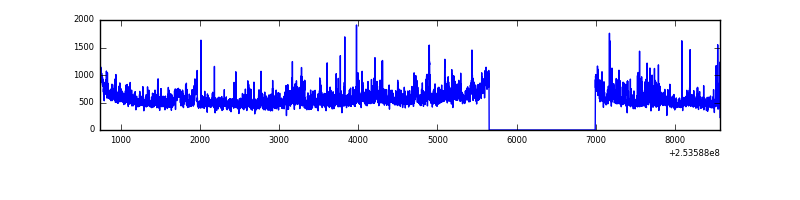 |
| B | 7825 | 6485 | 327 | 327 | 4.18% | 5.04% | 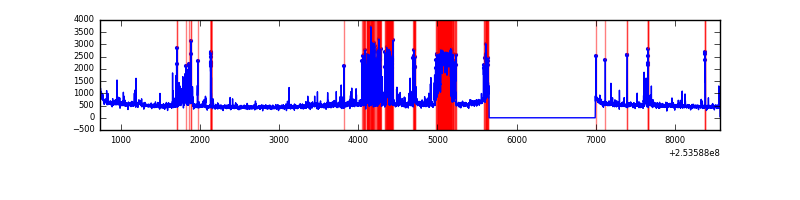 |
| C | 7825 | 6486 | 1 | 1 | 0.01% | 0.02% | 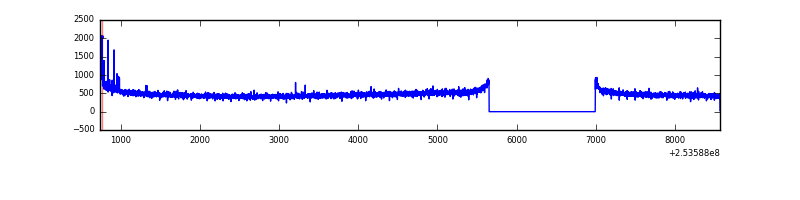 |
| D | 7825 | 6486 | 94 | 94 | 1.20% | 1.45% | 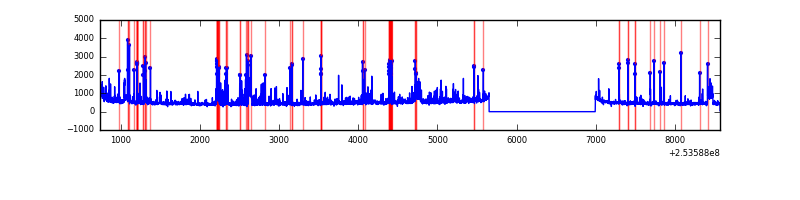 |
Top three noisy pixels from each quadrant. If the there are fewer than three noisy pixels in the level2.evt file, extra rows are filled as -1
| Pixel properties | Quadrant properties | ||||||
|---|---|---|---|---|---|---|---|
| Quadrant | DetID | PixID | Counts | Sigma | Mean | Median | Sigma |
| A | 12 | 189 | 185443 | 1132.09 | 808 | 793 | 163.1 |
| A | 1 | 162 | 123684 | 753.44 | 808 | 793 | 163.1 |
| A | 13 | 251 | 109971 | 669.37 | 808 | 793 | 163.1 |
| B | 4 | 239 | 1159041 | 7917.2 | 784 | 765 | 146.3 |
| B | 3 | 64 | 75164 | 508.54 | 784 | 765 | 146.3 |
| B | 0 | 187 | 59605 | 402.19 | 784 | 765 | 146.3 |
| C | 15 | 208 | 25623 | 137.71 | 784 | 790 | 180.3 |
| C | 13 | 61 | 5877 | 28.21 | 784 | 790 | 180.3 |
| C | 1 | 16 | 1925 | 6.29 | 784 | 790 | 180.3 |
| D | 1 | 52 | 566598 | 3060.66 | 769 | 749 | 184.9 |
| D | 2 | 14 | 113017 | 607.25 | 769 | 749 | 184.9 |
| D | 8 | 195 | 83726 | 448.82 | 769 | 749 | 184.9 |
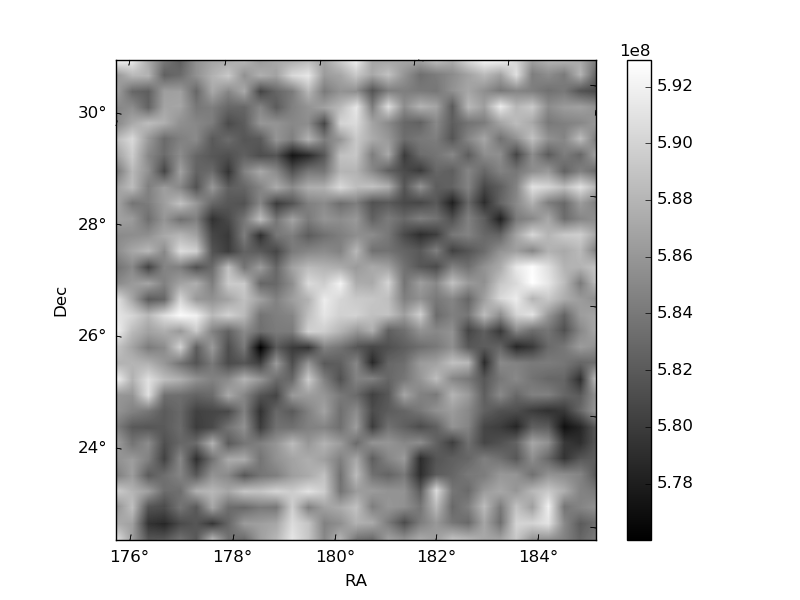
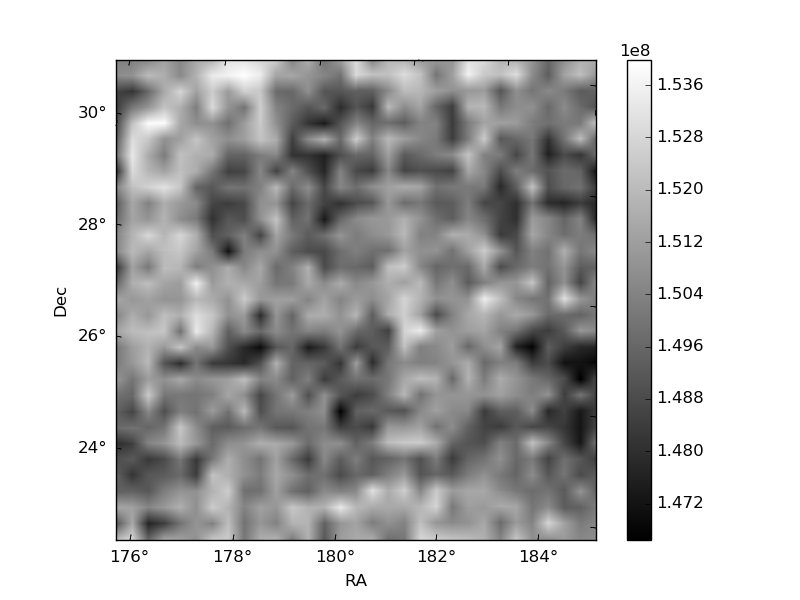
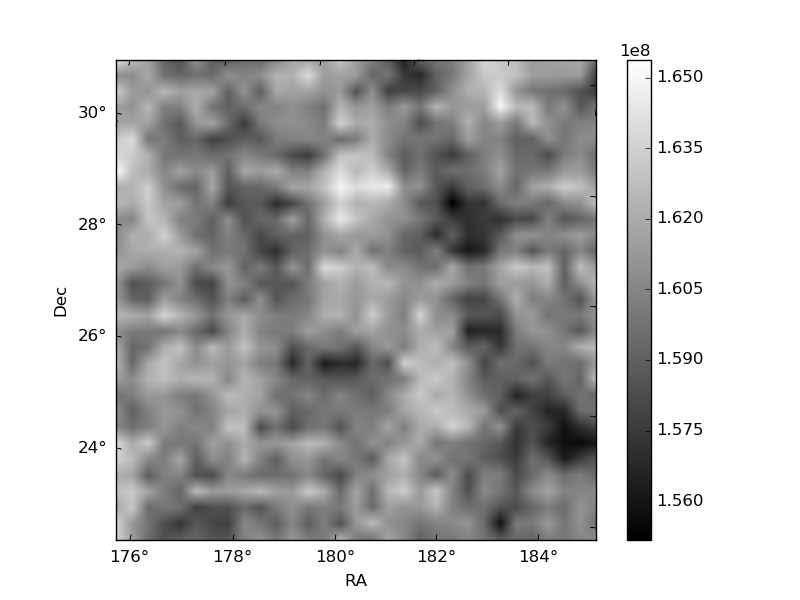
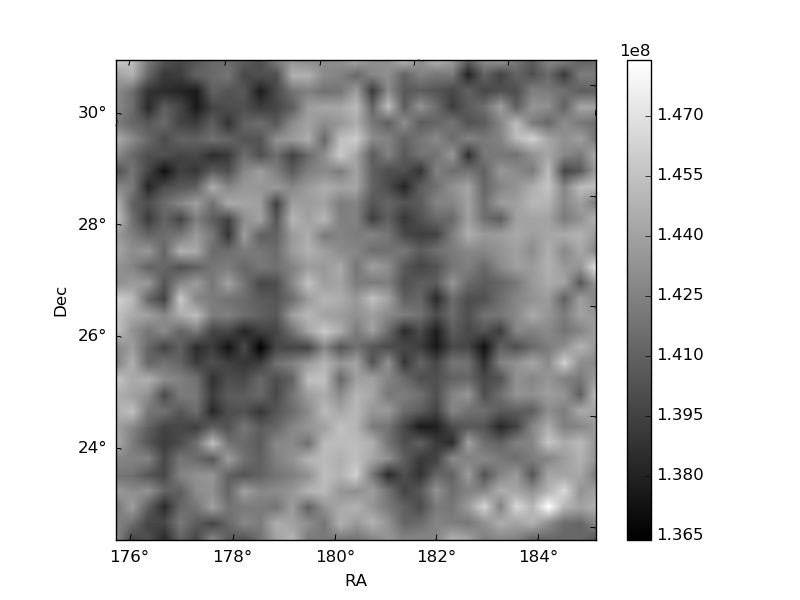
Histogram calculated using DETX and DETY for each event in the final _common_clean file
| Quadrant A | 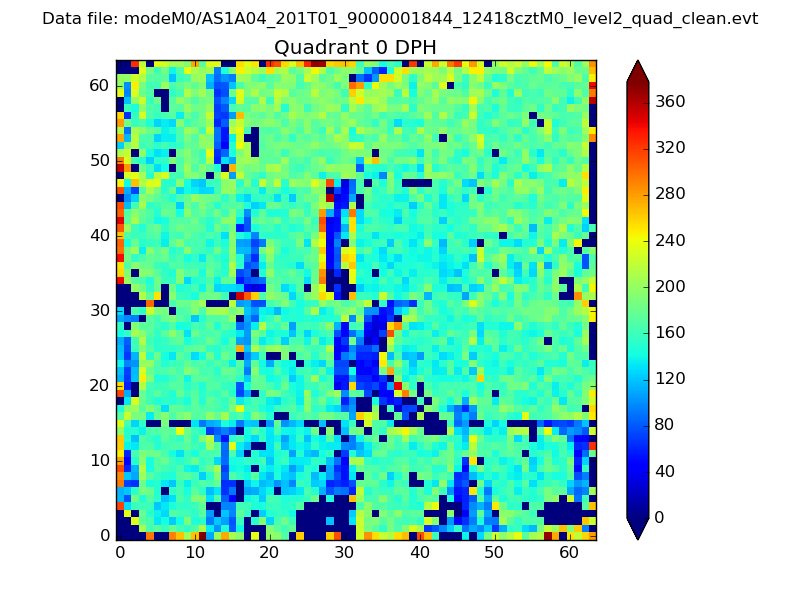 |
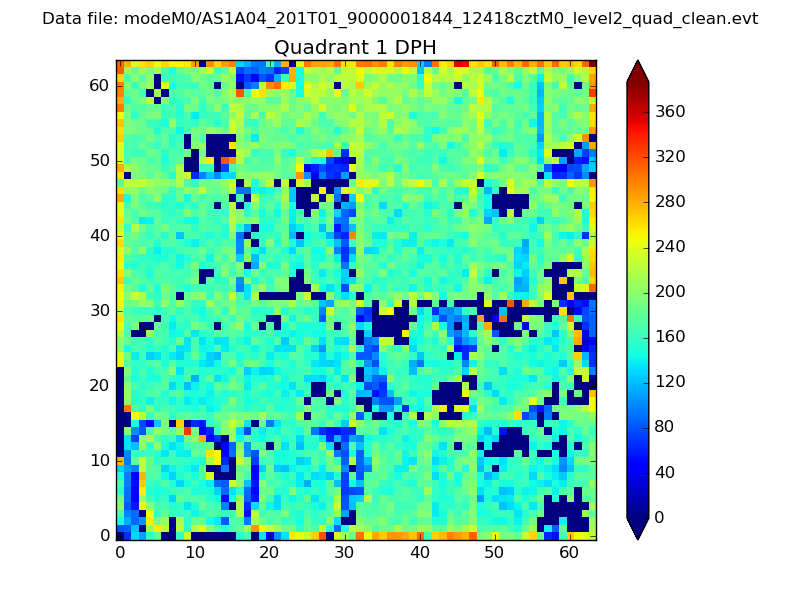 |
Quadrant B |
|---|---|---|---|
| Quadrant D | 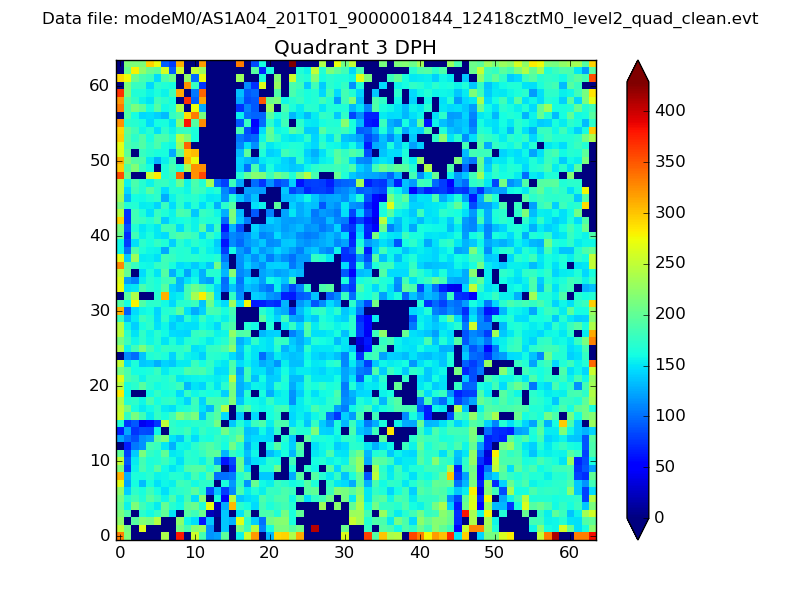 |
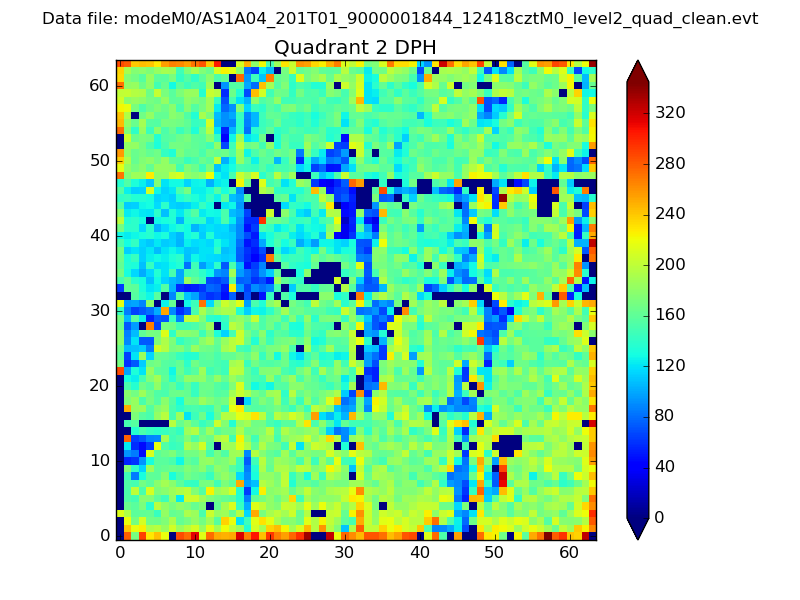 |
Quadrant C |
| Plot type | Count rate plots | Images |
|---|---|---|
| Comparison with Poisson distribution Blue bars denote a histogram of data divided into 1 sec bins. Red curve is a Poisson curve with rate = median count rate of data. |
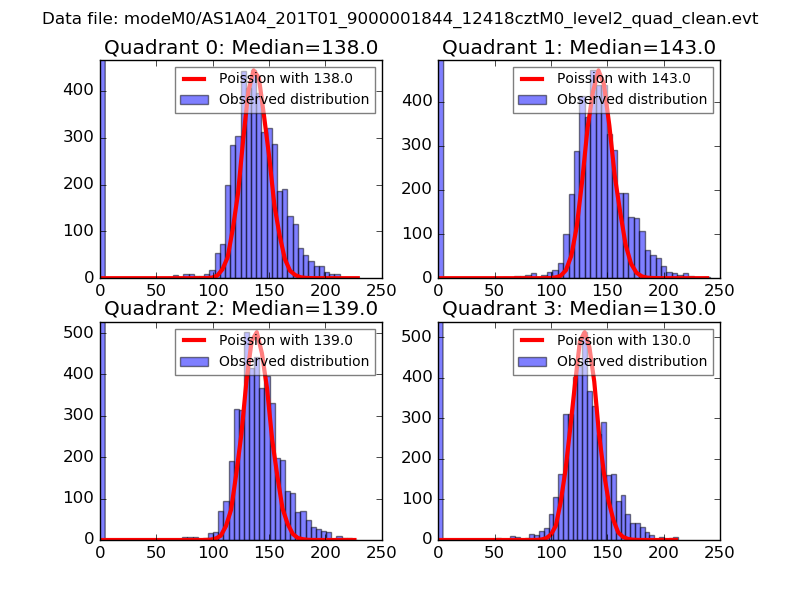 |
 |
| Quadrant-wise count rates Data is divided into 100 sec bins |
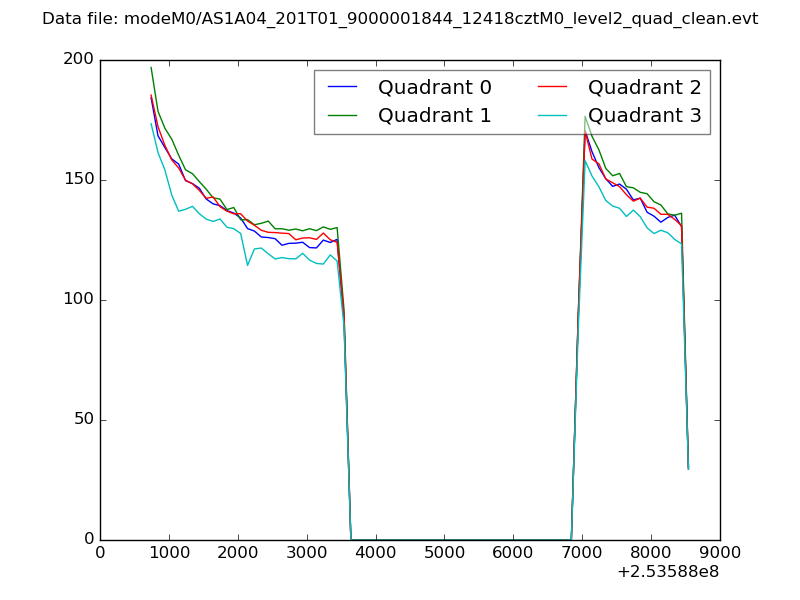 |
|
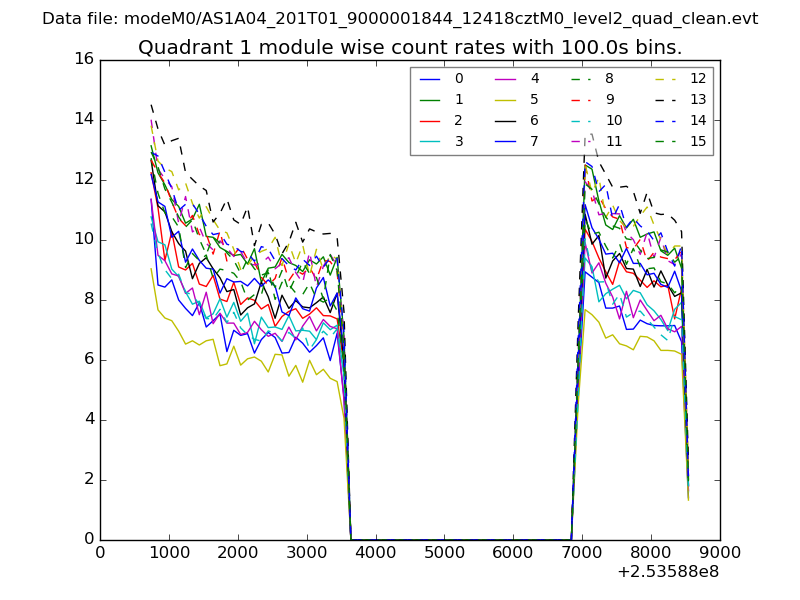
| Module-wise count rates for Quadrant A Data is divided into 100 sec bins |
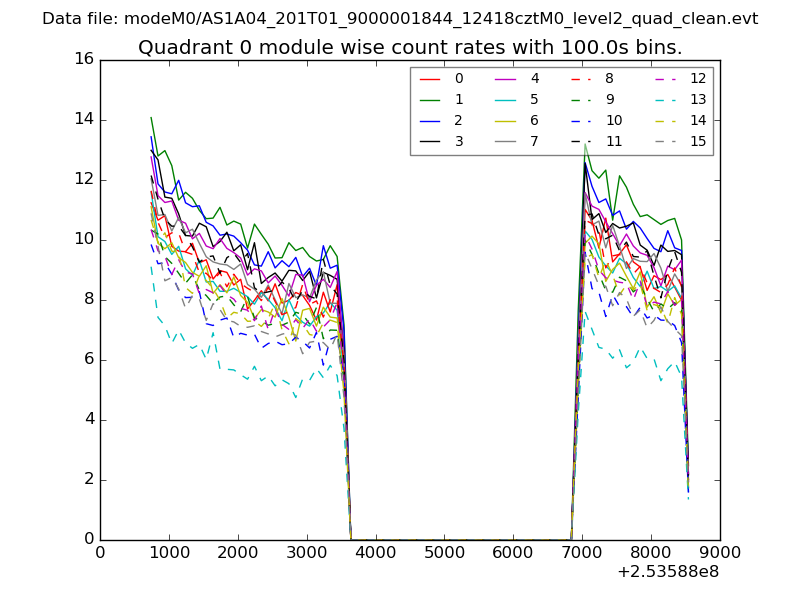 |
 |
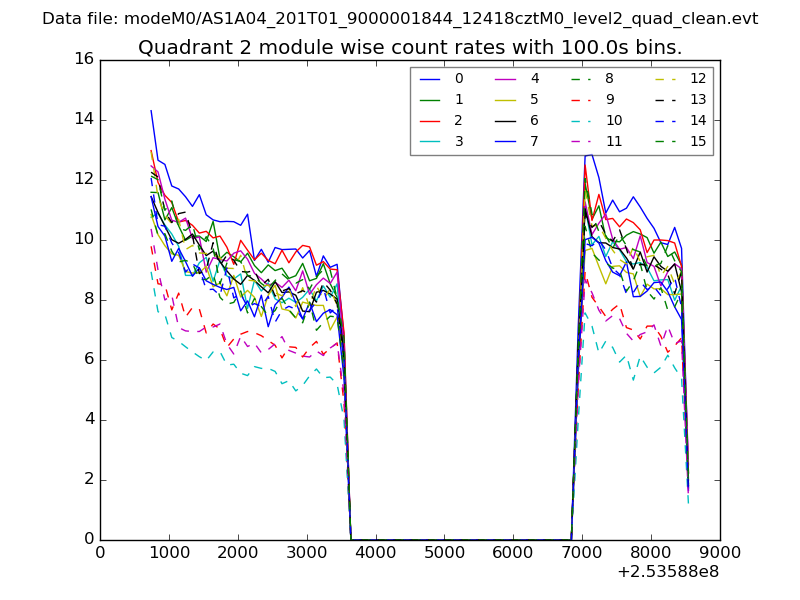
| Module-wise count rates for Quadrant B Data is divided into 100 sec bins |
 |
 |
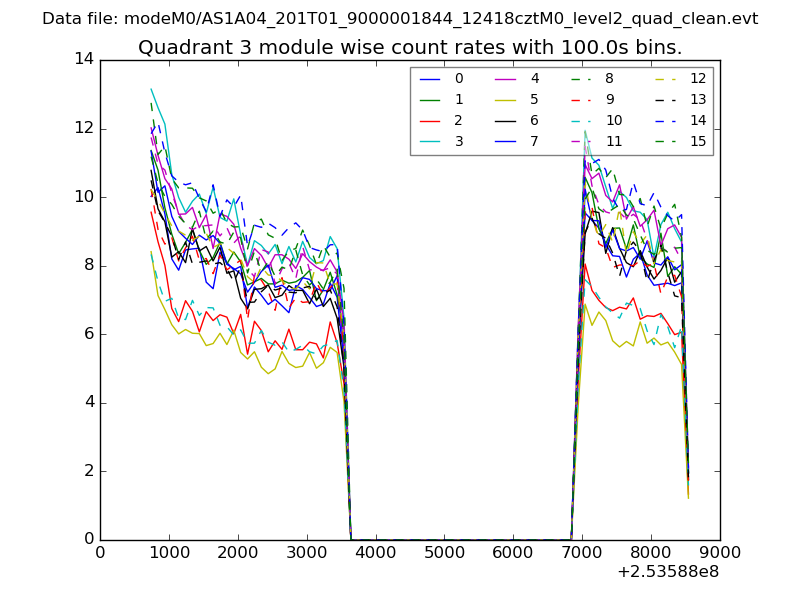
| Module-wise count rates for Quadrant C Data is divided into 100 sec bins |
 |
 |
| Module-wise count rates for Quadrant D Data is divided into 100 sec bins |
 |
 |
| Parameter | Plot |
|---|---|
| CZT HV Monitor | 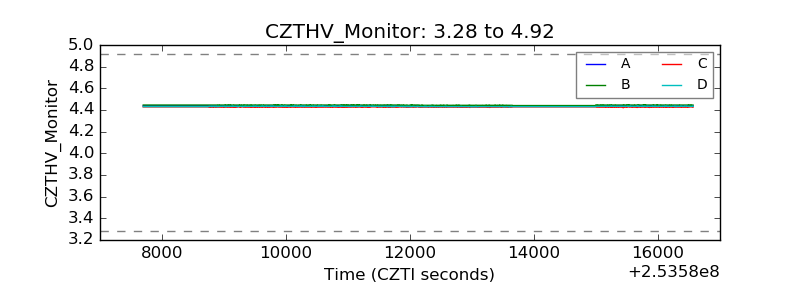 |
| D_VDD | 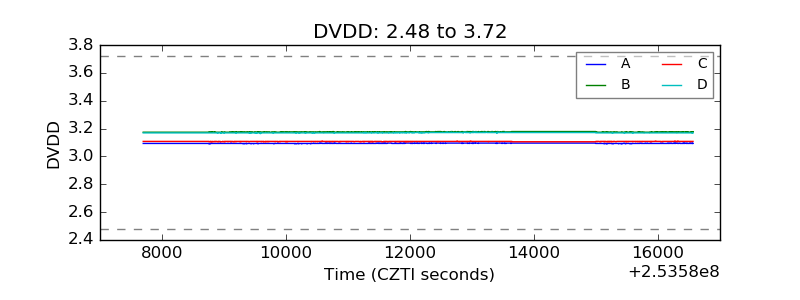 |
| Temperature 1 | 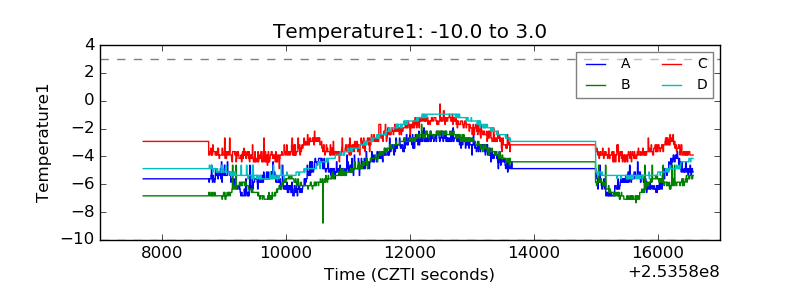 |
| Veto HV Monitor | 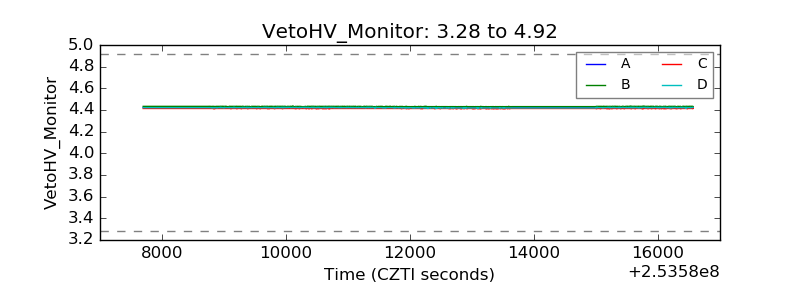 |
| Veto LLD | 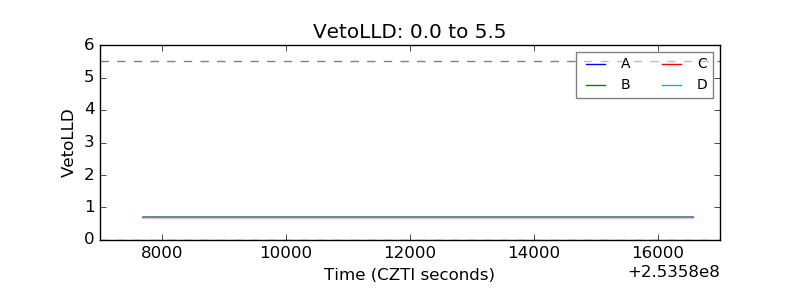 |
| Alpha Counter | 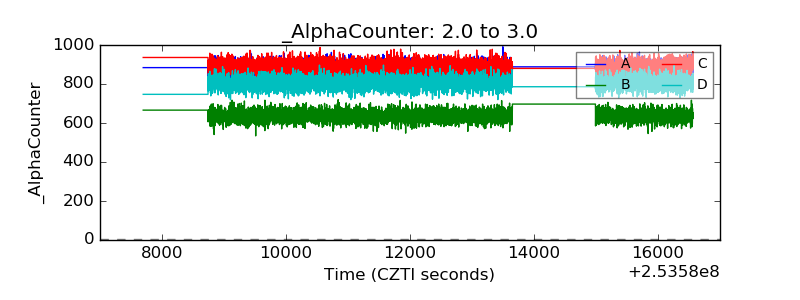 |
| _CPM_Rate | 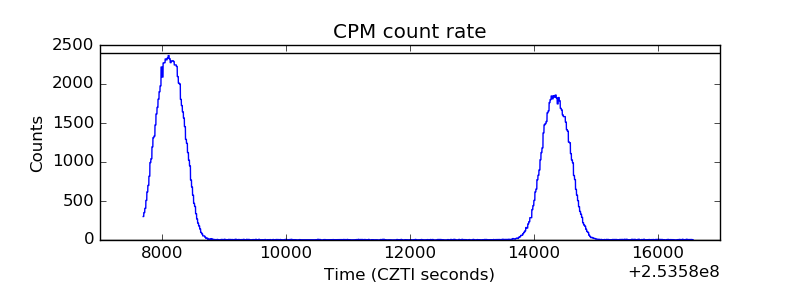 |
| CZT Counter | 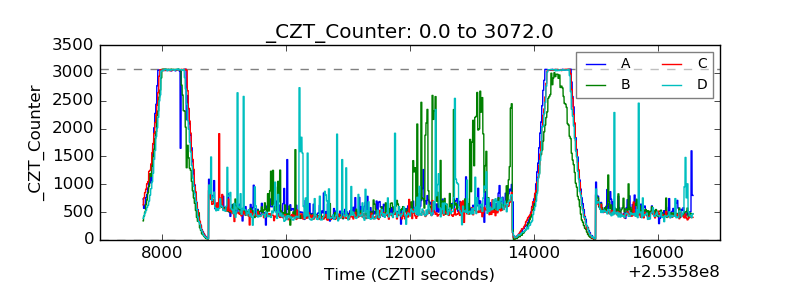 |
| +2.5 Volts monitor |  |
| +5 Volts monitor |  |
| _ROLL_ROT | 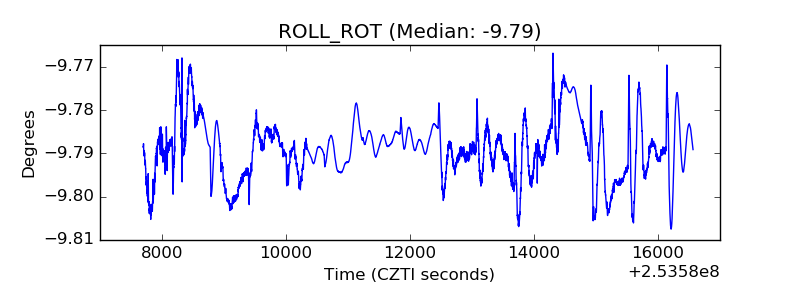 |
| _Roll_DEC | 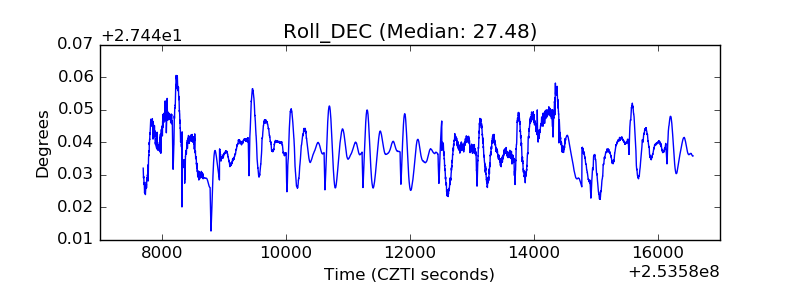 |
| _Roll_RA | 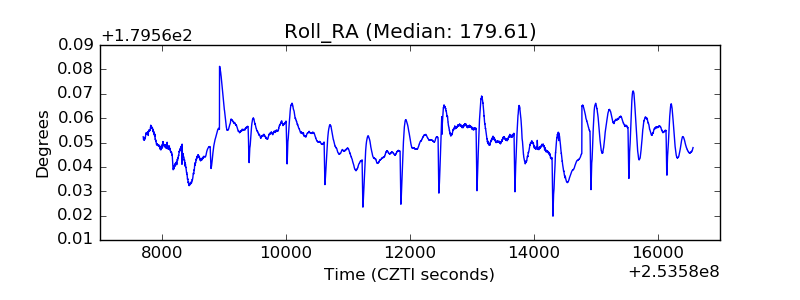 |
| Veto Counter | 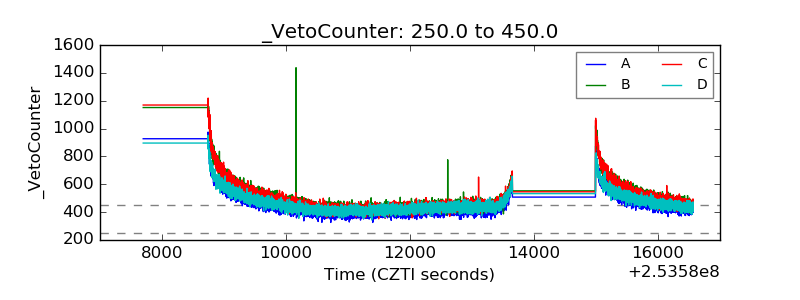 |