| Param | Original file | Final file |
|---|---|---|
| Filename | modeM0/AS1A04_201T01_9000001844_12420cztM0_level2.evt | modeM0/AS1A04_201T01_9000001844_12420cztM0_level2_quad_clean.evt |
| Size (bytes) | 499,783,680 | 91,673,280 |
| Size | 476.6 MB | 87.4 MB |
| Events in quadrant A | 4,178,194 | 581,180 |
| Events in quadrant B | 3,735,984 | 591,425 |
| Events in quadrant C | 3,114,300 | 589,015 |
| Events in quadrant D | 3,661,349 | 556,020 |
| Mode M9 | |||
|---|---|---|---|
| Quadrant | BADHDUFLAG | Total packets | Discarded packets |
| A | 0 | 15 | 0 |
| B | 0 | 15 | 0 |
| C | 0 | 15 | 0 |
| D | 0 | 16 | 0 |
| Mode SS | |||
|---|---|---|---|
| Quadrant | BADHDUFLAG | Total packets | Discarded packets |
| A | 0 | 134 | 0 |
| B | 0 | 134 | 0 |
| C | 0 | 134 | 0 |
| D | 0 | 134 | 0 |
| Mode M0 | |||
|---|---|---|---|
| Quadrant | BADHDUFLAG | Total packets | Discarded packets |
| A | 0 | 16675 | 3 |
| B | 0 | 15159 | 2 |
| C | 0 | 13667 | 2 |
| D | 0 | 15220 | 2 |
| Quadrant | Total seconds | Saturated seconds | Saturation percentage |
|---|---|---|---|
| A | 6571 | 182 | 2.769746% |
| B | 6571 | 192 | 2.921930% |
| C | 6571 | 49 | 0.745701% |
| D | 6571 | 144 | 2.191447% |
Noise dominated data is calculated using 1-second bins in cleaned event files. If a bin has >2000 counts, and if more than 50% of those come from <1% of pixels, then it is considered to be noise-dominated and hence unusable.
| Quadrant | # 1 sec bins | Bins with >0 counts | Bins with >2000 counts | High rate bins dominated by noise | Noise dominated (total time) | Noise dominated (detector-on time) | Marked lightcurve |
|---|---|---|---|---|---|---|---|
| A | 7702 | 6572 | 77 | 77 | 1.00% | 1.17% | 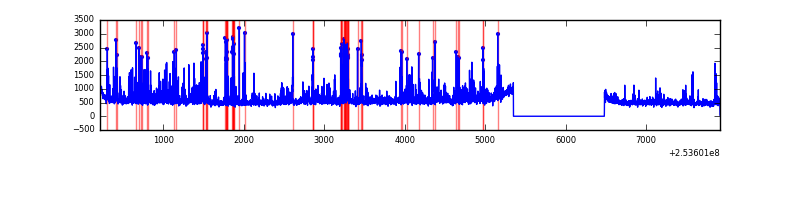 |
| B | 7701 | 6571 | 79 | 79 | 1.03% | 1.20% | 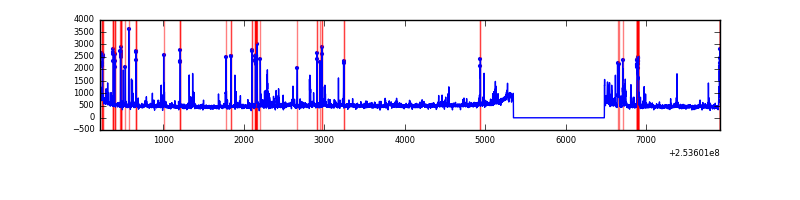 |
| C | 7702 | 6572 | 2 | 2 | 0.03% | 0.03% |  |
| D | 7702 | 6572 | 93 | 93 | 1.21% | 1.42% | 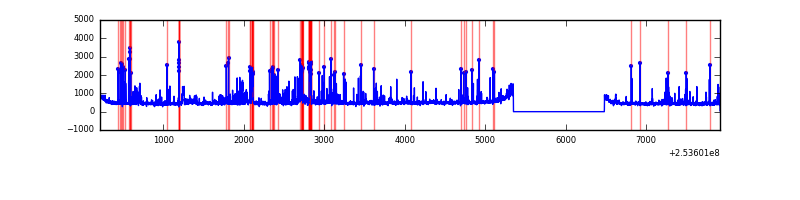 |
Top three noisy pixels from each quadrant. If the there are fewer than three noisy pixels in the level2.evt file, extra rows are filled as -1
| Pixel properties | Quadrant properties | ||||||
|---|---|---|---|---|---|---|---|
| Quadrant | DetID | PixID | Counts | Sigma | Mean | Median | Sigma |
| A | 13 | 251 | 738369 | 4420.13 | 813 | 796 | 166.9 |
| A | 12 | 189 | 107299 | 638.25 | 813 | 796 | 166.9 |
| A | 7 | 16 | 59688 | 352.93 | 813 | 796 | 166.9 |
| B | 4 | 239 | 321612 | 2095.44 | 807 | 787 | 153.1 |
| B | 3 | 64 | 149138 | 968.94 | 807 | 787 | 153.1 |
| B | 11 | 51 | 35557 | 227.1 | 807 | 787 | 153.1 |
| C | 15 | 208 | 42865 | 230.63 | 787 | 789 | 182.4 |
| C | 13 | 61 | 5900 | 28.01 | 787 | 789 | 182.4 |
| C | 5 | 252 | 2447 | 9.09 | 787 | 789 | 182.4 |
| D | 1 | 52 | 296914 | 1589.77 | 782 | 762 | 186.3 |
| D | 2 | 14 | 202094 | 1080.76 | 782 | 762 | 186.3 |
| D | 8 | 195 | 133825 | 714.29 | 782 | 762 | 186.3 |
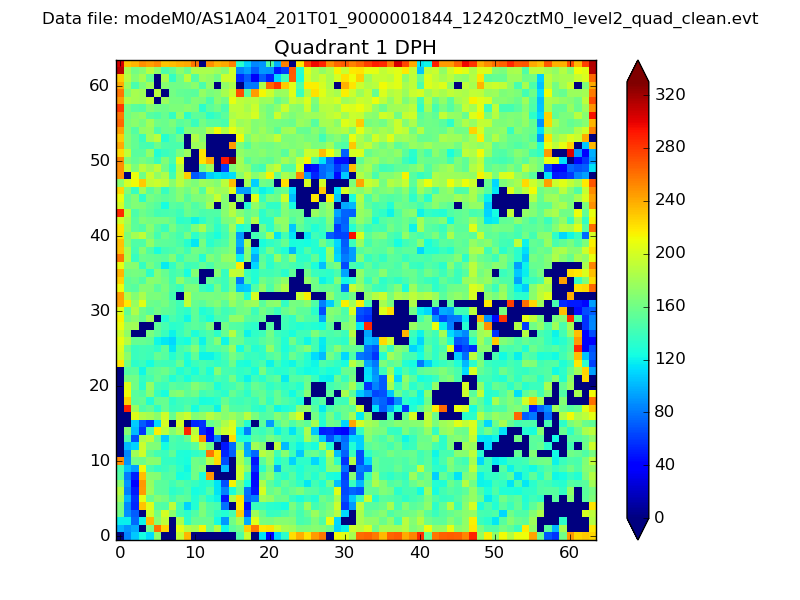
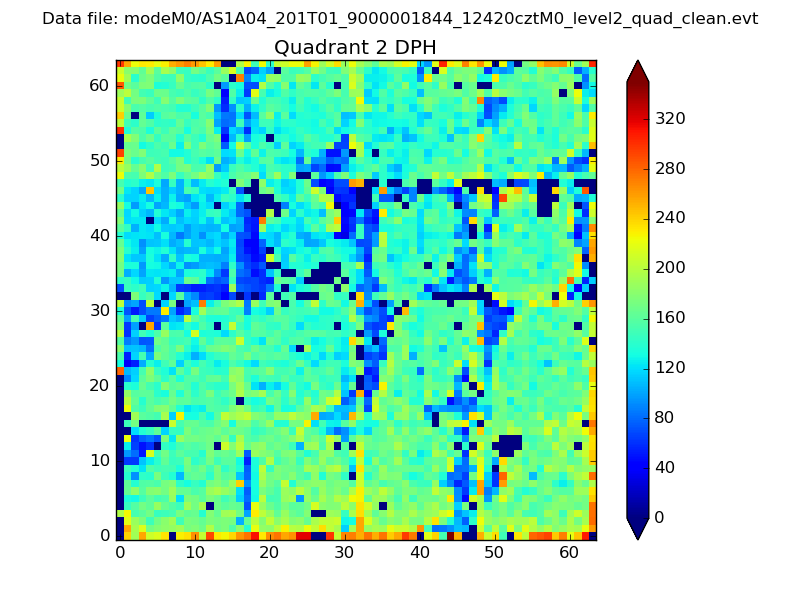
Histogram calculated using DETX and DETY for each event in the final _common_clean file
| Quadrant A | 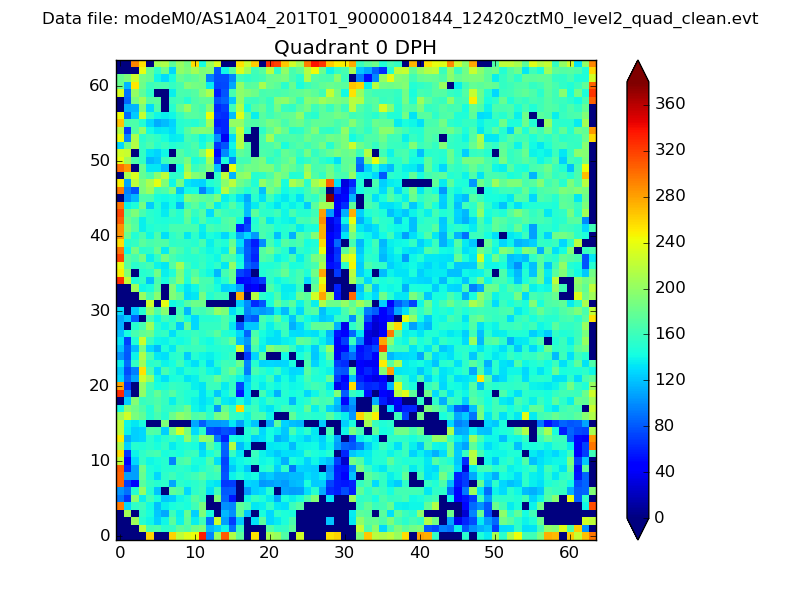 |
 |
Quadrant B |
|---|---|---|---|
| Quadrant D | 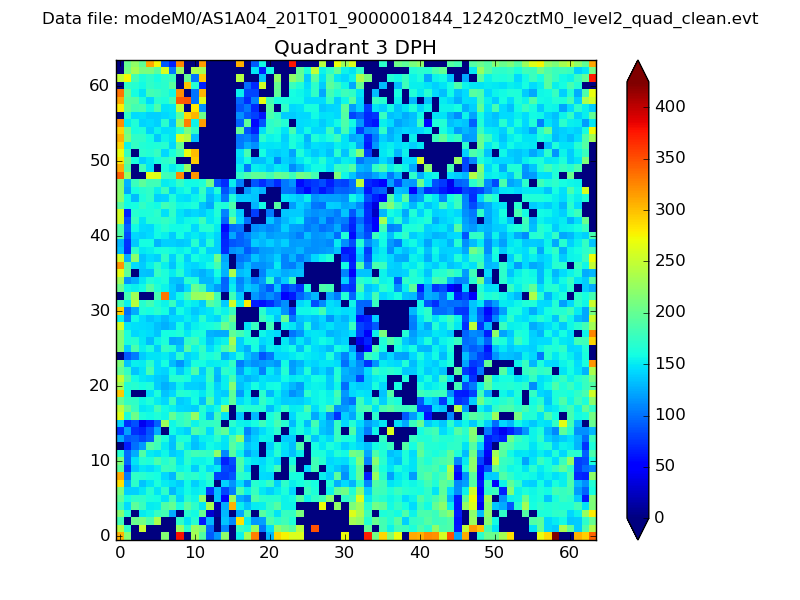 |
 |
Quadrant C |
| Plot type | Count rate plots | Images |
|---|---|---|
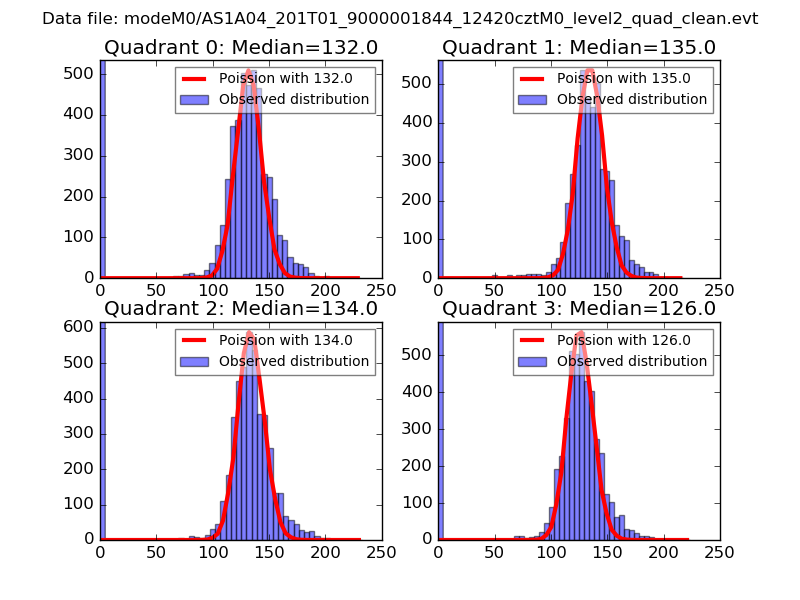
| Comparison with Poisson distribution Blue bars denote a histogram of data divided into 1 sec bins. Red curve is a Poisson curve with rate = median count rate of data. |
 |
 |
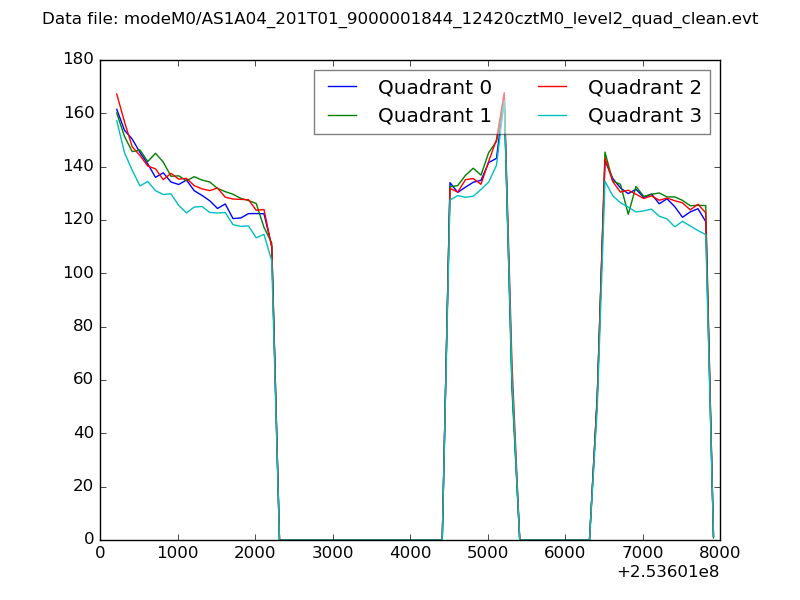
| Quadrant-wise count rates Data is divided into 100 sec bins |
 |
|
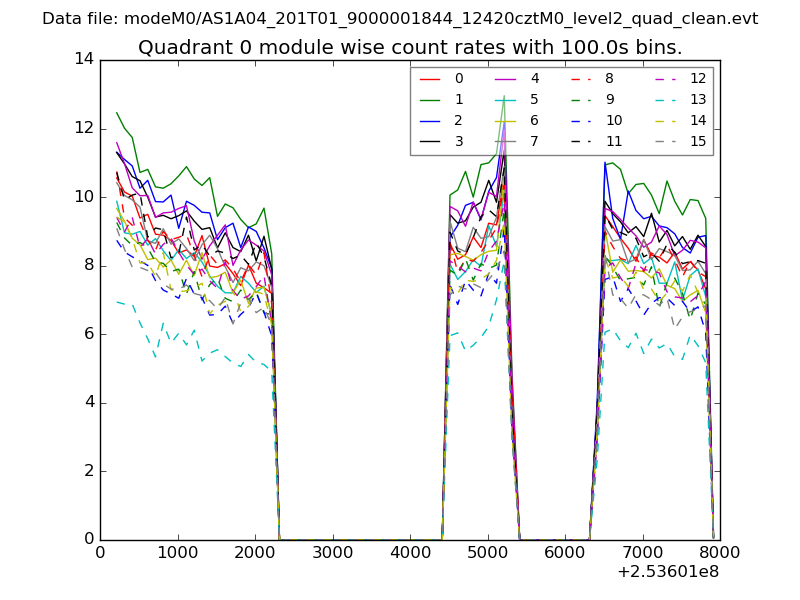
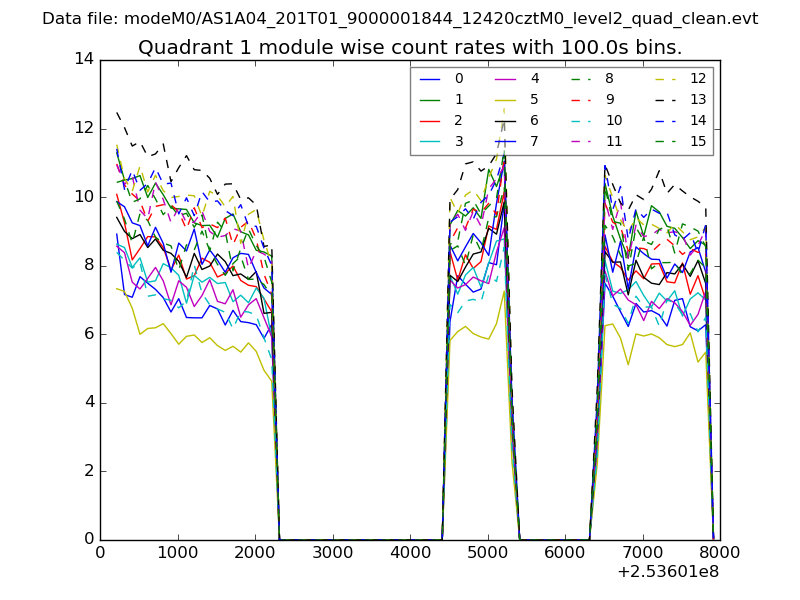
| Module-wise count rates for Quadrant A Data is divided into 100 sec bins |
 |
 |
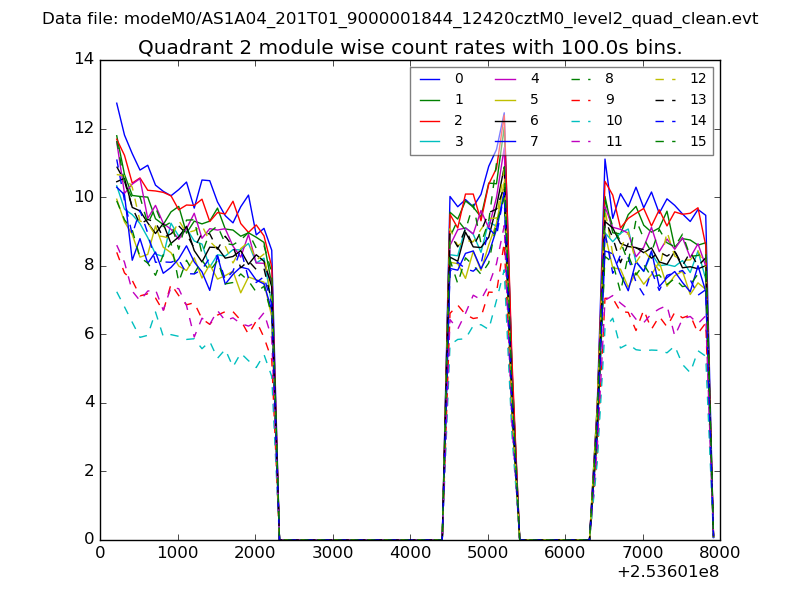
| Module-wise count rates for Quadrant B Data is divided into 100 sec bins |
 |
 |
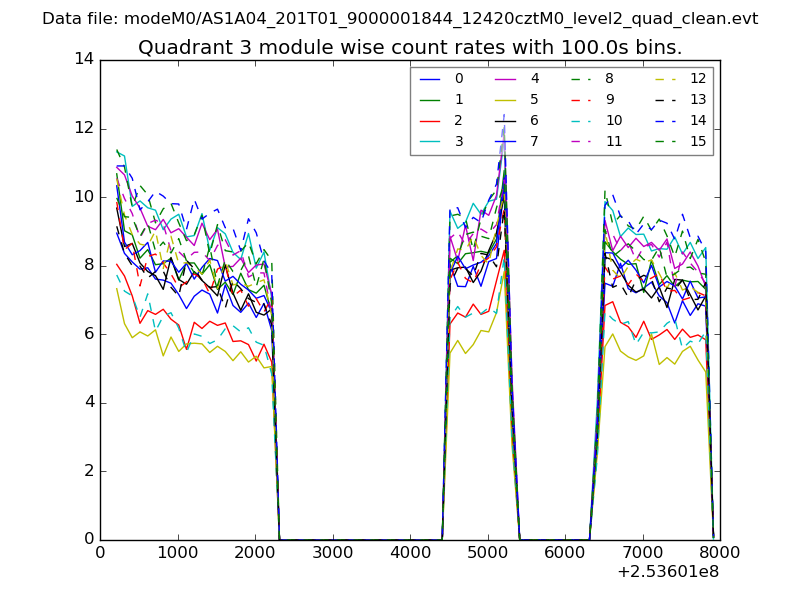
| Module-wise count rates for Quadrant C Data is divided into 100 sec bins |
 |
 |
| Module-wise count rates for Quadrant D Data is divided into 100 sec bins |
 |
 |
| Parameter | Plot |
|---|---|
| CZT HV Monitor | 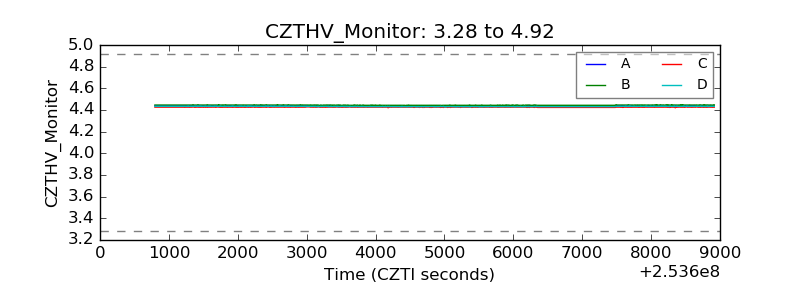 |
| D_VDD | 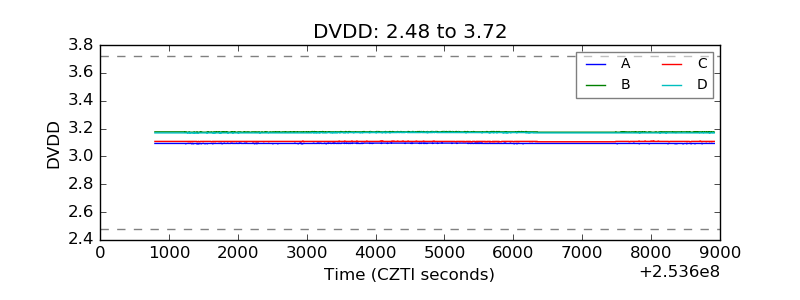 |
| Temperature 1 | 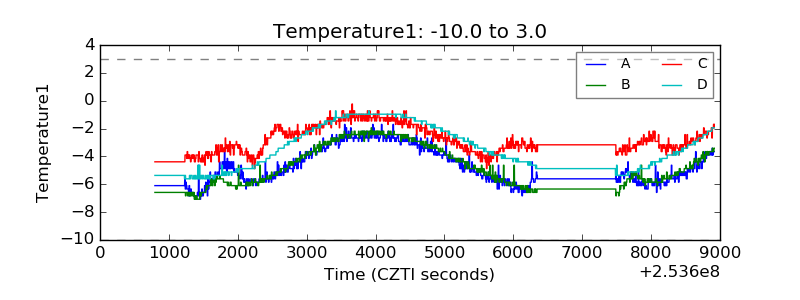 |
| Veto HV Monitor | 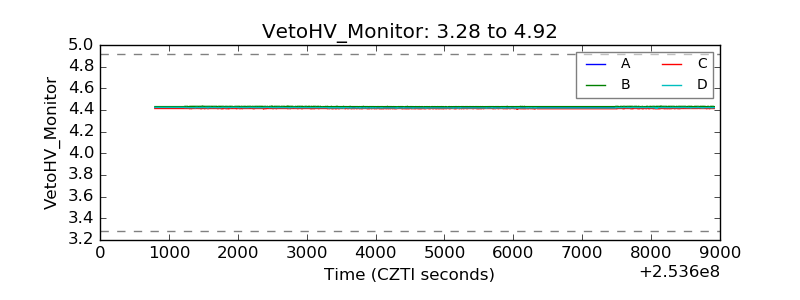 |
| Veto LLD | 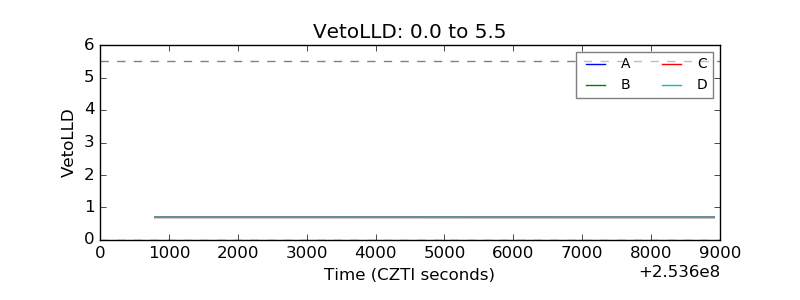 |
| Alpha Counter | 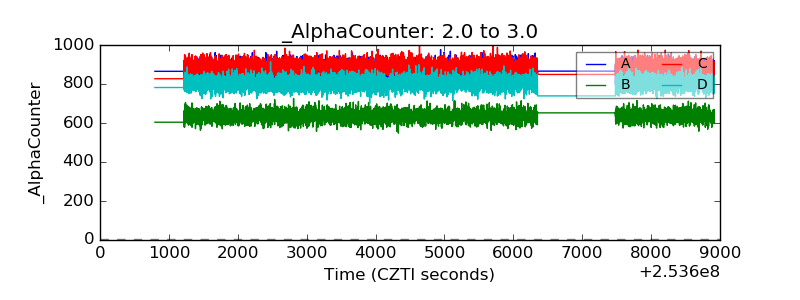 |
| _CPM_Rate | 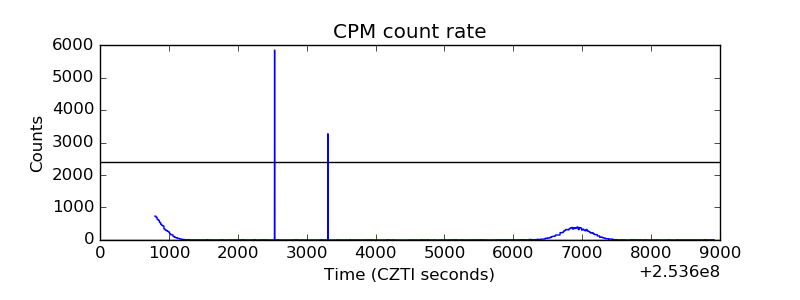 |
| CZT Counter | 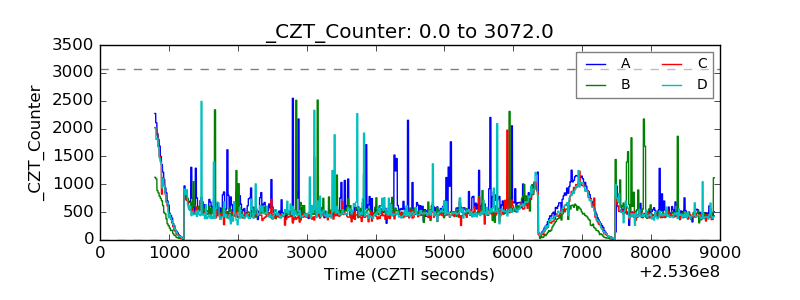 |
| +2.5 Volts monitor |  |
| +5 Volts monitor |  |
| _ROLL_ROT | 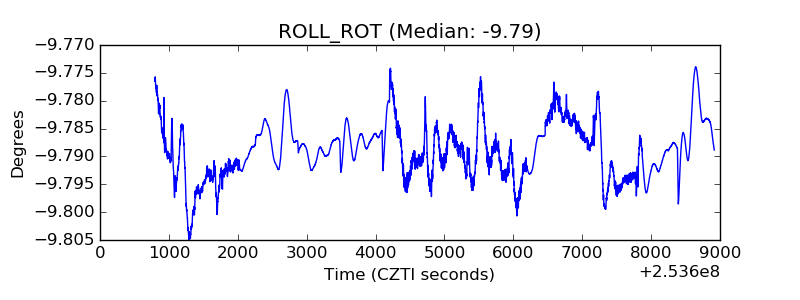 |
| _Roll_DEC | 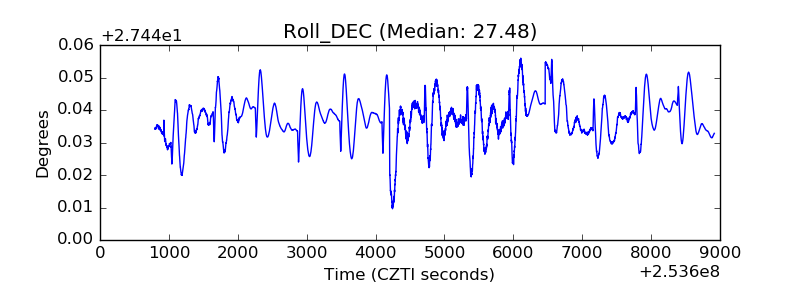 |
| _Roll_RA | 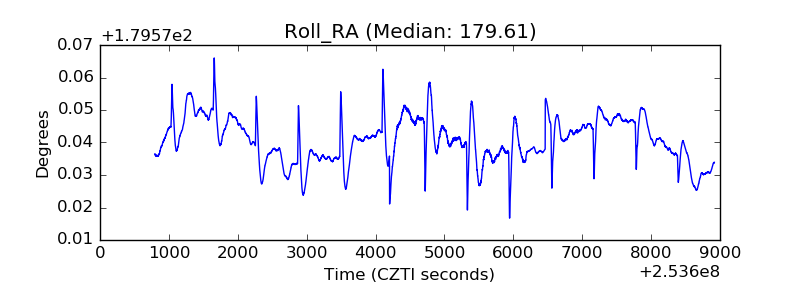 |
| Veto Counter | 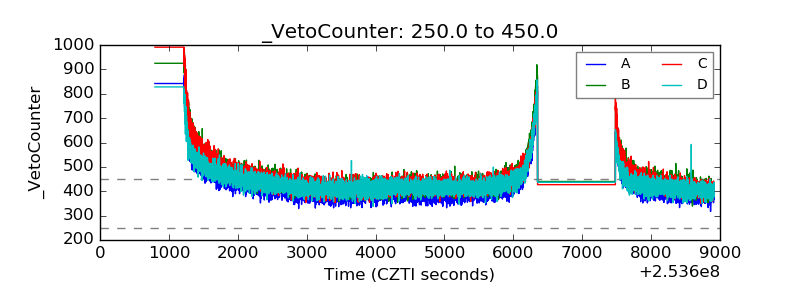 |