| Param | Original file | Final file |
|---|---|---|
| Filename | modeM0/AS1A04_201T01_9000001844_12421cztM0_level2.evt | modeM0/AS1A04_201T01_9000001844_12421cztM0_level2_quad_clean.evt |
| Size (bytes) | 359,985,600 | 54,060,480 |
| Size | 343.3 MB | 51.6 MB |
| Events in quadrant A | 2,693,677 | 327,628 |
| Events in quadrant B | 2,850,342 | 331,208 |
| Events in quadrant C | 2,242,143 | 328,942 |
| Events in quadrant D | 2,790,242 | 313,120 |
| Mode M9 | |||
|---|---|---|---|
| Quadrant | BADHDUFLAG | Total packets | Discarded packets |
| A | 0 | 1 | 0 |
| B | 0 | 1 | 0 |
| C | 0 | 1 | 0 |
| D | 0 | 2 | 0 |
| Mode SS | |||
|---|---|---|---|
| Quadrant | BADHDUFLAG | Total packets | Discarded packets |
| A | 0 | 96 | 0 |
| B | 0 | 96 | 0 |
| C | 0 | 96 | 0 |
| D | 0 | 96 | 0 |
| Mode M0 | |||
|---|---|---|---|
| Quadrant | BADHDUFLAG | Total packets | Discarded packets |
| A | 0 | 10979 | 1 |
| B | 0 | 11477 | 1 |
| C | 0 | 9902 | 1 |
| D | 0 | 11453 | 1 |
| Quadrant | Total seconds | Saturated seconds | Saturation percentage |
|---|---|---|---|
| A | 4779 | 29 | 0.606822% |
| B | 4779 | 152 | 3.180582% |
| C | 4779 | 13 | 0.272023% |
| D | 4779 | 150 | 3.138732% |
Noise dominated data is calculated using 1-second bins in cleaned event files. If a bin has >2000 counts, and if more than 50% of those come from <1% of pixels, then it is considered to be noise-dominated and hence unusable.
| Quadrant | # 1 sec bins | Bins with >0 counts | Bins with >2000 counts | High rate bins dominated by noise | Noise dominated (total time) | Noise dominated (detector-on time) | Marked lightcurve |
|---|---|---|---|---|---|---|---|
| A | 4780 | 4780 | 13 | 13 | 0.27% | 0.27% | 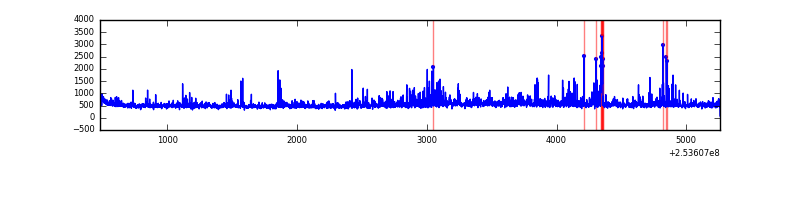 |
| B | 4780 | 4780 | 111 | 111 | 2.32% | 2.32% | 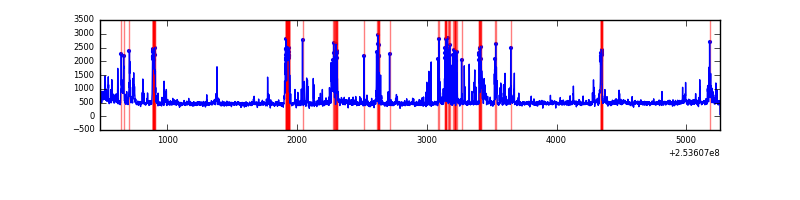 |
| C | 4780 | 4780 | 11 | 11 | 0.23% | 0.23% | 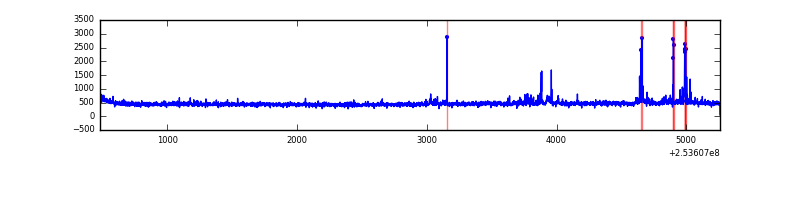 |
| D | 4780 | 4780 | 140 | 140 | 2.93% | 2.93% | 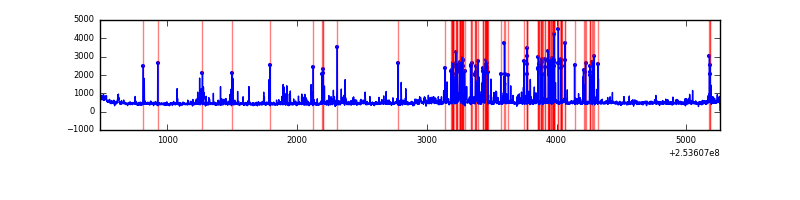 |
Top three noisy pixels from each quadrant. If the there are fewer than three noisy pixels in the level2.evt file, extra rows are filled as -1
| Pixel properties | Quadrant properties | ||||||
|---|---|---|---|---|---|---|---|
| Quadrant | DetID | PixID | Counts | Sigma | Mean | Median | Sigma |
| A | 13 | 251 | 358081 | 3108.03 | 563 | 552 | 115.0 |
| A | 12 | 189 | 44453 | 381.64 | 563 | 552 | 115.0 |
| A | 1 | 162 | 43801 | 375.97 | 563 | 552 | 115.0 |
| B | 4 | 239 | 495359 | 4667.14 | 558 | 545 | 106.0 |
| B | 0 | 190 | 65065 | 608.56 | 558 | 545 | 106.0 |
| B | 3 | 64 | 63077 | 589.81 | 558 | 545 | 106.0 |
| C | 15 | 208 | 104619 | 823.93 | 546 | 550 | 126.3 |
| C | 5 | 252 | 6459 | 46.78 | 546 | 550 | 126.3 |
| C | 13 | 61 | 4081 | 27.96 | 546 | 550 | 126.3 |
| D | 1 | 52 | 609223 | 4660.11 | 539 | 524 | 130.6 |
| D | 8 | 195 | 62245 | 472.53 | 539 | 524 | 130.6 |
| D | 2 | 234 | 17575 | 130.54 | 539 | 524 | 130.6 |
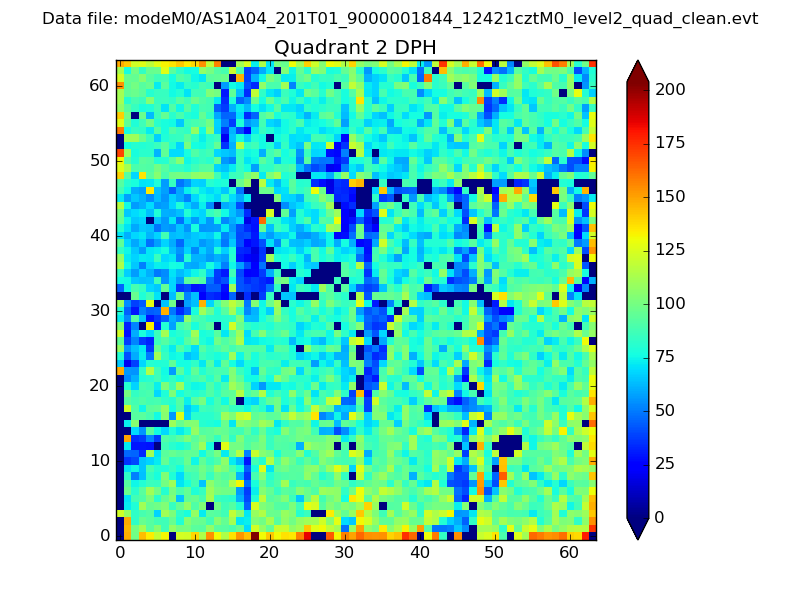
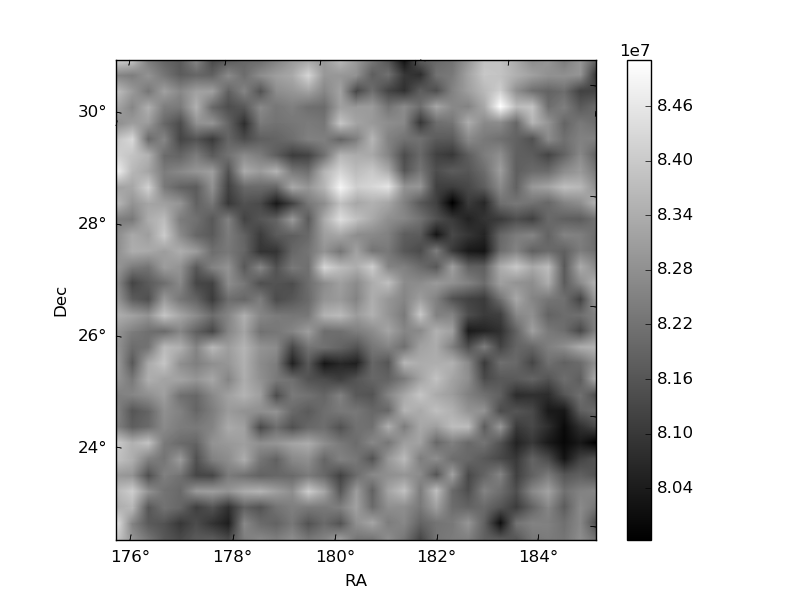
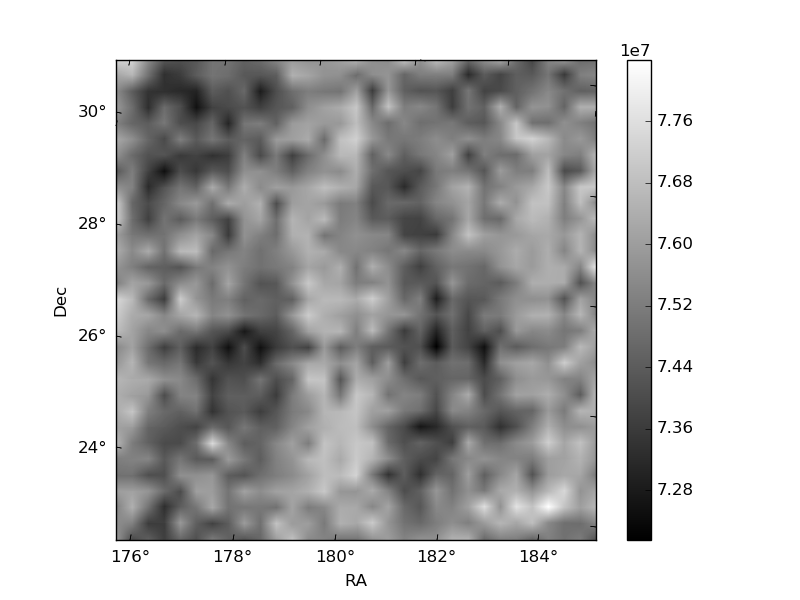
Histogram calculated using DETX and DETY for each event in the final _common_clean file
| Quadrant A | 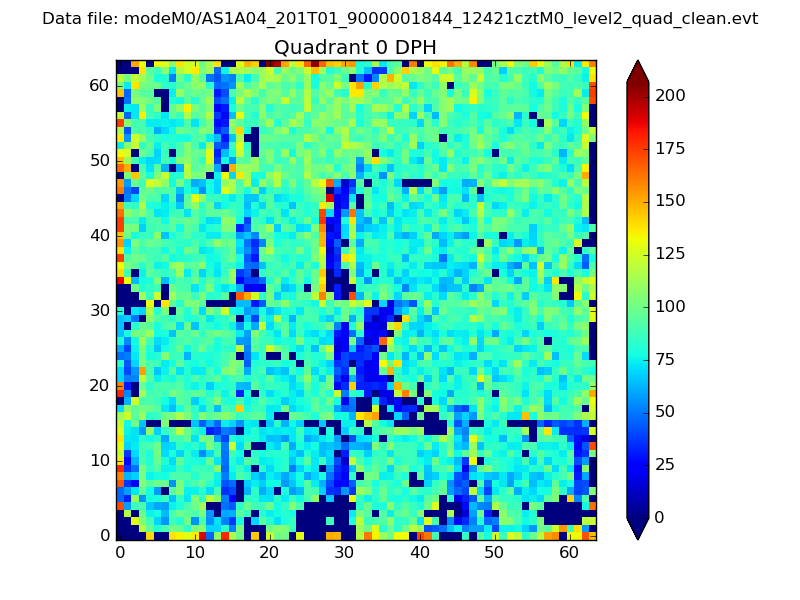 |
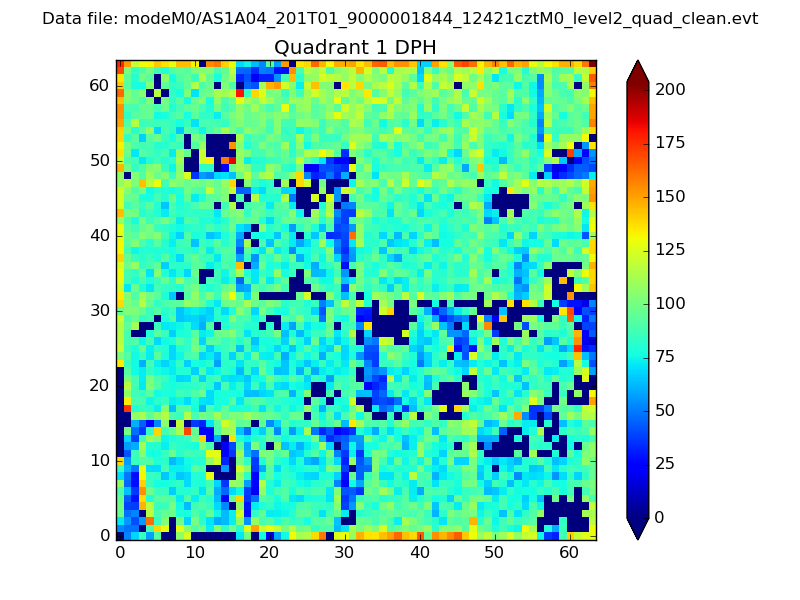 |
Quadrant B |
|---|---|---|---|
| Quadrant D | 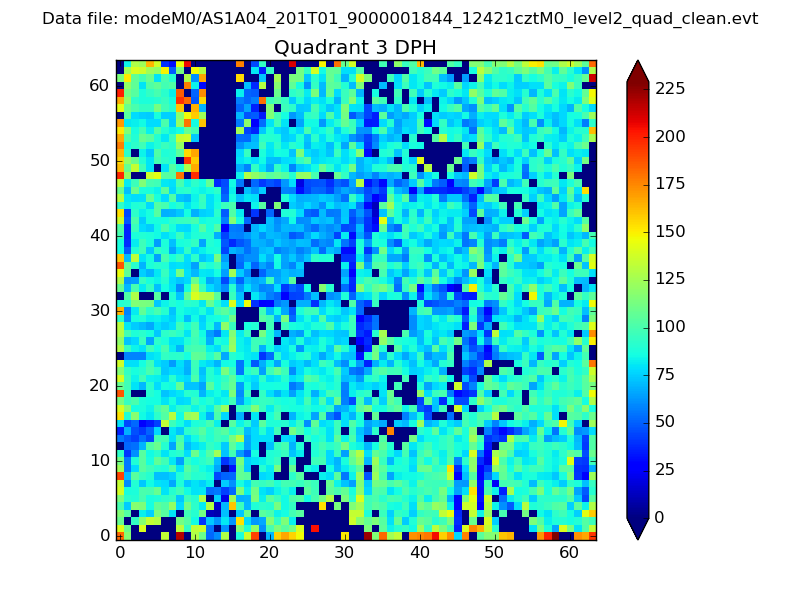 |
 |
Quadrant C |
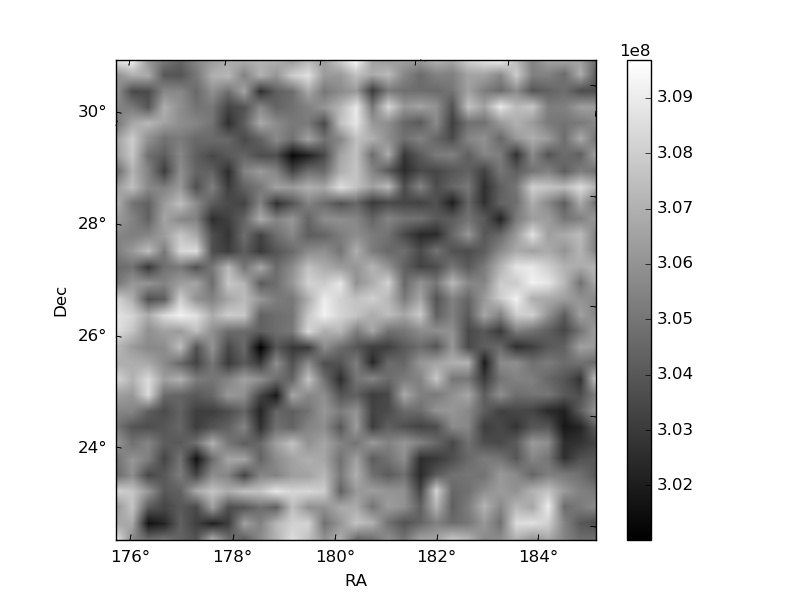
| Plot type | Count rate plots | Images |
|---|---|---|
| Comparison with Poisson distribution Blue bars denote a histogram of data divided into 1 sec bins. Red curve is a Poisson curve with rate = median count rate of data. |
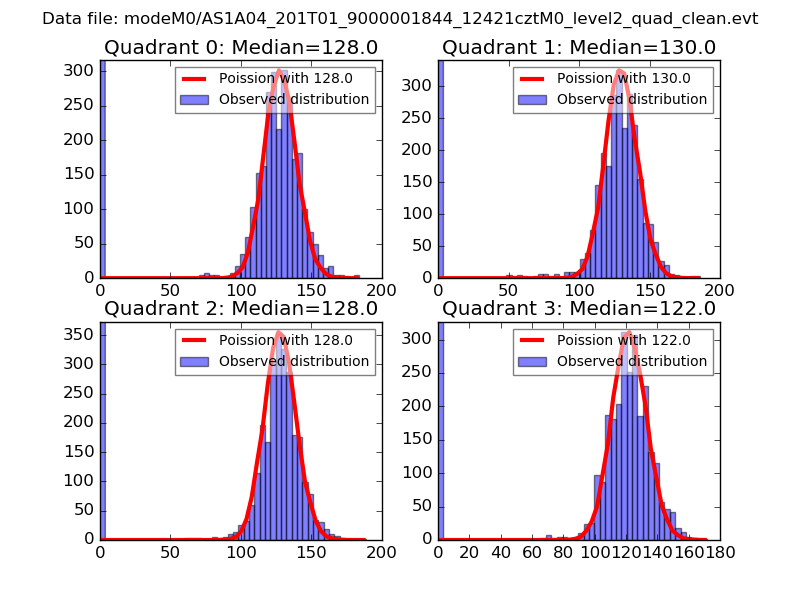 |
 |
| Quadrant-wise count rates Data is divided into 100 sec bins |
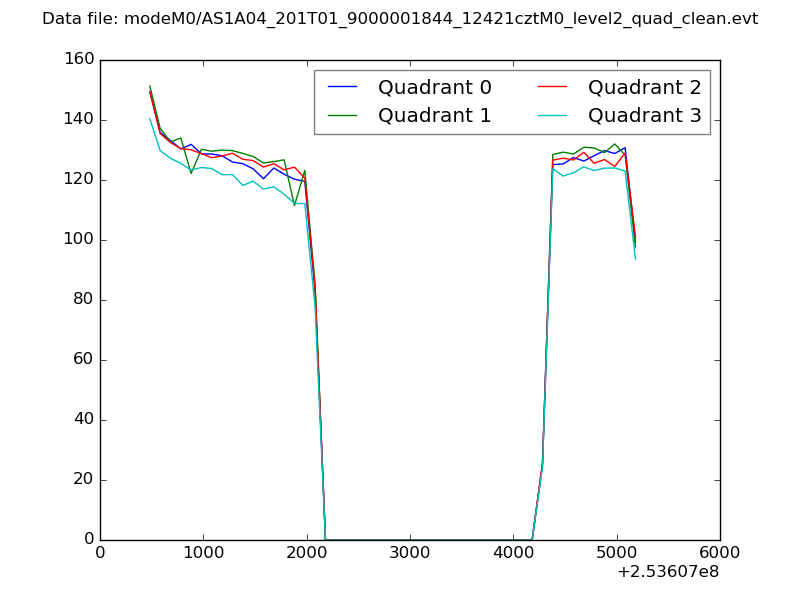 |
|
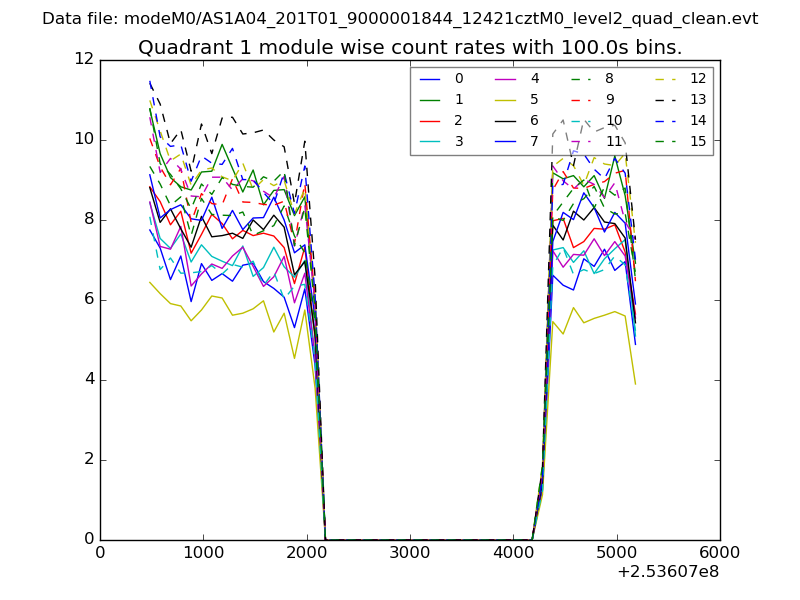
| Module-wise count rates for Quadrant A Data is divided into 100 sec bins |
 |
 |
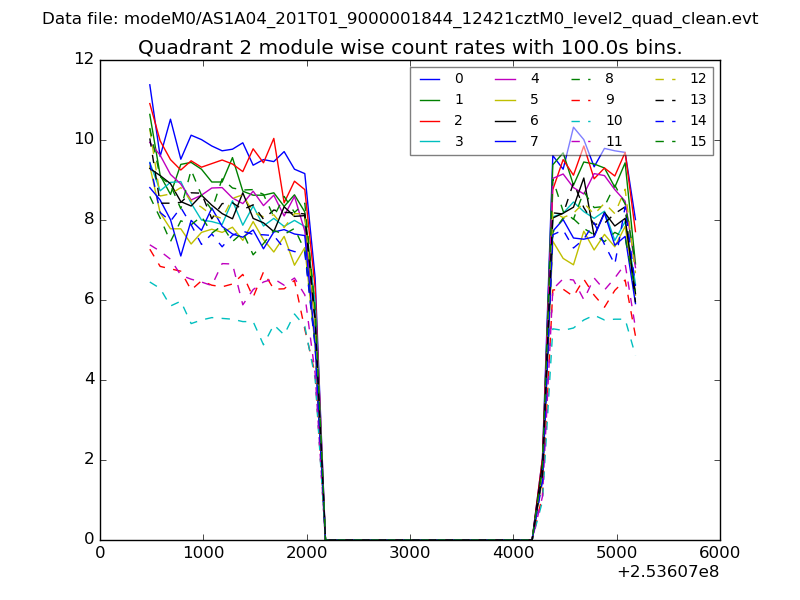
| Module-wise count rates for Quadrant B Data is divided into 100 sec bins |
 |
 |
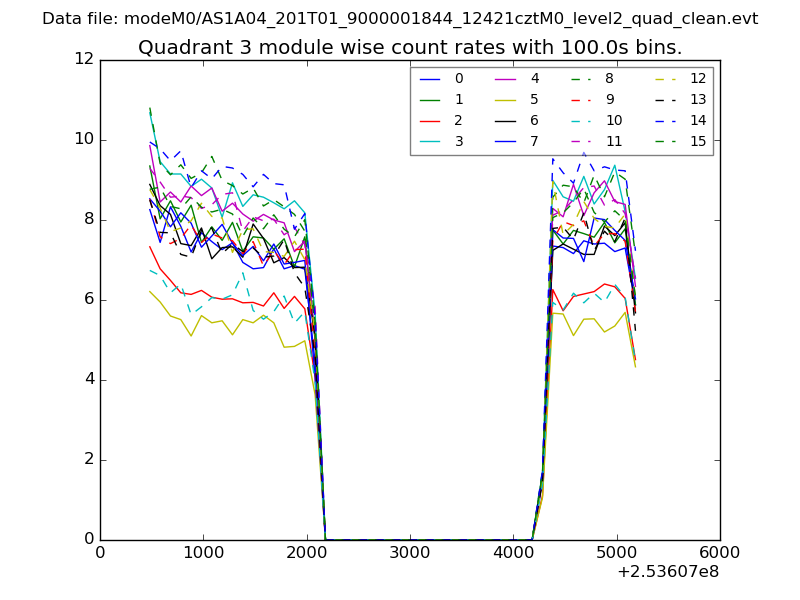
| Module-wise count rates for Quadrant C Data is divided into 100 sec bins |
 |
 |
| Module-wise count rates for Quadrant D Data is divided into 100 sec bins |
 |
 |
| Parameter | Plot |
|---|---|
| CZT HV Monitor | 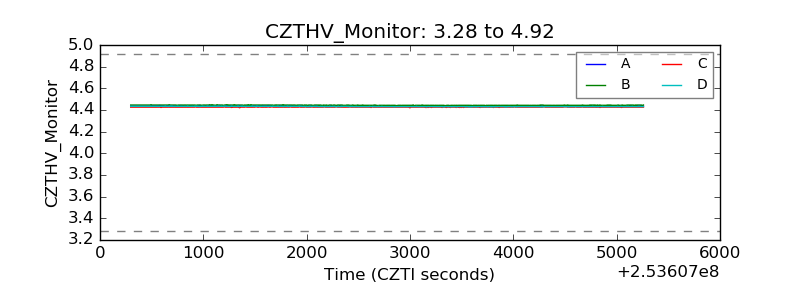 |
| D_VDD | 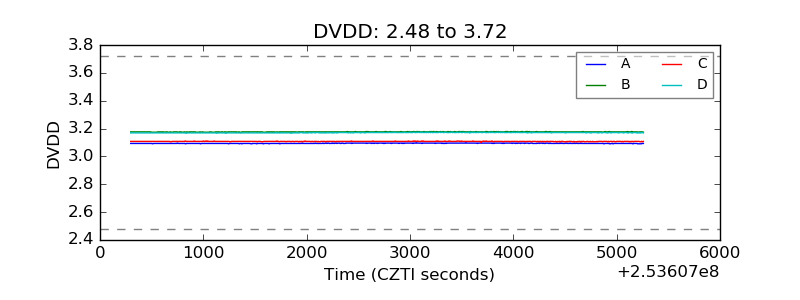 |
| Temperature 1 | 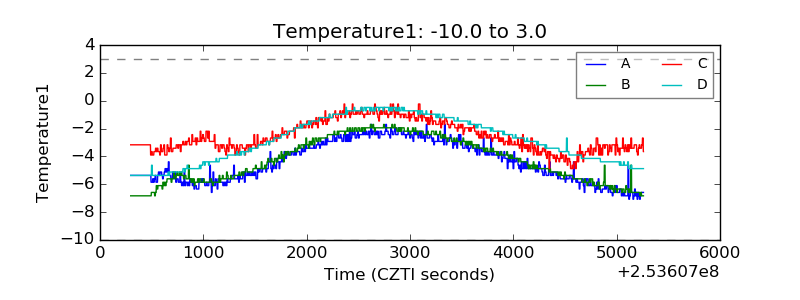 |
| Veto HV Monitor | 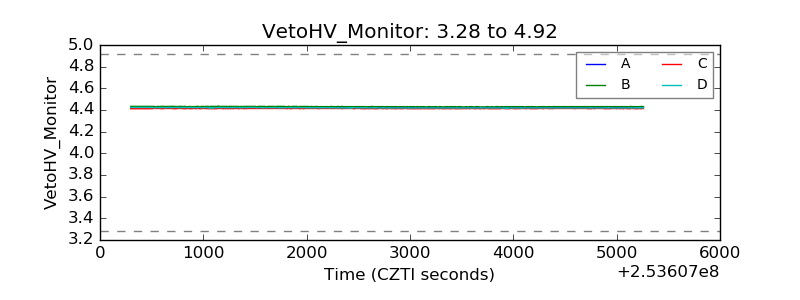 |
| Veto LLD | 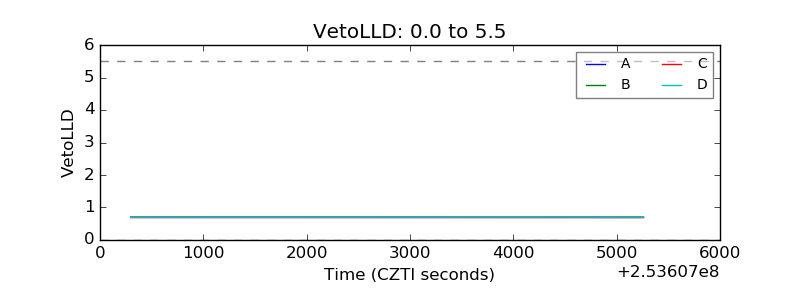 |
| Alpha Counter | 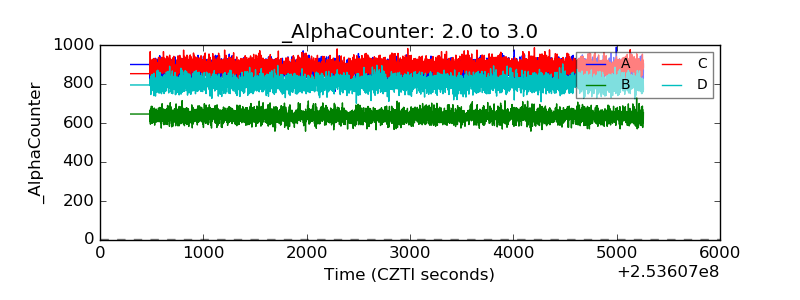 |
| _CPM_Rate | 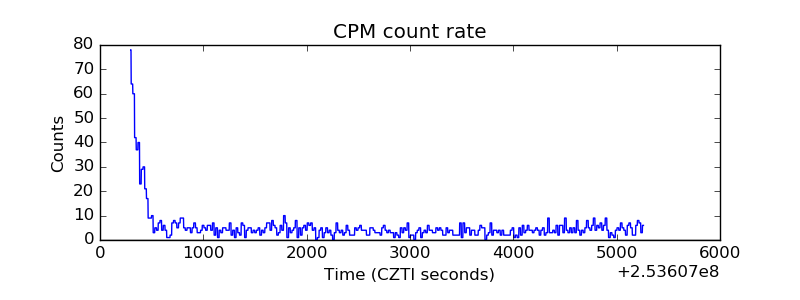 |
| CZT Counter | 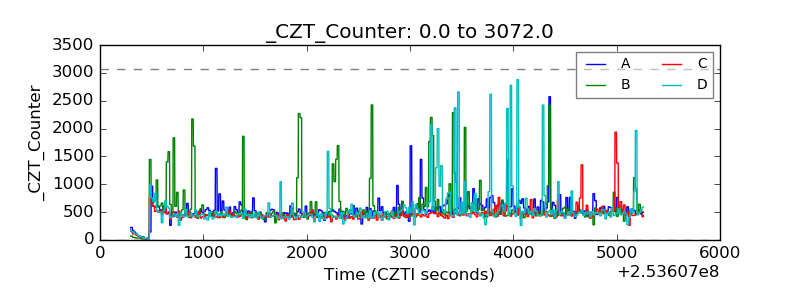 |
| +2.5 Volts monitor |  |
| +5 Volts monitor |  |
| _ROLL_ROT | 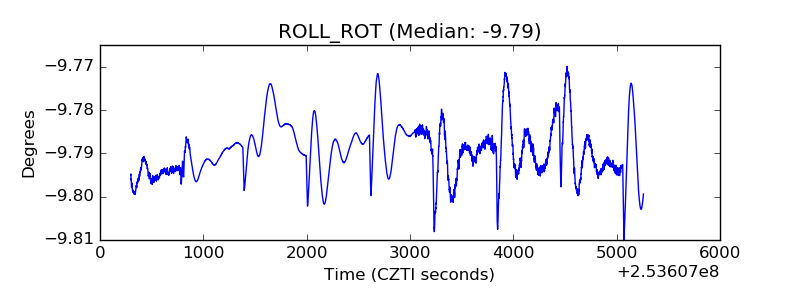 |
| _Roll_DEC | 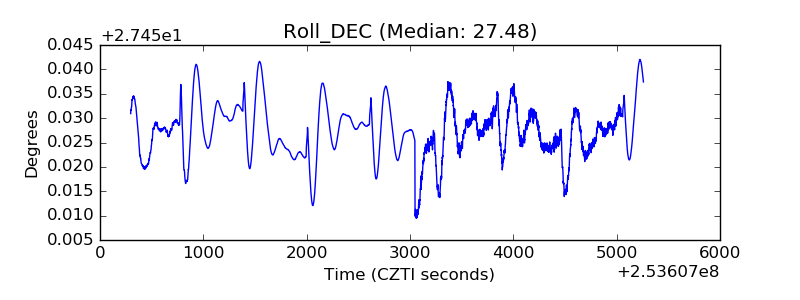 |
| _Roll_RA | 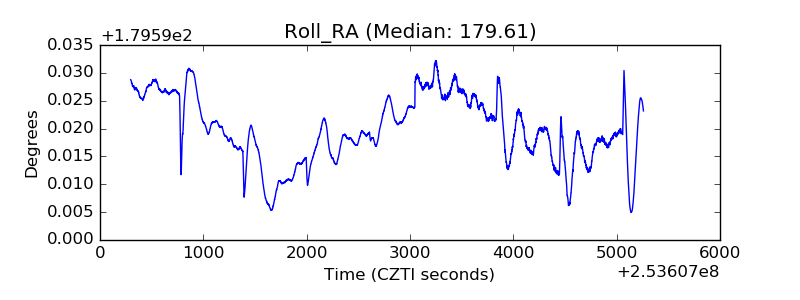 |
| Veto Counter | 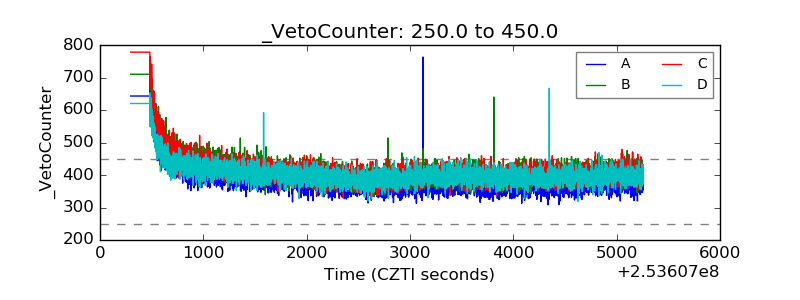 |