| Param | Original file | Final file |
|---|---|---|
| Filename | modeM0/AS1A04_085T02_9000001846_12422cztM0_level2.evt | modeM0/AS1A04_085T02_9000001846_12422cztM0_level2_quad_clean.evt |
| Size (bytes) | 567,576,000 | 80,133,120 |
| Size | 541.3 MB | 76.4 MB |
| Events in quadrant A | 4,503,515 | 486,736 |
| Events in quadrant B | 4,360,606 | 493,714 |
| Events in quadrant C | 3,617,768 | 485,018 |
| Events in quadrant D | 4,226,627 | 467,168 |
| Mode M0 | |||
|---|---|---|---|
| Quadrant | BADHDUFLAG | Total packets | Discarded packets |
| A | 0 | 17907 | 2 |
| B | 0 | 17406 | 1 |
| C | 0 | 15486 | 1 |
| D | 0 | 17396 | 1 |
| Mode M9 | |||
|---|---|---|---|
| Quadrant | BADHDUFLAG | Total packets | Discarded packets |
| A | 0 | 4 | 0 |
| B | 0 | 4 | 0 |
| C | 0 | 4 | 0 |
| D | 0 | 4 | 0 |
| Mode SS | |||
|---|---|---|---|
| Quadrant | BADHDUFLAG | Total packets | Discarded packets |
| A | 0 | 144 | 0 |
| B | 0 | 144 | 0 |
| C | 0 | 144 | 0 |
| D | 0 | 144 | 0 |
| Quadrant | Total seconds | Saturated seconds | Saturation percentage |
|---|---|---|---|
| A | 7085 | 221 | 3.119266% |
| B | 7085 | 374 | 5.278758% |
| C | 7085 | 193 | 2.724065% |
| D | 7085 | 295 | 4.163726% |
Noise dominated data is calculated using 1-second bins in cleaned event files. If a bin has >2000 counts, and if more than 50% of those come from <1% of pixels, then it is considered to be noise-dominated and hence unusable.
| Quadrant | # 1 sec bins | Bins with >0 counts | Bins with >2000 counts | High rate bins dominated by noise | Noise dominated (total time) | Noise dominated (detector-on time) | Marked lightcurve |
|---|---|---|---|---|---|---|---|
| A | 7501 | 7087 | 39 | 39 | 0.52% | 0.55% | 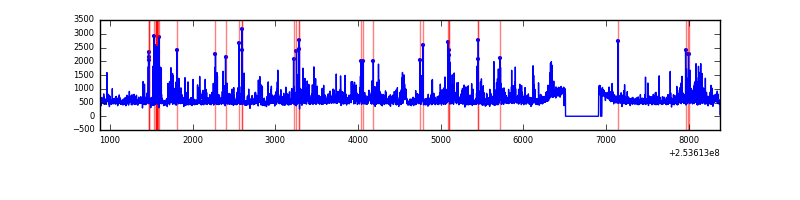 |
| B | 7501 | 7087 | 171 | 171 | 2.28% | 2.41% | 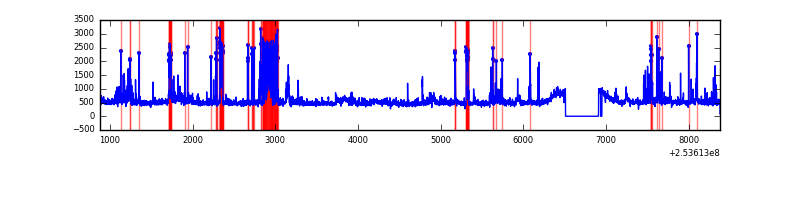 |
| C | 7501 | 7087 | 49 | 49 | 0.65% | 0.69% | 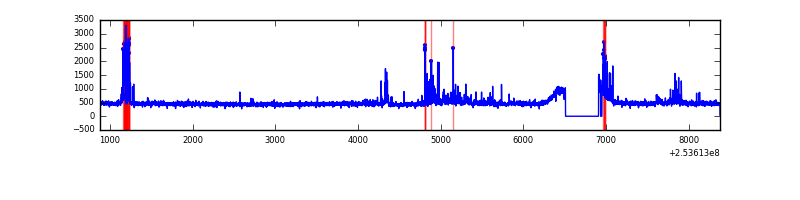 |
| D | 7501 | 7087 | 156 | 156 | 2.08% | 2.20% | 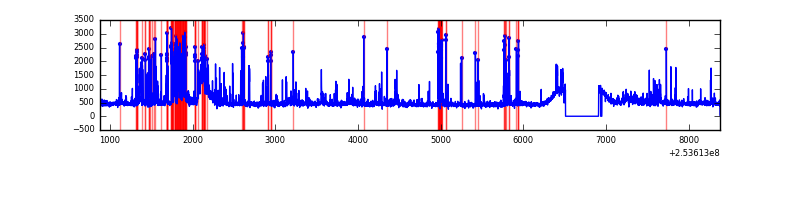 |
Top three noisy pixels from each quadrant. If the there are fewer than three noisy pixels in the level2.evt file, extra rows are filled as -1
| Pixel properties | Quadrant properties | ||||||
|---|---|---|---|---|---|---|---|
| Quadrant | DetID | PixID | Counts | Sigma | Mean | Median | Sigma |
| A | 13 | 251 | 777550 | 4400.36 | 859 | 839 | 176.5 |
| A | 1 | 162 | 107980 | 606.99 | 859 | 839 | 176.5 |
| A | 12 | 189 | 88453 | 496.37 | 859 | 839 | 176.5 |
| B | 4 | 239 | 633458 | 3834.98 | 849 | 828 | 165.0 |
| B | 3 | 64 | 152913 | 921.93 | 849 | 828 | 165.0 |
| B | 0 | 190 | 84023 | 504.33 | 849 | 828 | 165.0 |
| C | 15 | 208 | 353778 | 1789.71 | 835 | 838 | 197.2 |
| C | 13 | 61 | 6064 | 26.5 | 835 | 838 | 197.2 |
| C | 8 | 128 | 3809 | 15.07 | 835 | 838 | 197.2 |
| D | 1 | 52 | 746304 | 3726.52 | 831 | 806 | 200.1 |
| D | 2 | 14 | 147956 | 735.56 | 831 | 806 | 200.1 |
| D | 7 | 71 | 57059 | 281.19 | 831 | 806 | 200.1 |
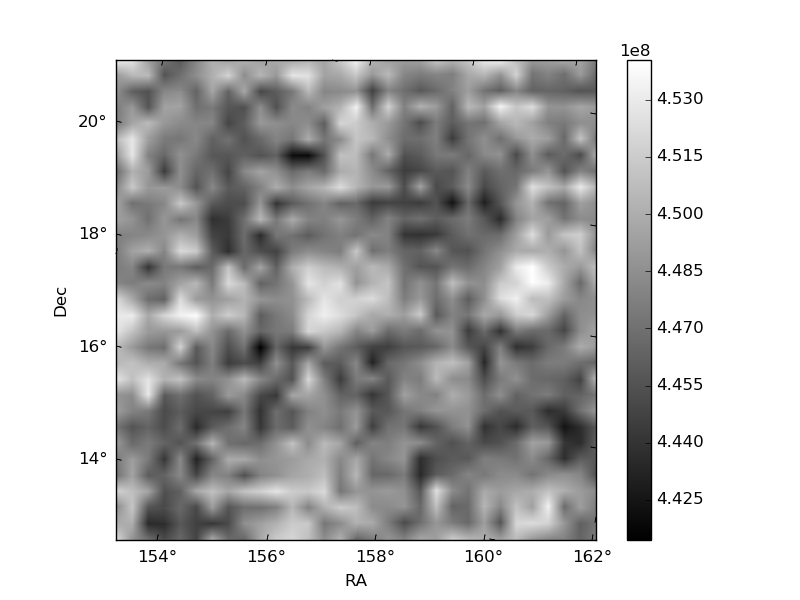
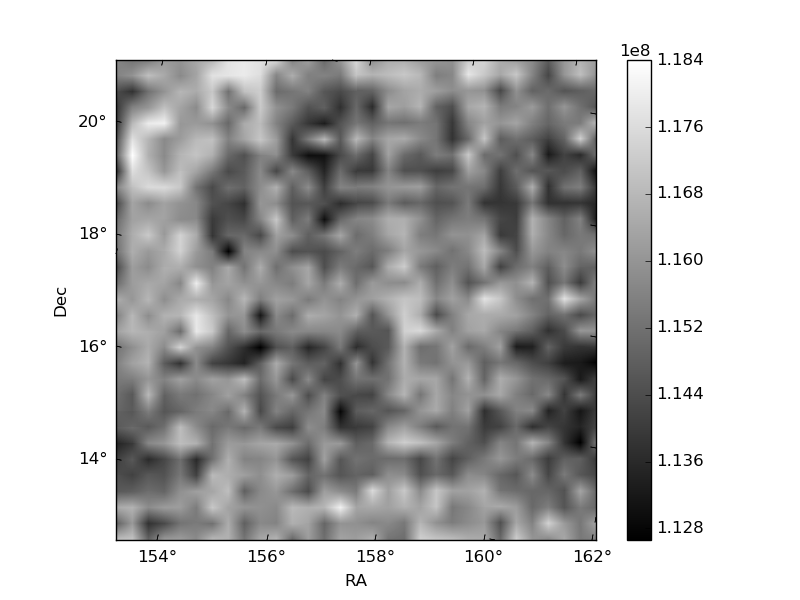
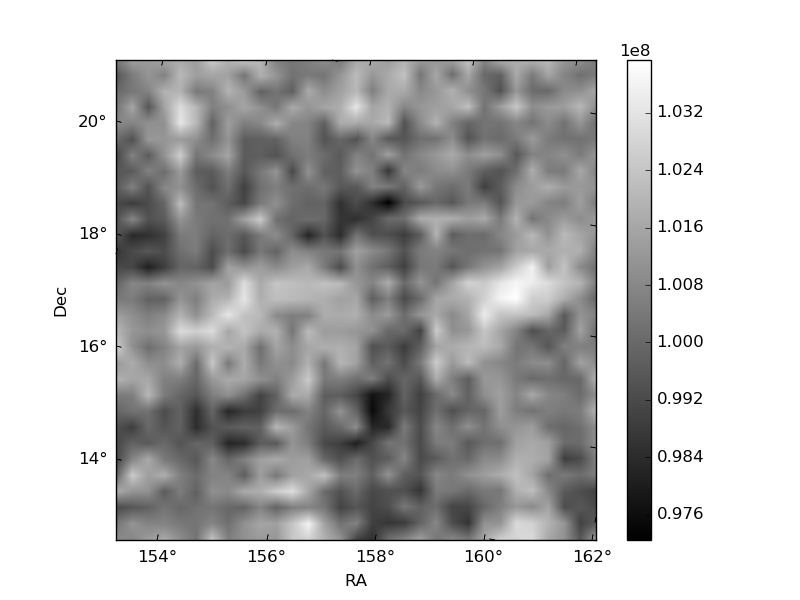
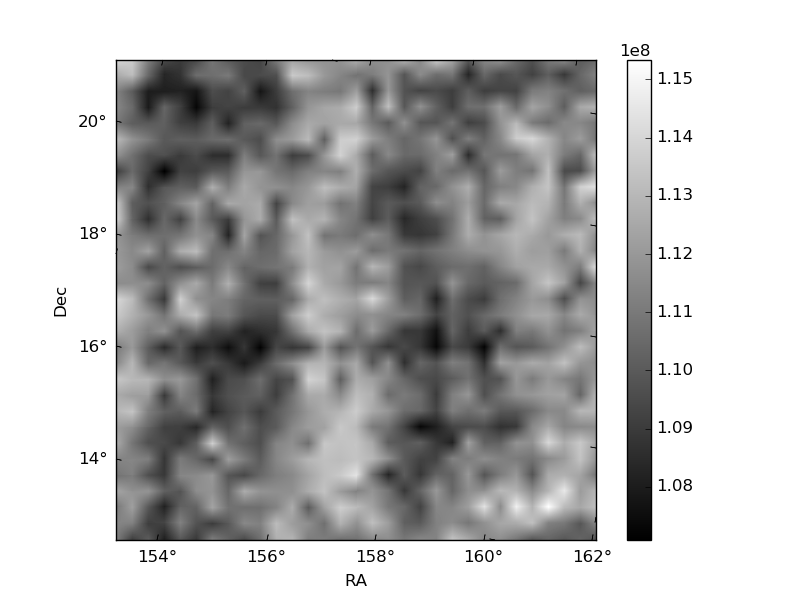
Histogram calculated using DETX and DETY for each event in the final _common_clean file
| Quadrant A | 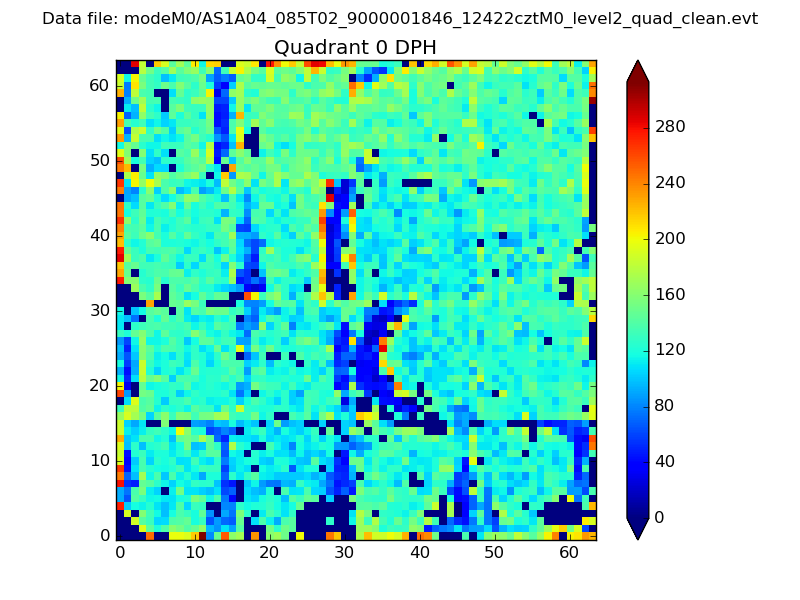 |
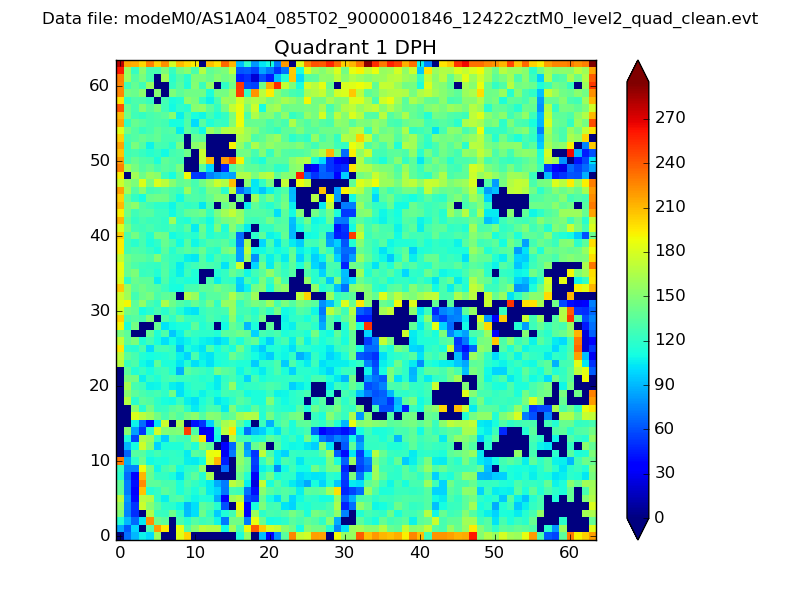 |
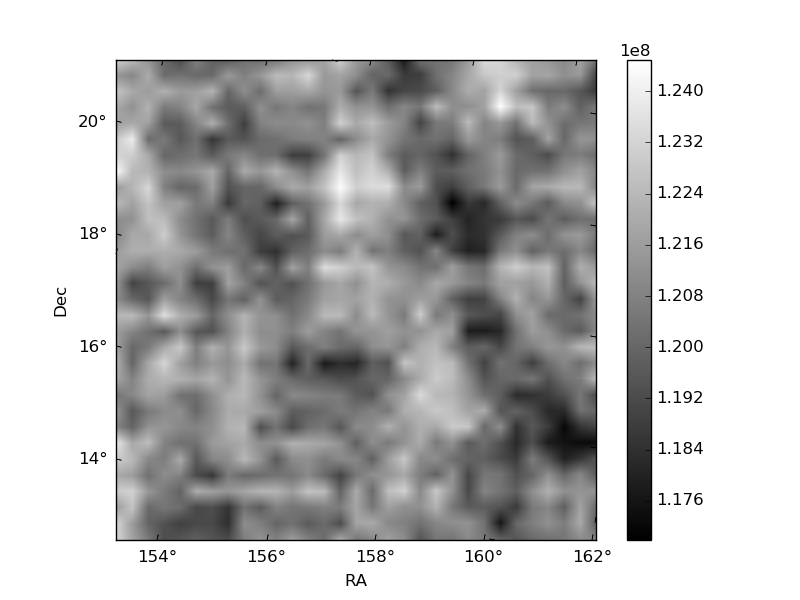
Quadrant B |
|---|---|---|---|
| Quadrant D | 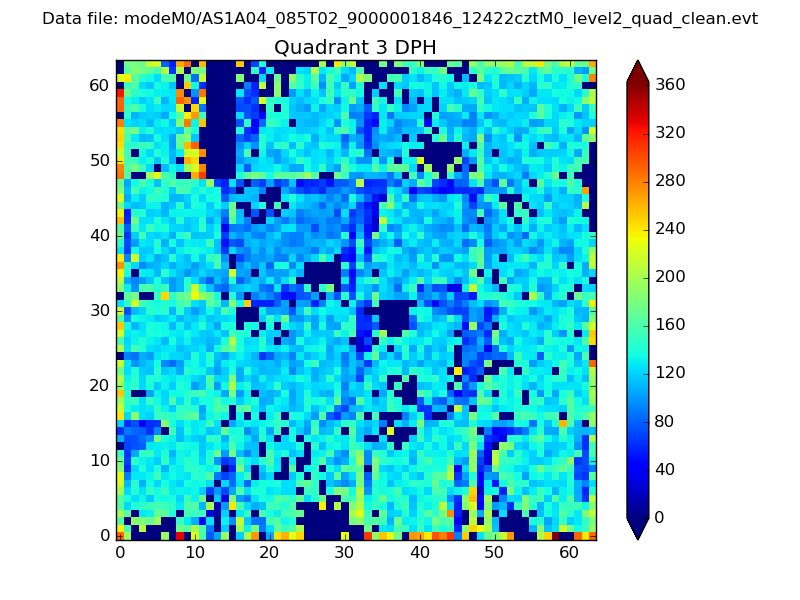 |
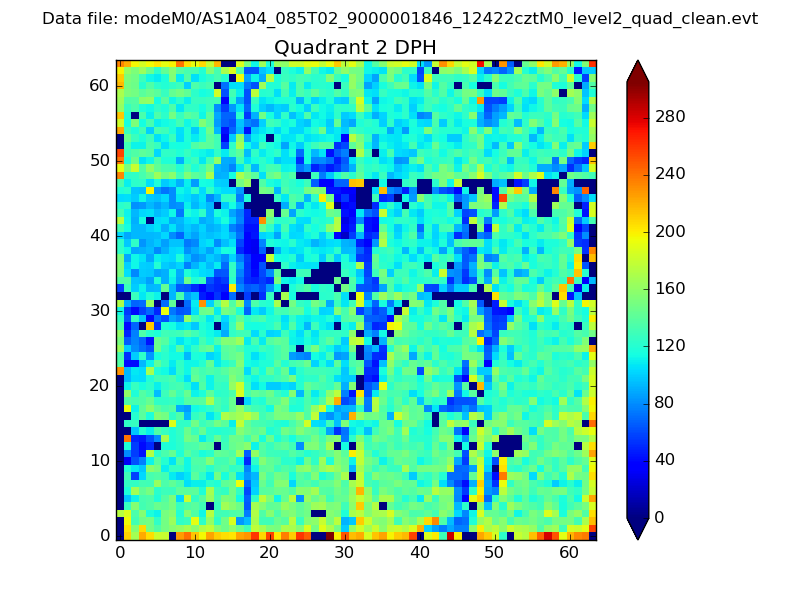 |
Quadrant C |
| Plot type | Count rate plots | Images |
|---|---|---|
| Comparison with Poisson distribution Blue bars denote a histogram of data divided into 1 sec bins. Red curve is a Poisson curve with rate = median count rate of data. |
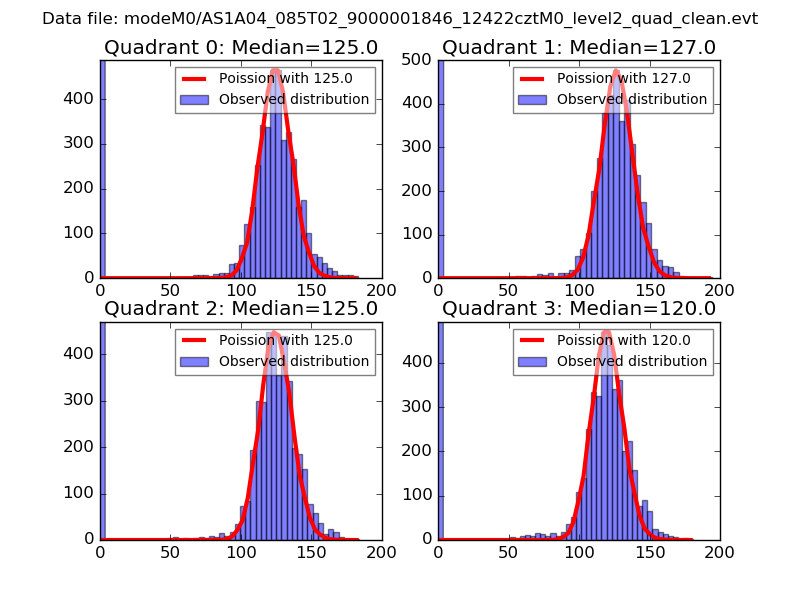 |
 |
| Quadrant-wise count rates Data is divided into 100 sec bins |
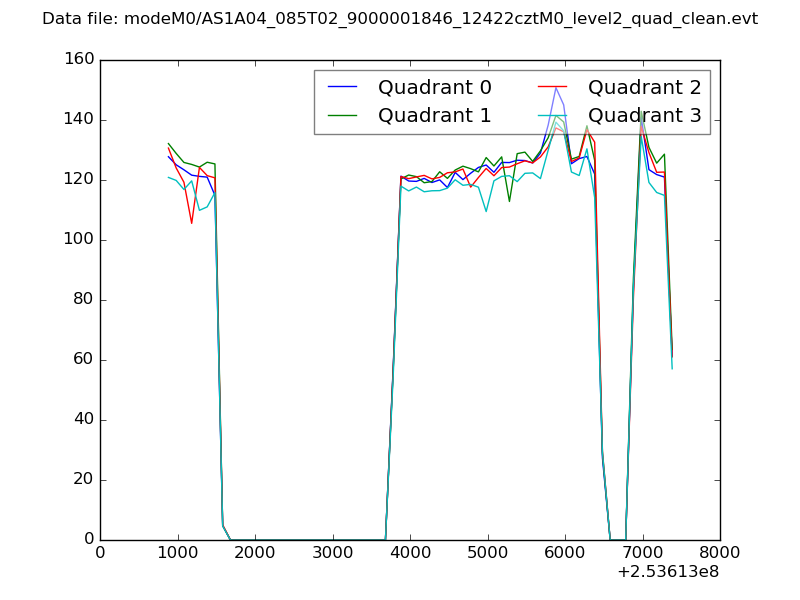 |
|
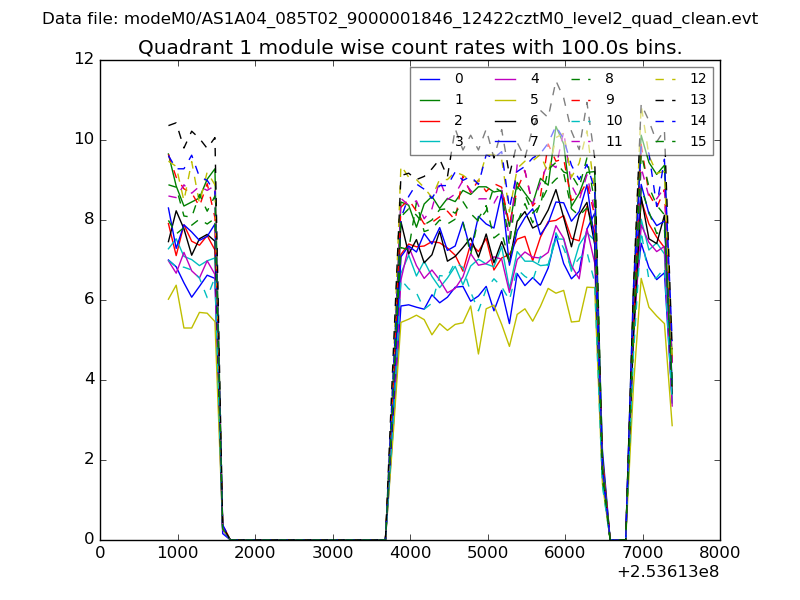
| Module-wise count rates for Quadrant A Data is divided into 100 sec bins |
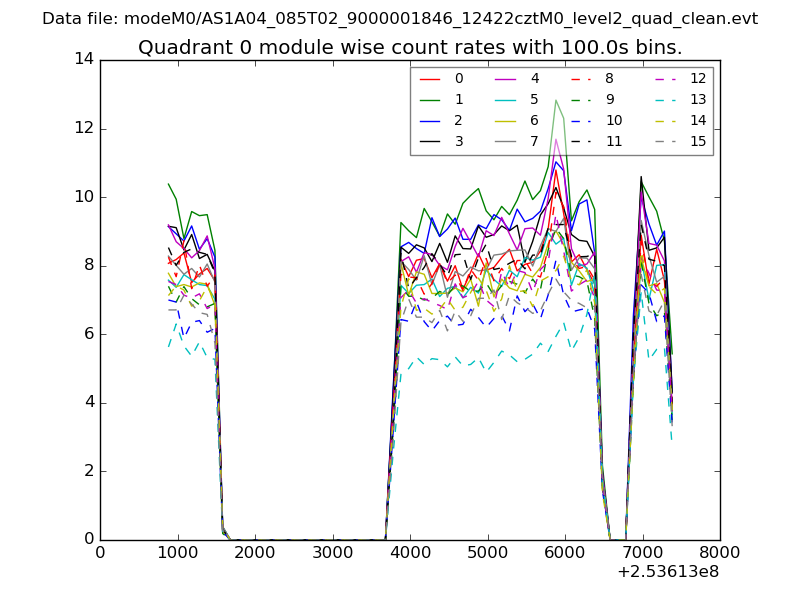 |
 |
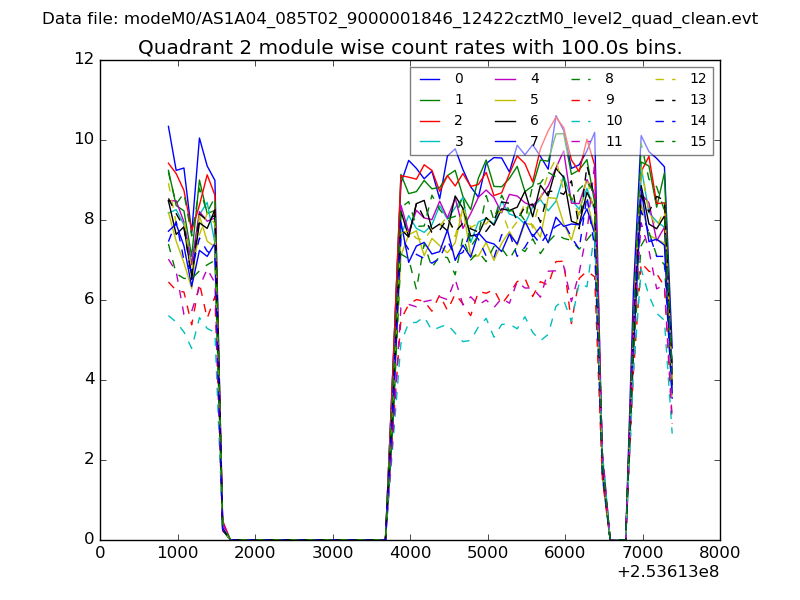
| Module-wise count rates for Quadrant B Data is divided into 100 sec bins |
 |
 |
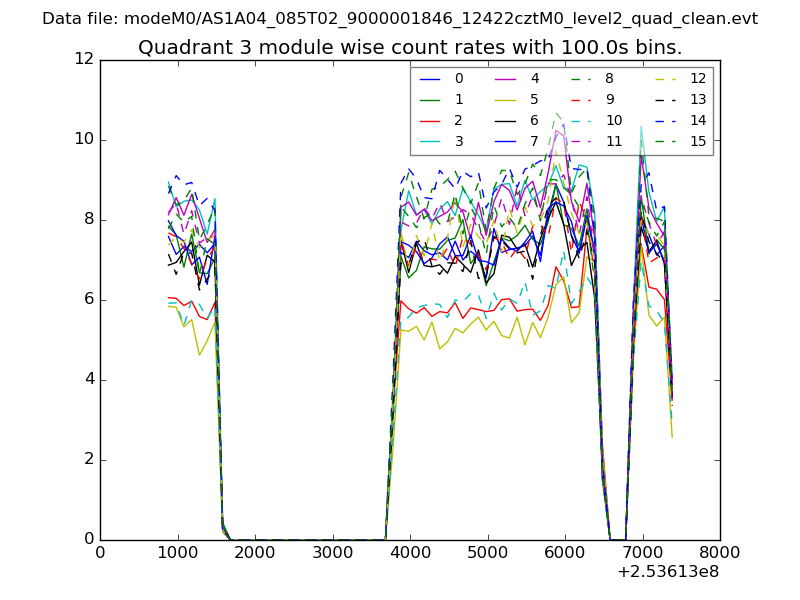
| Module-wise count rates for Quadrant C Data is divided into 100 sec bins |
 |
 |
| Module-wise count rates for Quadrant D Data is divided into 100 sec bins |
 |
 |
| Parameter | Plot |
|---|---|
| CZT HV Monitor | 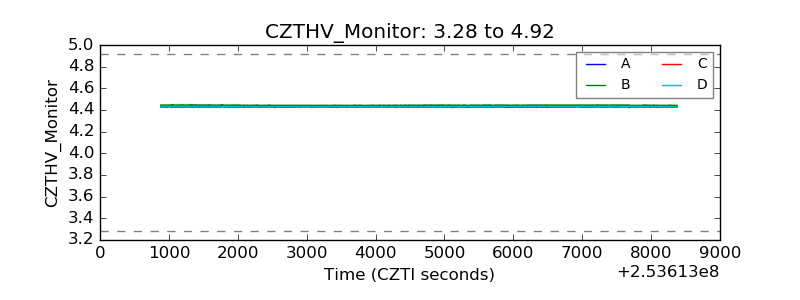 |
| D_VDD | 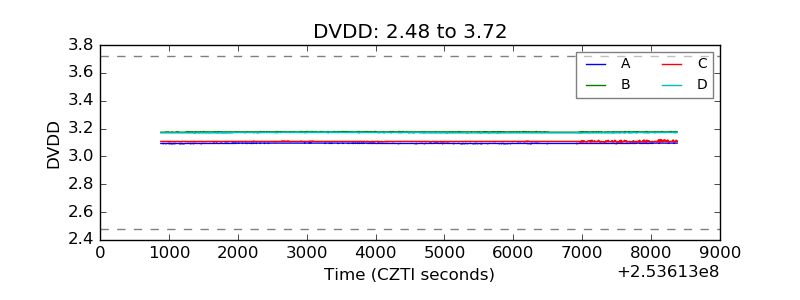 |
| Temperature 1 | 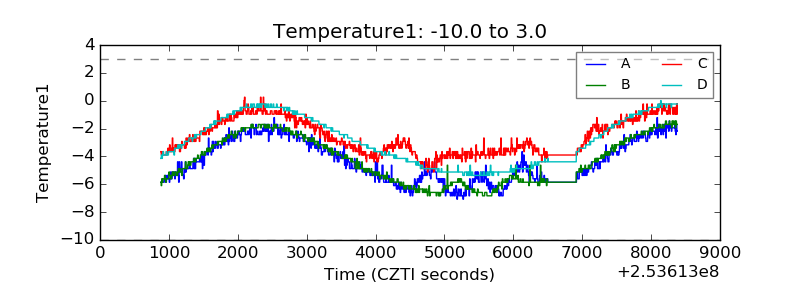 |
| Veto HV Monitor | 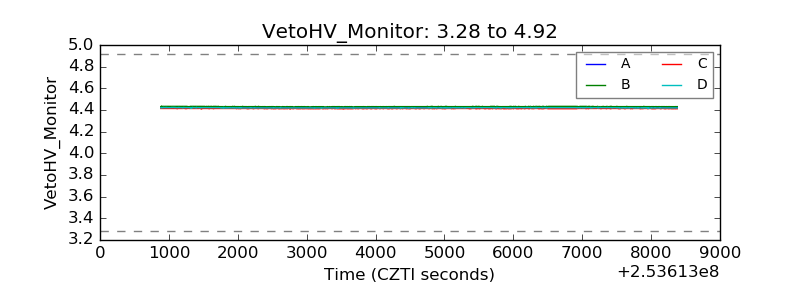 |
| Veto LLD |  |
| Alpha Counter | 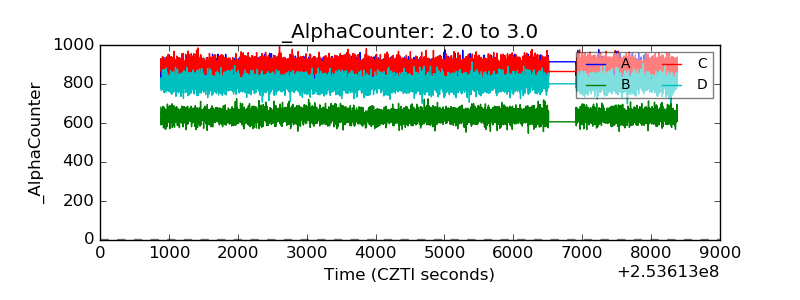 |
| _CPM_Rate | 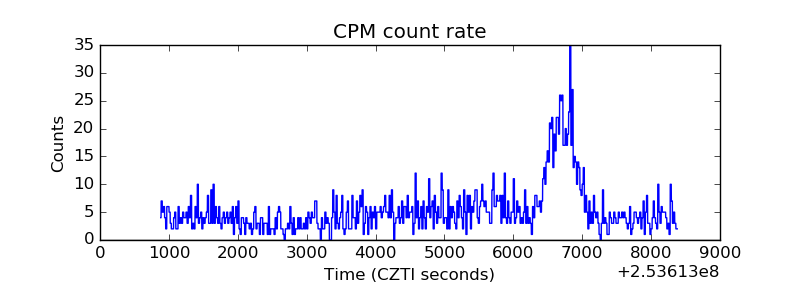 |
| CZT Counter | 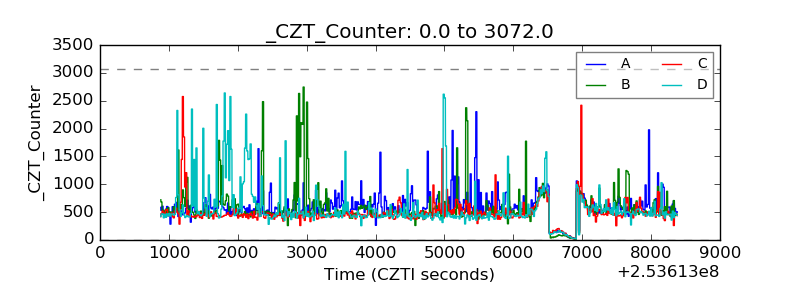 |
| +2.5 Volts monitor |  |
| +5 Volts monitor |  |
| _ROLL_ROT | 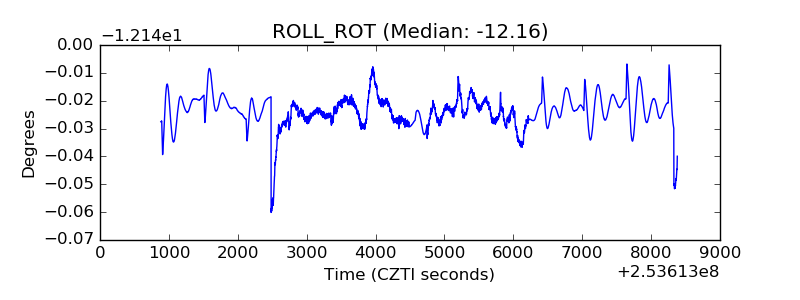 |
| _Roll_DEC | 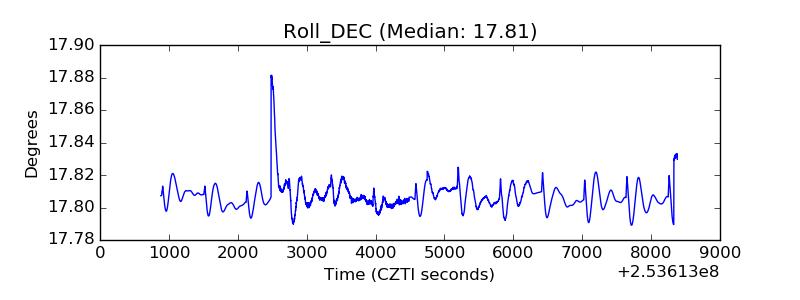 |
| _Roll_RA | 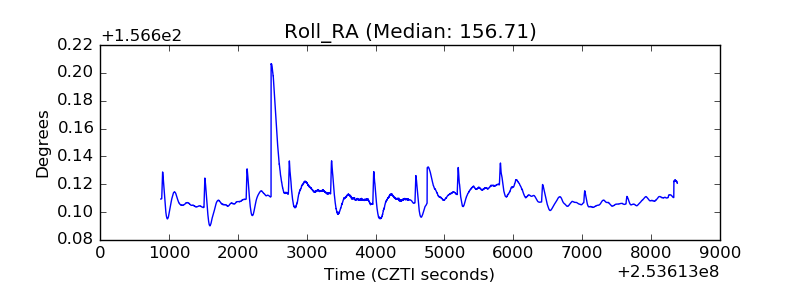 |
| Veto Counter | 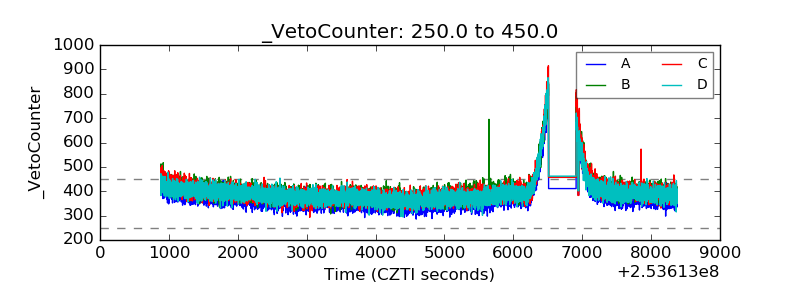 |