| Param | Original file | Final file |
|---|---|---|
| Filename | modeM0/AS1A04_085T02_9000001846_12423cztM0_level2.evt | modeM0/AS1A04_085T02_9000001846_12423cztM0_level2_quad_clean.evt |
| Size (bytes) | 639,624,960 | 88,499,520 |
| Size | 610.0 MB | 84.4 MB |
| Events in quadrant A | 5,470,929 | 535,022 |
| Events in quadrant B | 4,510,048 | 540,201 |
| Events in quadrant C | 3,960,232 | 531,288 |
| Events in quadrant D | 4,881,458 | 510,611 |
| Mode M0 | |||
|---|---|---|---|
| Quadrant | BADHDUFLAG | Total packets | Discarded packets |
| A | 0 | 21631 | 4 |
| B | 0 | 18515 | 3 |
| C | 0 | 17267 | 3 |
| D | 0 | 20060 | 3 |
| Mode M9 | |||
|---|---|---|---|
| Quadrant | BADHDUFLAG | Total packets | Discarded packets |
| A | 0 | 5 | 0 |
| B | 0 | 5 | 0 |
| C | 0 | 5 | 0 |
| D | 0 | 5 | 0 |
| Mode SS | |||
|---|---|---|---|
| Quadrant | BADHDUFLAG | Total packets | Discarded packets |
| A | 0 | 170 | 0 |
| B | 0 | 170 | 0 |
| C | 0 | 170 | 0 |
| D | 0 | 170 | 0 |
| Quadrant | Total seconds | Saturated seconds | Saturation percentage |
|---|---|---|---|
| A | 8078 | 416 | 5.149790% |
| B | 8078 | 344 | 4.258480% |
| C | 8078 | 198 | 2.451102% |
| D | 8078 | 386 | 4.778410% |
Noise dominated data is calculated using 1-second bins in cleaned event files. If a bin has >2000 counts, and if more than 50% of those come from <1% of pixels, then it is considered to be noise-dominated and hence unusable.
| Quadrant | # 1 sec bins | Bins with >0 counts | Bins with >2000 counts | High rate bins dominated by noise | Noise dominated (total time) | Noise dominated (detector-on time) | Marked lightcurve |
|---|---|---|---|---|---|---|---|
| A | 8764 | 8080 | 124 | 124 | 1.41% | 1.53% | 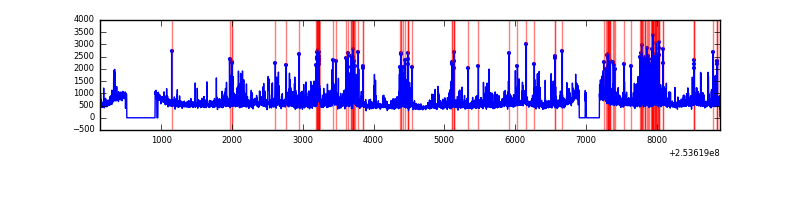 |
| B | 8764 | 8081 | 77 | 77 | 0.88% | 0.95% | 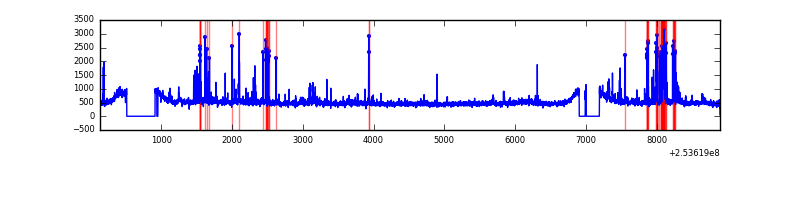 |
| C | 8764 | 8080 | 14 | 14 | 0.16% | 0.17% | 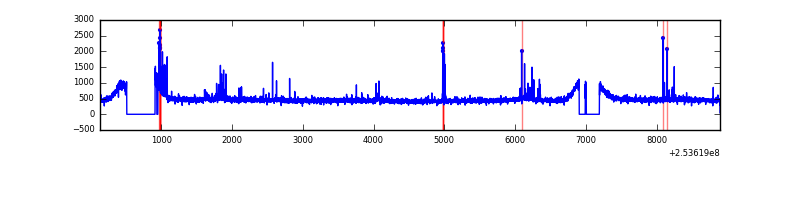 |
| D | 8764 | 8081 | 149 | 149 | 1.70% | 1.84% | 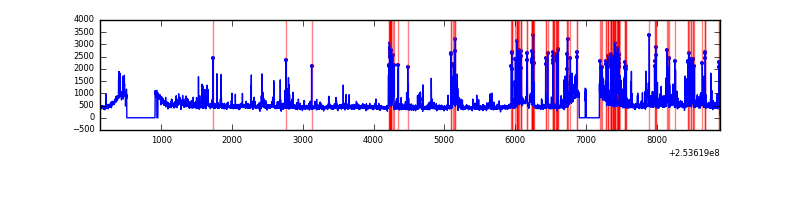 |
Top three noisy pixels from each quadrant. If the there are fewer than three noisy pixels in the level2.evt file, extra rows are filled as -1
| Pixel properties | Quadrant properties | ||||||
|---|---|---|---|---|---|---|---|
| Quadrant | DetID | PixID | Counts | Sigma | Mean | Median | Sigma |
| A | 13 | 251 | 1089261 | 5196.91 | 1000 | 975 | 209.4 |
| A | 1 | 162 | 125581 | 595.03 | 1000 | 975 | 209.4 |
| A | 8 | 15 | 114827 | 543.68 | 1000 | 975 | 209.4 |
| B | 4 | 239 | 350048 | 1795.02 | 997 | 973 | 194.5 |
| B | 3 | 64 | 118803 | 605.91 | 997 | 973 | 194.5 |
| B | 3 | 209 | 44552 | 224.09 | 997 | 973 | 194.5 |
| C | 15 | 208 | 137529 | 590.94 | 976 | 979 | 231.1 |
| C | 8 | 128 | 10322 | 40.43 | 976 | 979 | 231.1 |
| C | 13 | 61 | 7253 | 27.15 | 976 | 979 | 231.1 |
| D | 1 | 52 | 922021 | 3876.49 | 971 | 942 | 237.6 |
| D | 10 | 157 | 80595 | 335.23 | 971 | 942 | 237.6 |
| D | 13 | 104 | 48675 | 200.89 | 971 | 942 | 237.6 |
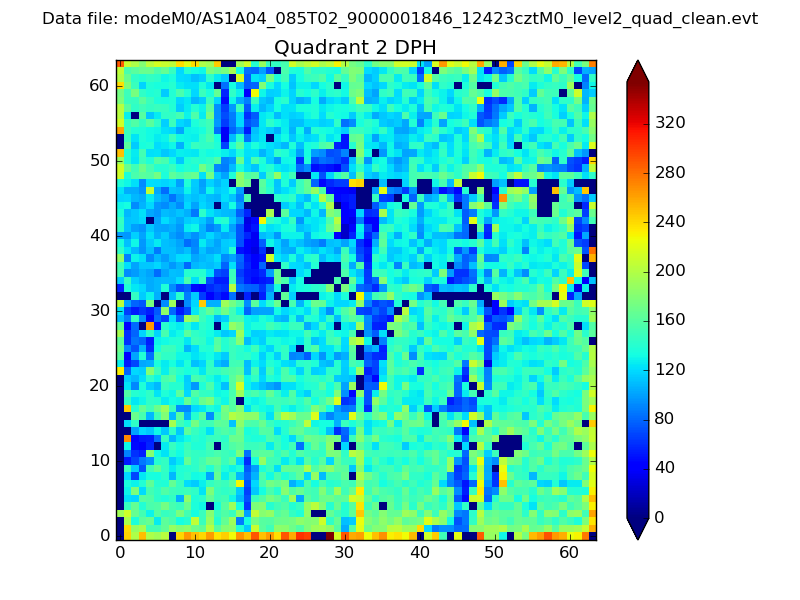
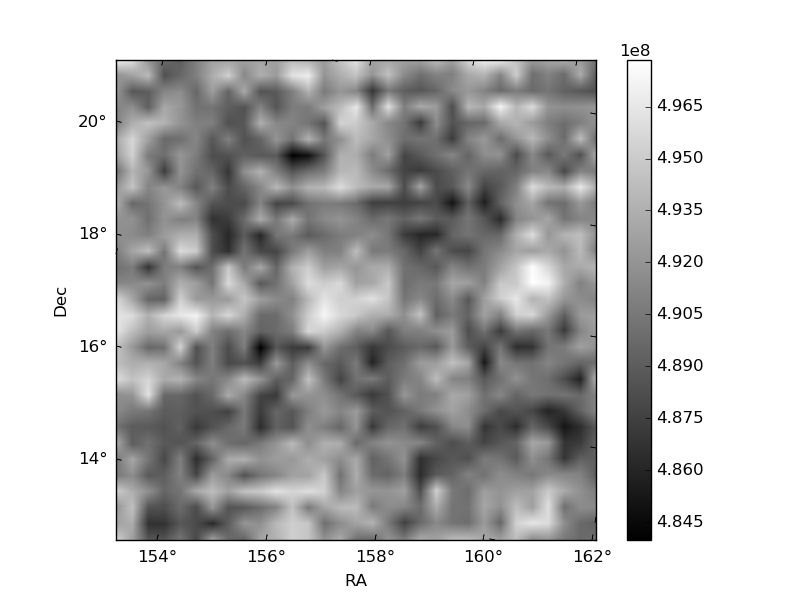
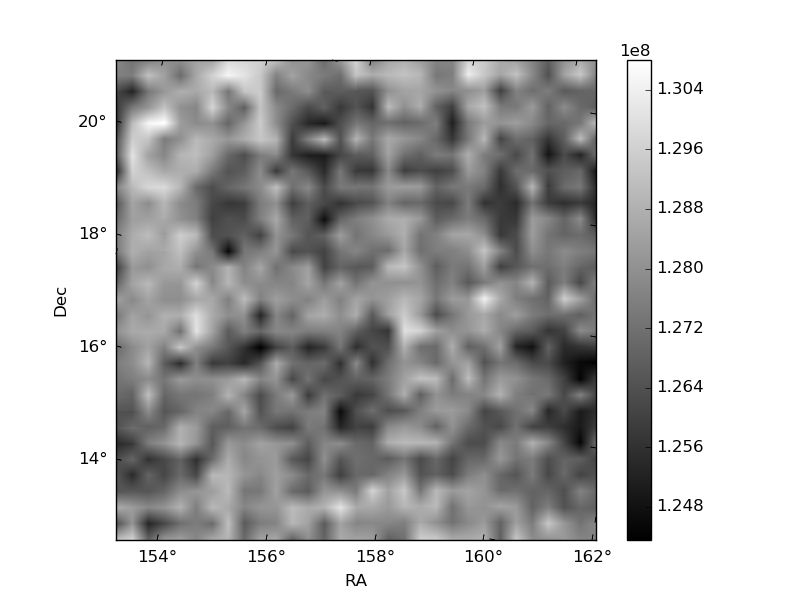
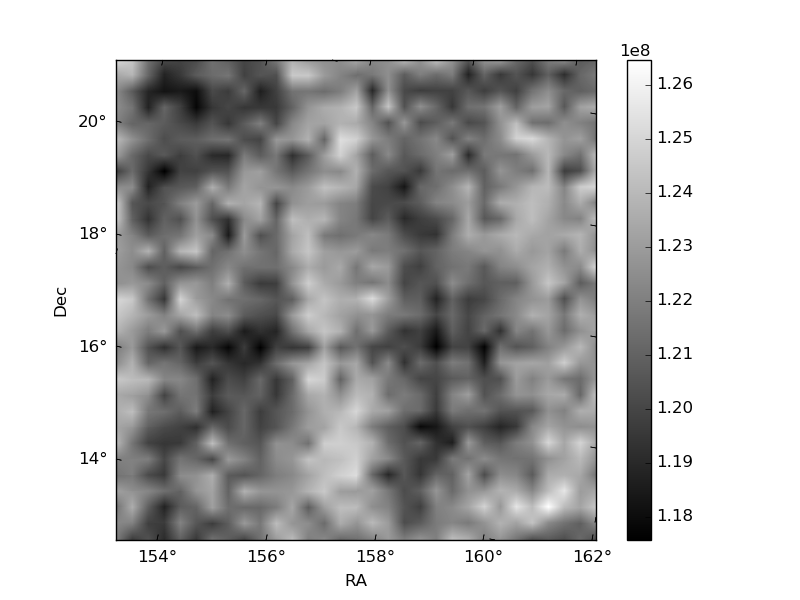
Histogram calculated using DETX and DETY for each event in the final _common_clean file
| Quadrant A | 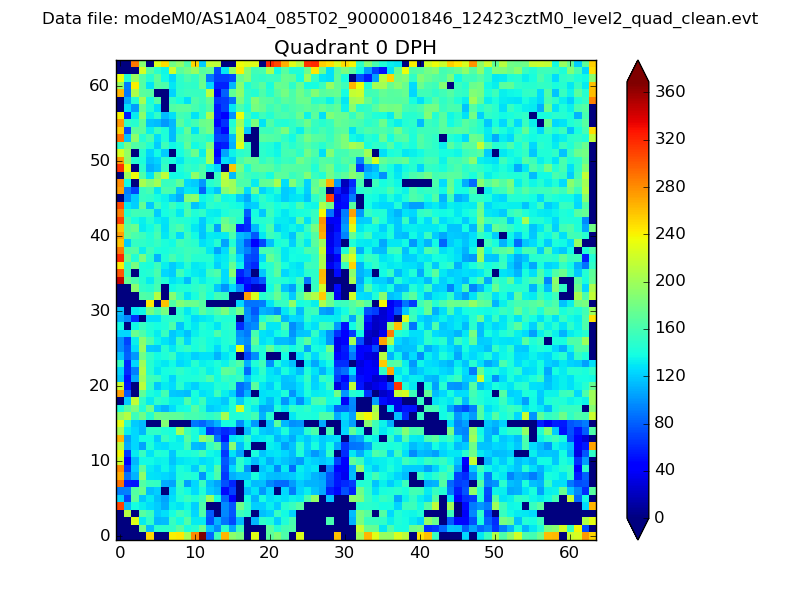 |
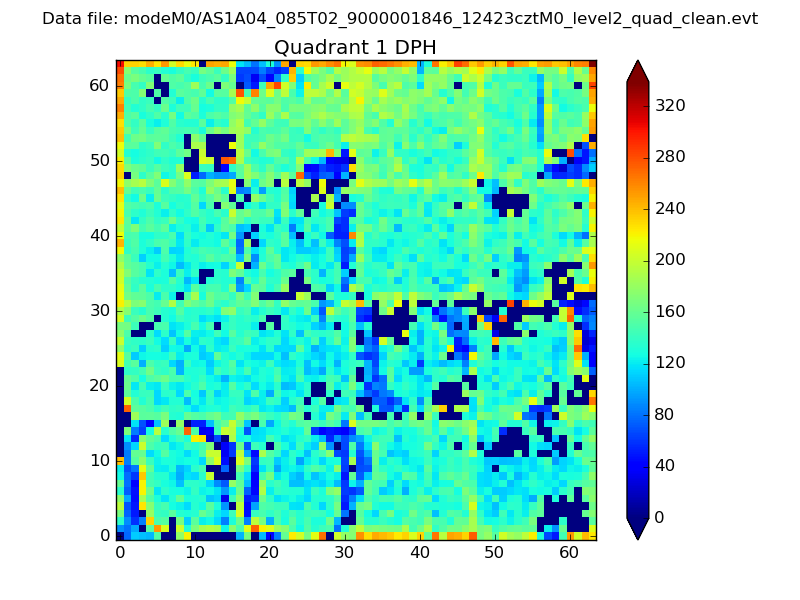 |
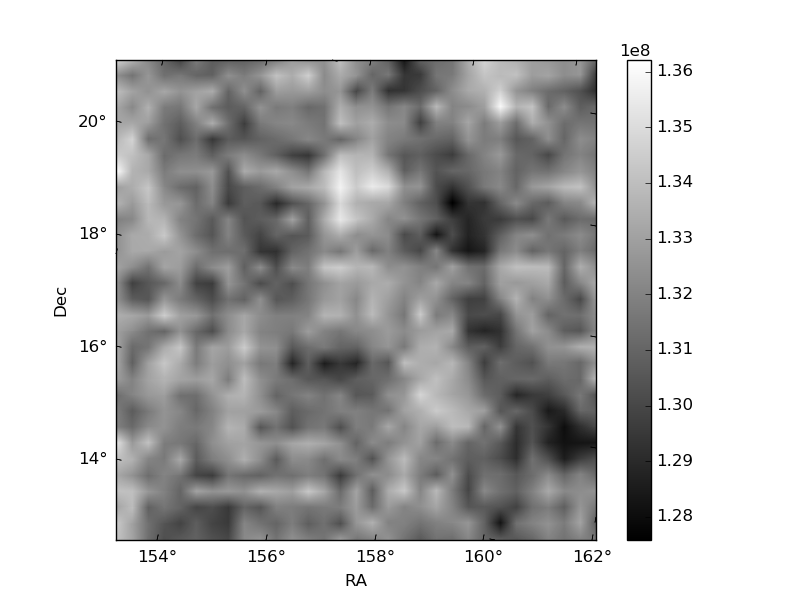
Quadrant B |
|---|---|---|---|
| Quadrant D | 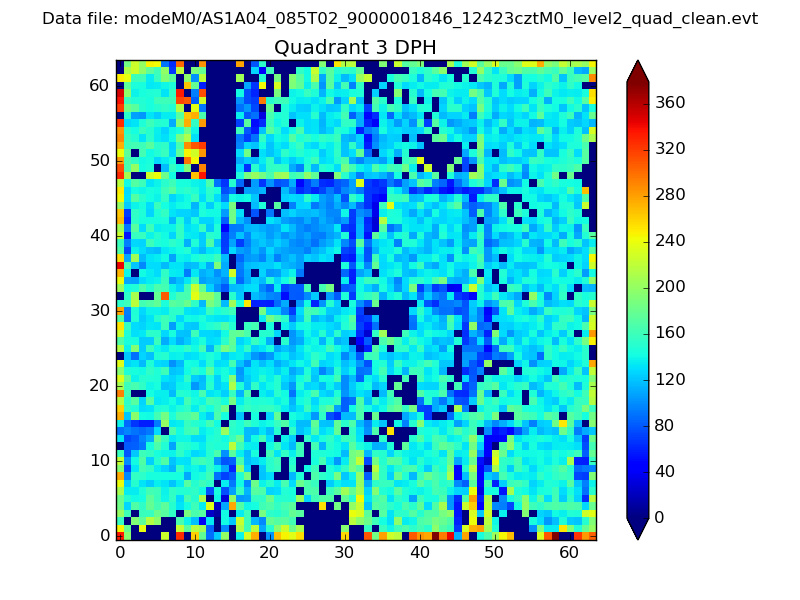 |
 |
Quadrant C |
| Plot type | Count rate plots | Images |
|---|---|---|
| Comparison with Poisson distribution Blue bars denote a histogram of data divided into 1 sec bins. Red curve is a Poisson curve with rate = median count rate of data. |
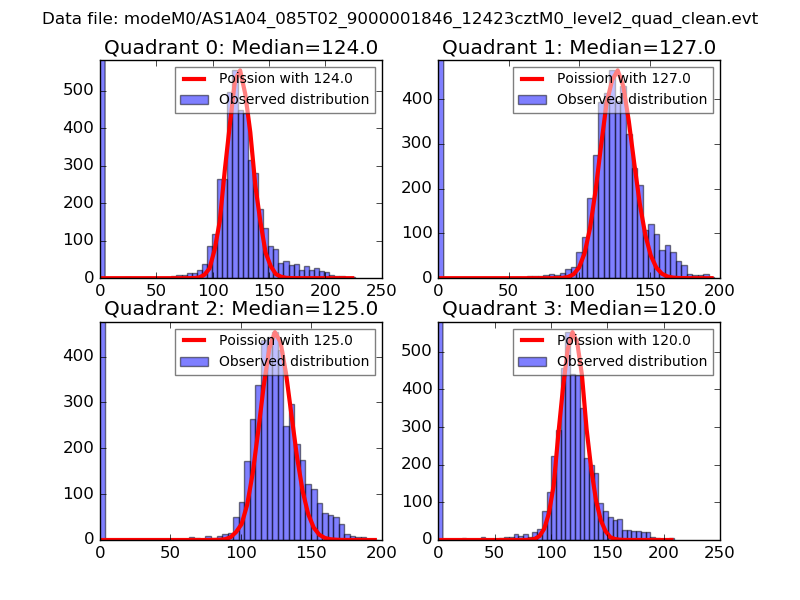 |
 |
| Quadrant-wise count rates Data is divided into 100 sec bins |
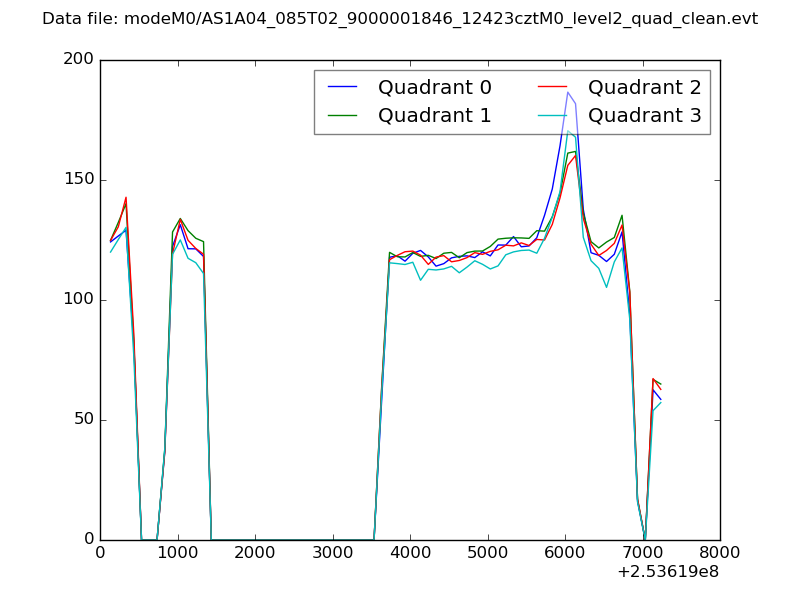 |
|
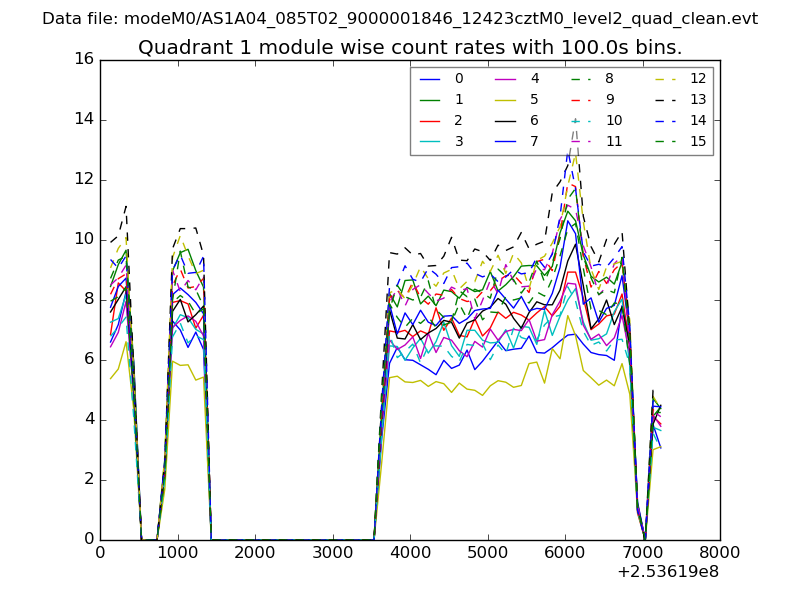
| Module-wise count rates for Quadrant A Data is divided into 100 sec bins |
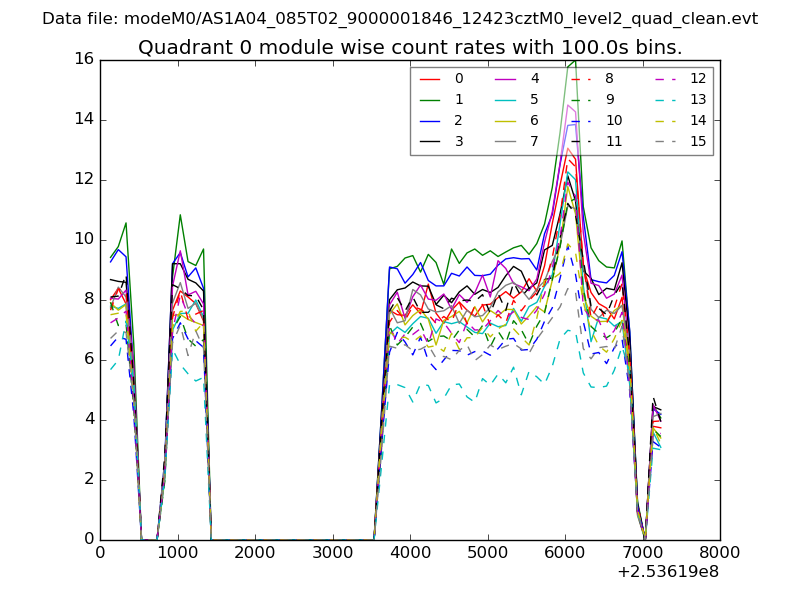 |
 |
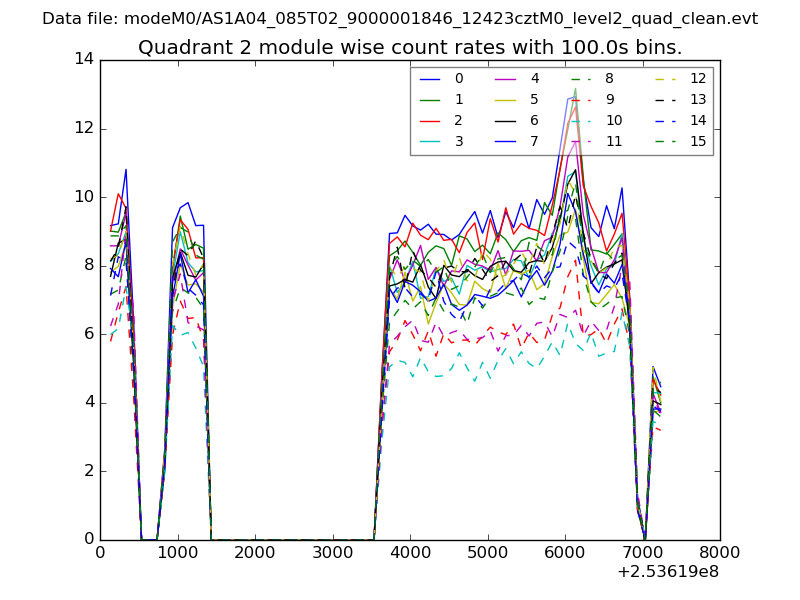
| Module-wise count rates for Quadrant B Data is divided into 100 sec bins |
 |
 |
| Module-wise count rates for Quadrant C Data is divided into 100 sec bins |
 |
 |
| Module-wise count rates for Quadrant D Data is divided into 100 sec bins |
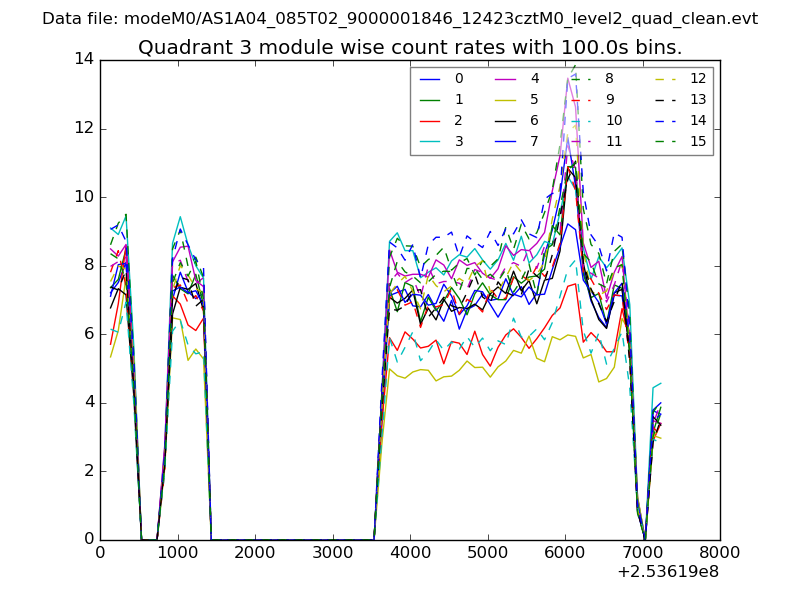 |
 |
| Parameter | Plot |
|---|---|
| CZT HV Monitor | 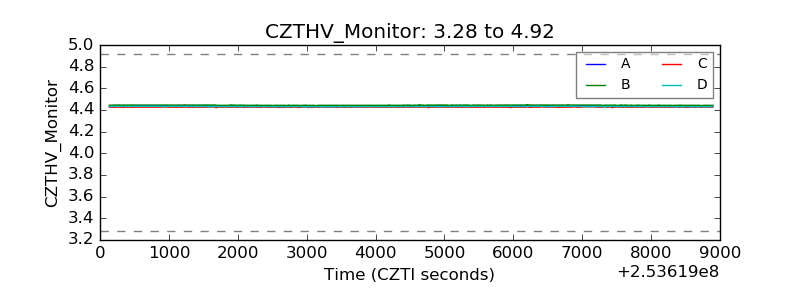 |
| D_VDD | 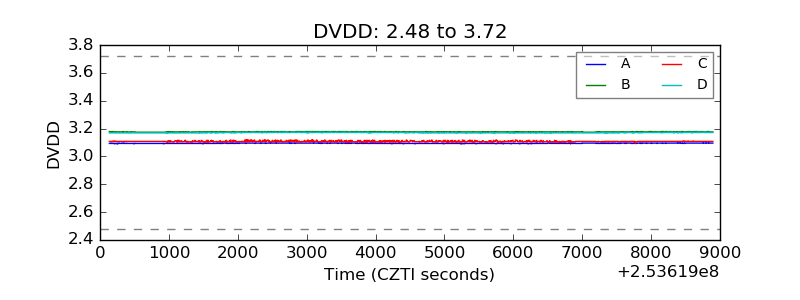 |
| Temperature 1 | 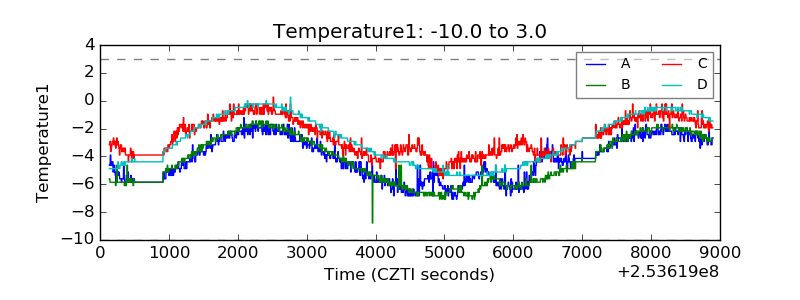 |
| Veto HV Monitor |  |
| Veto LLD | 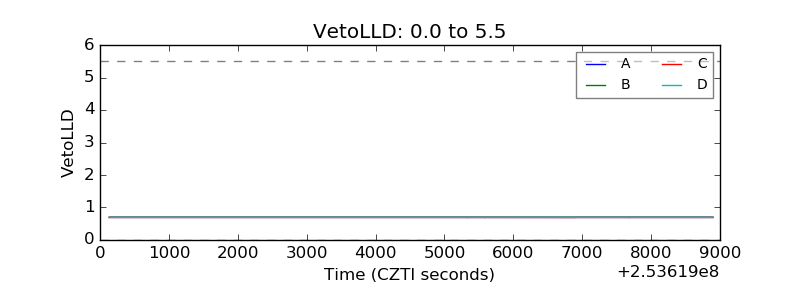 |
| Alpha Counter | 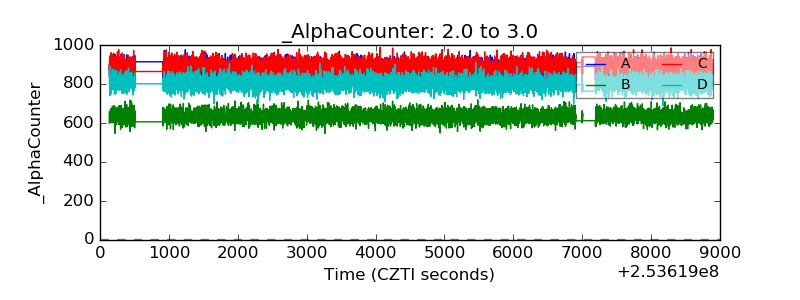 |
| _CPM_Rate | 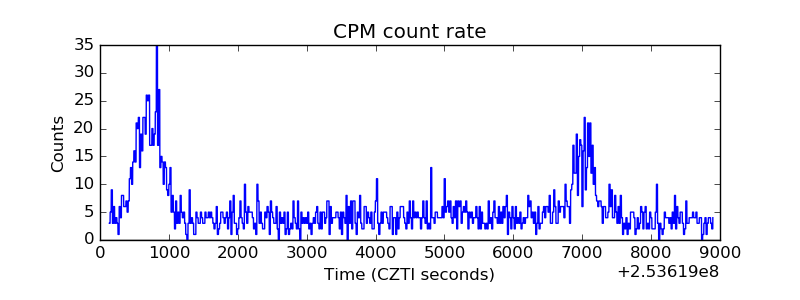 |
| CZT Counter |  |
| +2.5 Volts monitor |  |
| +5 Volts monitor |  |
| _ROLL_ROT | 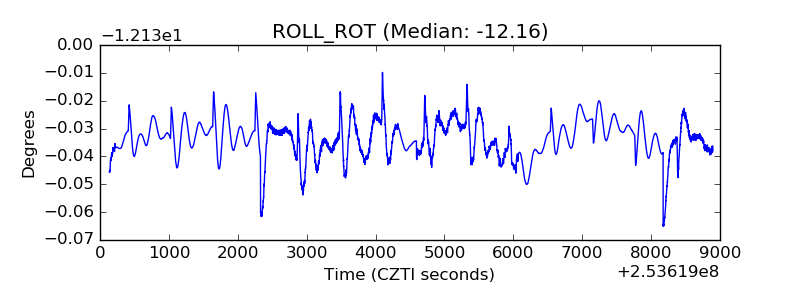 |
| _Roll_DEC | 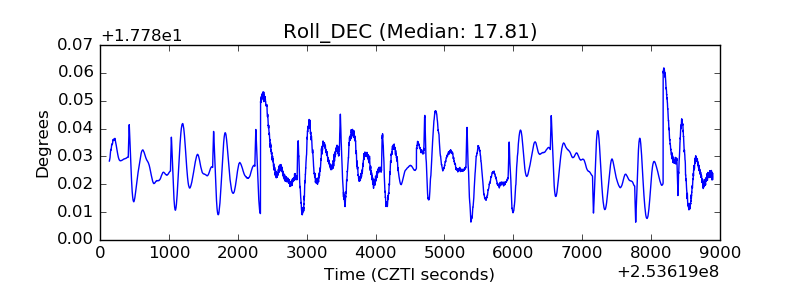 |
| _Roll_RA | 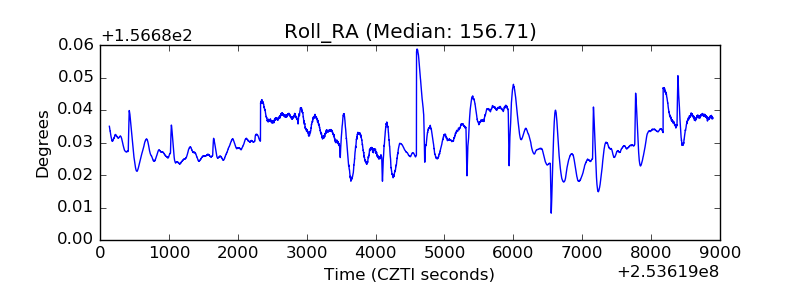 |
| Veto Counter | 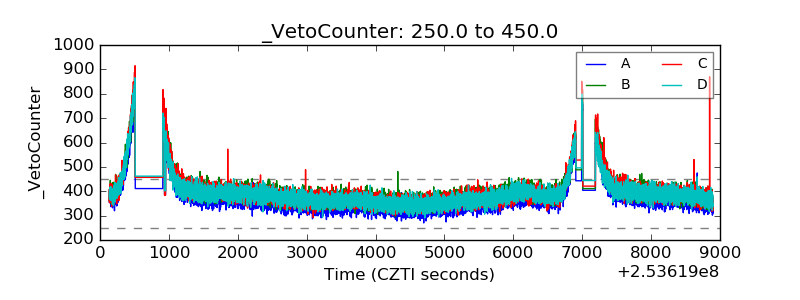 |