| Param | Original file | Final file |
|---|---|---|
| Filename | modeM0/AS1A04_085T02_9000001846_12424cztM0_level2.evt | modeM0/AS1A04_085T02_9000001846_12424cztM0_level2_quad_clean.evt |
| Size (bytes) | 335,635,200 | 38,548,800 |
| Size | 320.1 MB | 36.8 MB |
| Events in quadrant A | 2,688,697 | 220,816 |
| Events in quadrant B | 2,260,937 | 223,302 |
| Events in quadrant C | 1,843,499 | 221,764 |
| Events in quadrant D | 3,090,004 | 209,417 |
| Mode M0 | |||
|---|---|---|---|
| Quadrant | BADHDUFLAG | Total packets | Discarded packets |
| A | 0 | 10770 | 0 |
| B | 0 | 9433 | 0 |
| C | 0 | 8442 | 0 |
| D | 0 | 12055 | 0 |
| Mode SS | |||
|---|---|---|---|
| Quadrant | BADHDUFLAG | Total packets | Discarded packets |
| A | 0 | 82 | 0 |
| B | 0 | 82 | 0 |
| C | 0 | 82 | 0 |
| D | 0 | 82 | 0 |
| Quadrant | Total seconds | Saturated seconds | Saturation percentage |
|---|---|---|---|
| A | 4135 | 109 | 2.636034% |
| B | 4135 | 101 | 2.442563% |
| C | 4135 | 13 | 0.314389% |
| D | 4135 | 217 | 5.247884% |
Noise dominated data is calculated using 1-second bins in cleaned event files. If a bin has >2000 counts, and if more than 50% of those come from <1% of pixels, then it is considered to be noise-dominated and hence unusable.
| Quadrant | # 1 sec bins | Bins with >0 counts | Bins with >2000 counts | High rate bins dominated by noise | Noise dominated (total time) | Noise dominated (detector-on time) | Marked lightcurve |
|---|---|---|---|---|---|---|---|
| A | 4136 | 4136 | 66 | 66 | 1.60% | 1.60% | 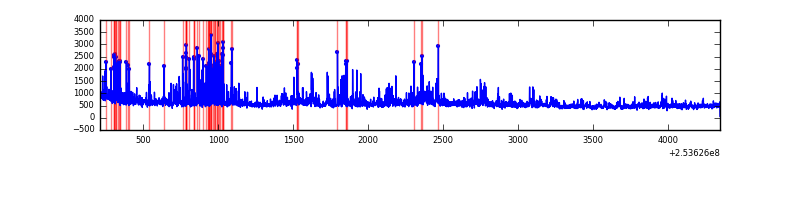 |
| B | 4136 | 4136 | 59 | 59 | 1.43% | 1.43% | 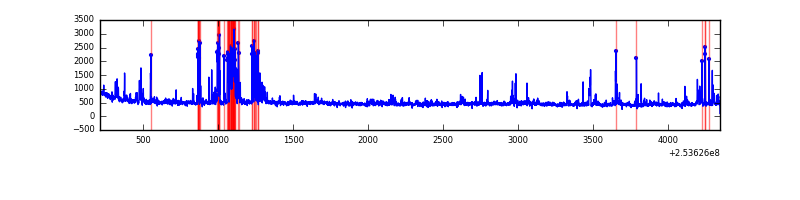 |
| C | 4136 | 4136 | 2 | 2 | 0.05% | 0.05% | 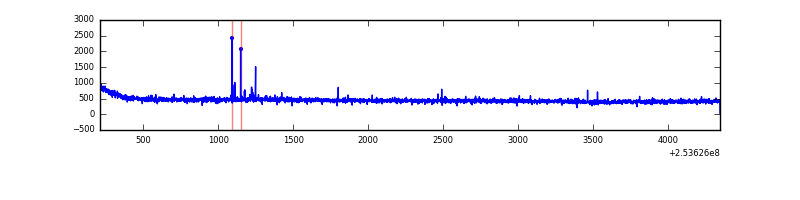 |
| D | 4136 | 4136 | 163 | 163 | 3.94% | 3.94% | 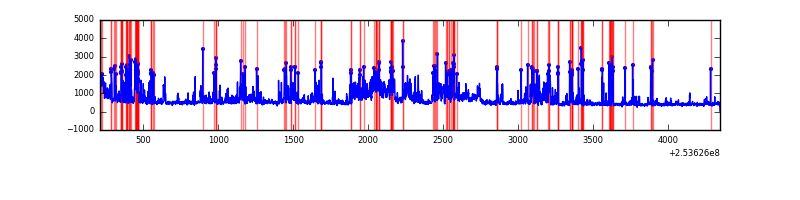 |
Top three noisy pixels from each quadrant. If the there are fewer than three noisy pixels in the level2.evt file, extra rows are filled as -1
| Pixel properties | Quadrant properties | ||||||
|---|---|---|---|---|---|---|---|
| Quadrant | DetID | PixID | Counts | Sigma | Mean | Median | Sigma |
| A | 13 | 251 | 676801 | 6835.86 | 475 | 464 | 98.9 |
| A | 1 | 162 | 59014 | 591.78 | 475 | 464 | 98.9 |
| A | 1 | 178 | 29150 | 289.93 | 475 | 464 | 98.9 |
| B | 4 | 239 | 274687 | 2946.12 | 478 | 467 | 93.1 |
| B | 3 | 64 | 62637 | 667.93 | 478 | 467 | 93.1 |
| B | 3 | 209 | 16675 | 174.13 | 478 | 467 | 93.1 |
| C | 15 | 208 | 13796 | 119.49 | 469 | 472 | 111.5 |
| C | 13 | 61 | 3451 | 26.72 | 469 | 472 | 111.5 |
| C | 8 | 222 | 1163 | 6.2 | 469 | 472 | 111.5 |
| D | 1 | 52 | 687853 | 6139.25 | 458 | 444 | 112.0 |
| D | 13 | 104 | 540192 | 4820.49 | 458 | 444 | 112.0 |
| D | 8 | 195 | 35597 | 313.95 | 458 | 444 | 112.0 |
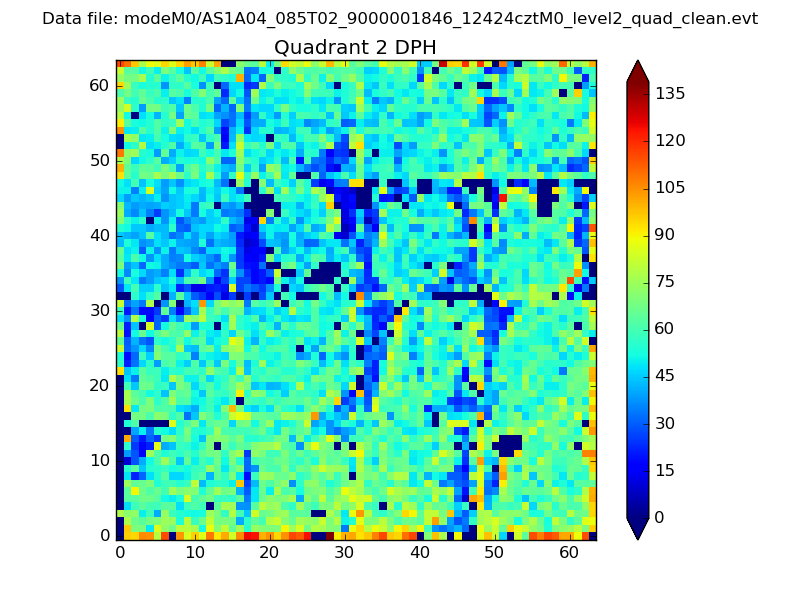
Histogram calculated using DETX and DETY for each event in the final _common_clean file
| Quadrant A |  |
 |
Quadrant B |
|---|---|---|---|
| Quadrant D | 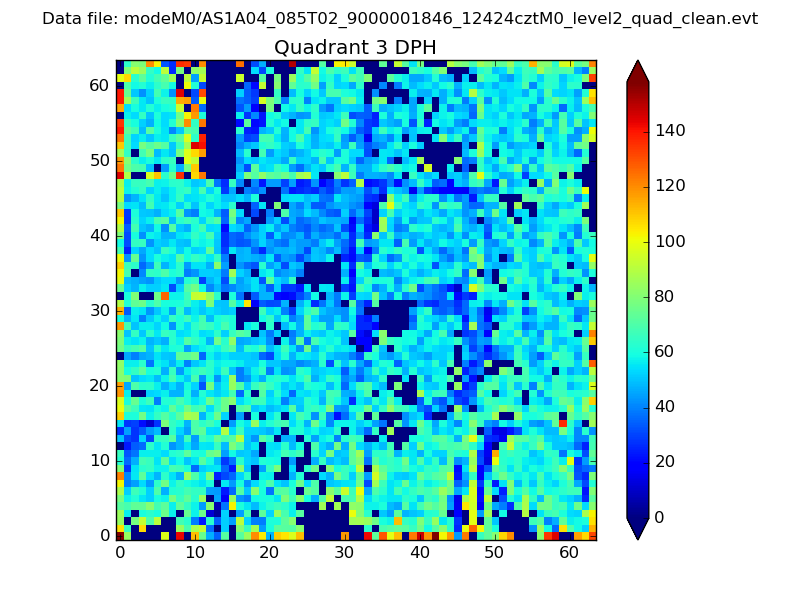 |
 |
Quadrant C |
| Plot type | Count rate plots | Images |
|---|---|---|
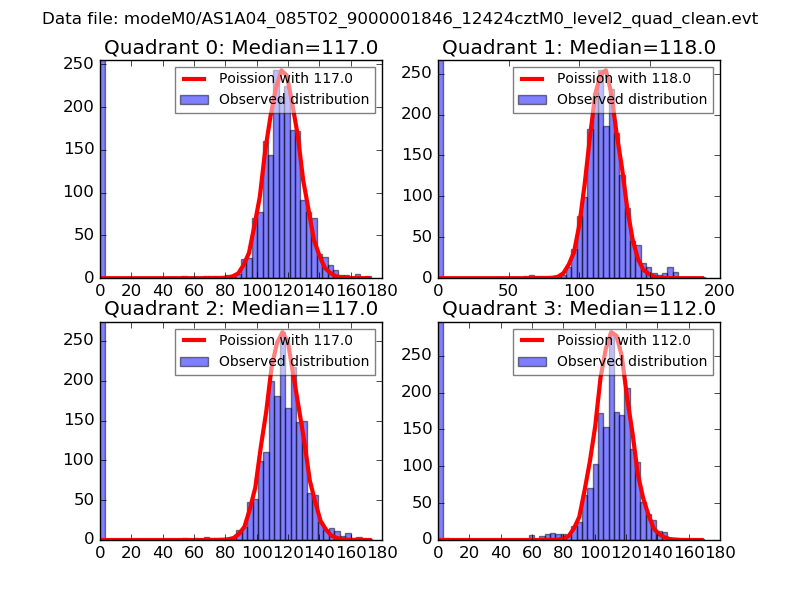
| Comparison with Poisson distribution Blue bars denote a histogram of data divided into 1 sec bins. Red curve is a Poisson curve with rate = median count rate of data. |
 |
 |
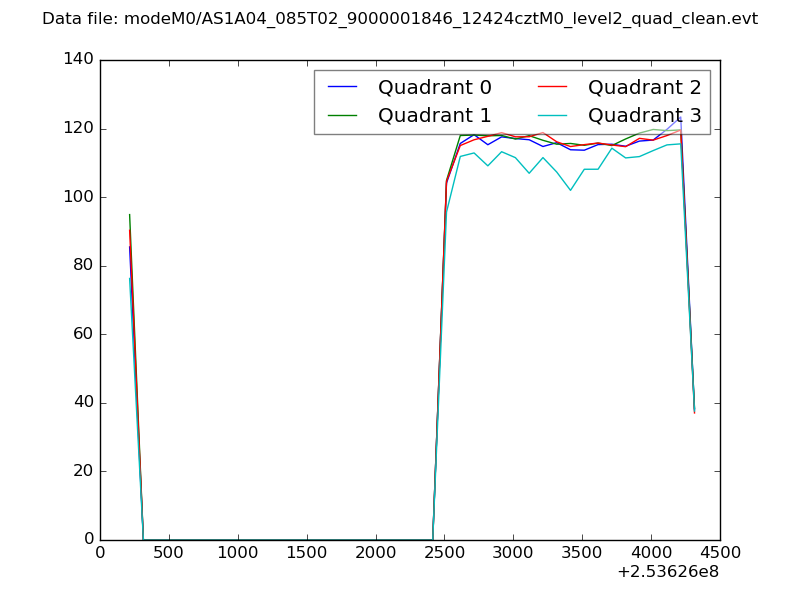
| Quadrant-wise count rates Data is divided into 100 sec bins |
 |
|
| Module-wise count rates for Quadrant A Data is divided into 100 sec bins |
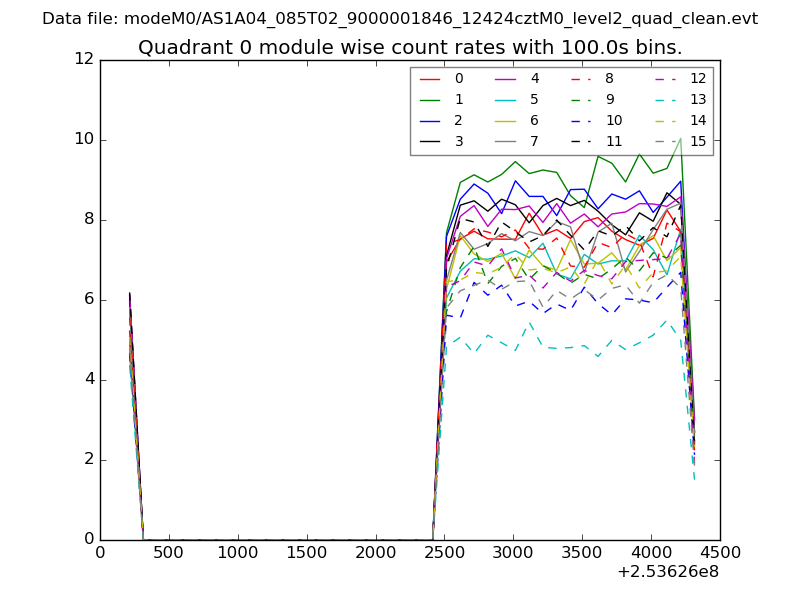 |
 |
| Module-wise count rates for Quadrant B Data is divided into 100 sec bins |
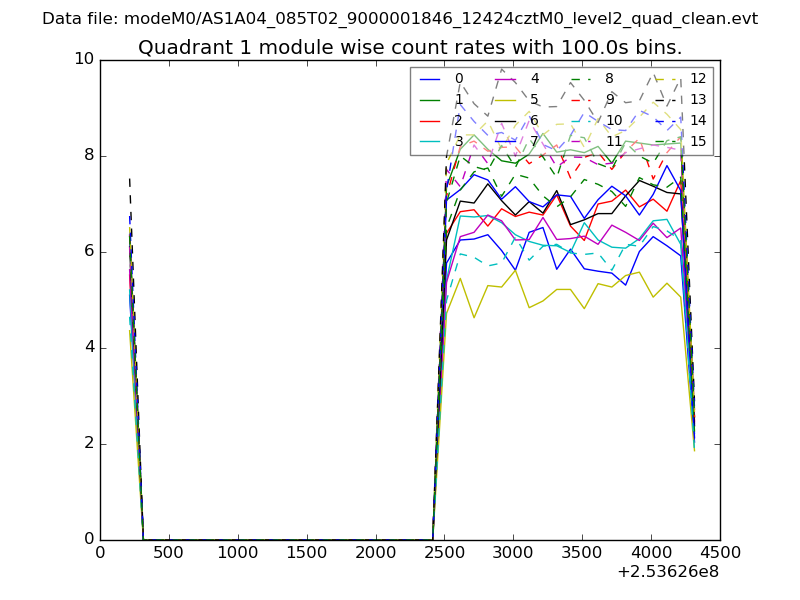 |
 |
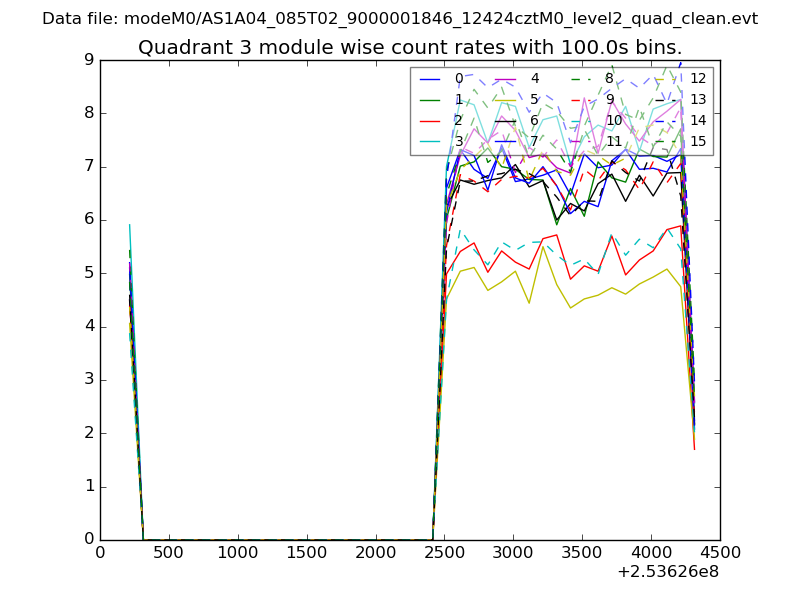
| Module-wise count rates for Quadrant C Data is divided into 100 sec bins |
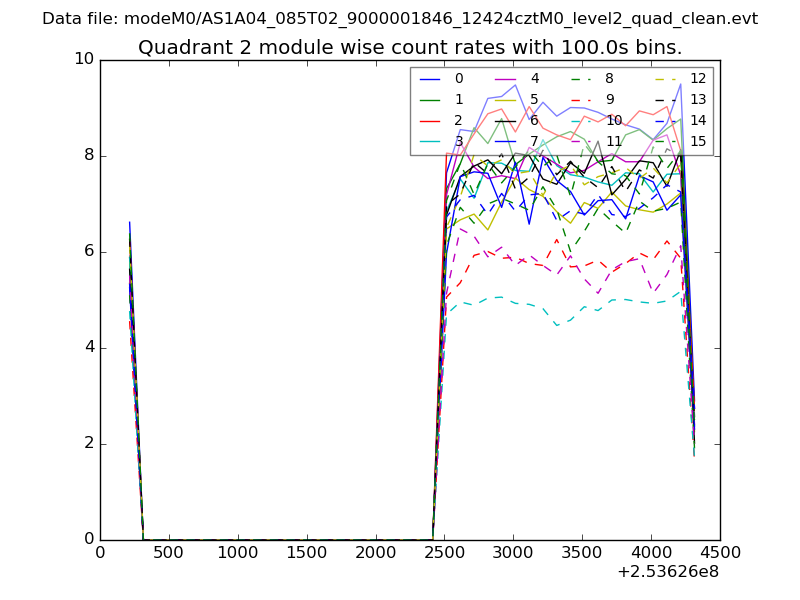 |
 |
| Module-wise count rates for Quadrant D Data is divided into 100 sec bins |
 |
 |
| Parameter | Plot |
|---|---|
| CZT HV Monitor | 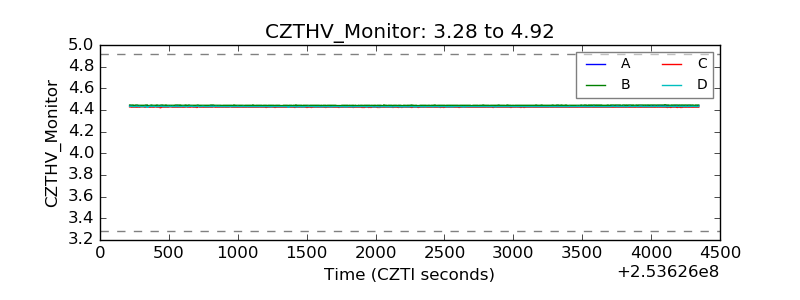 |
| D_VDD | 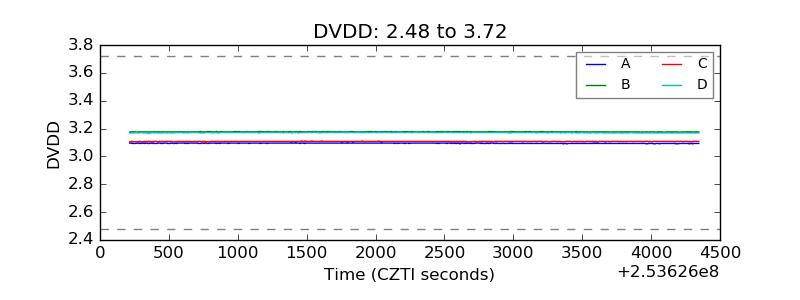 |
| Temperature 1 | 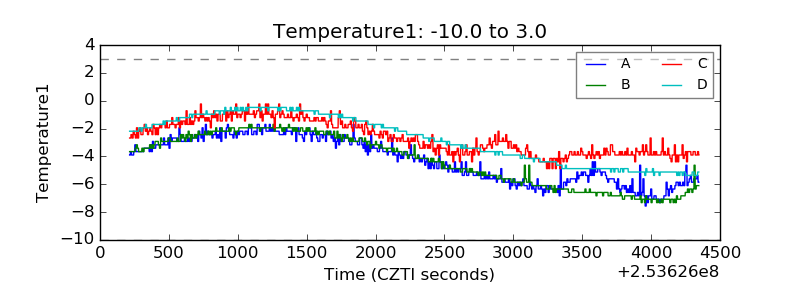 |
| Veto HV Monitor | 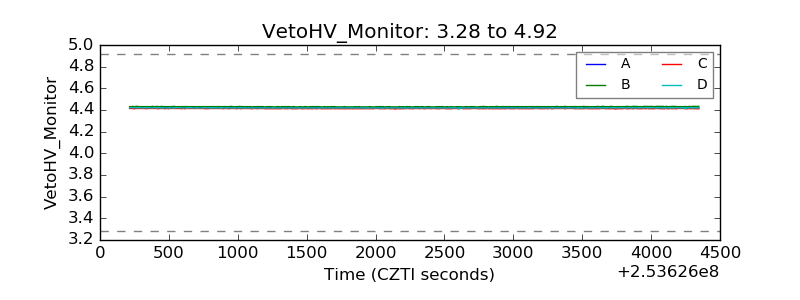 |
| Veto LLD | 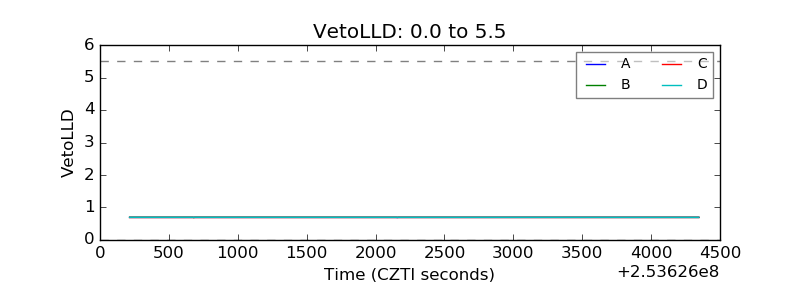 |
| Alpha Counter | 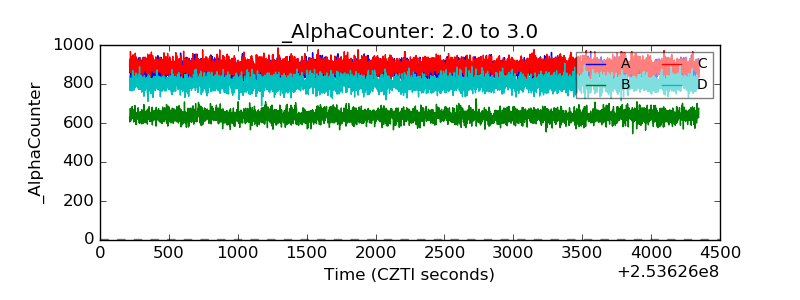 |
| _CPM_Rate | 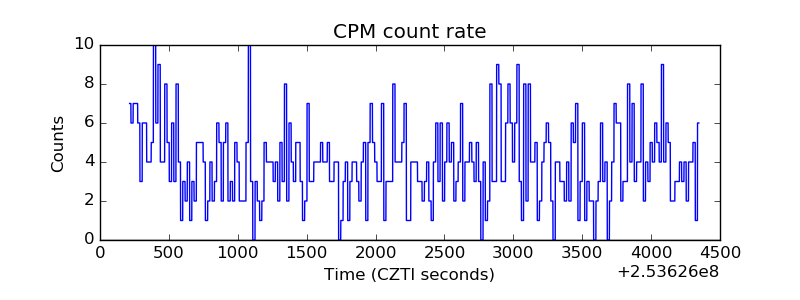 |
| CZT Counter | 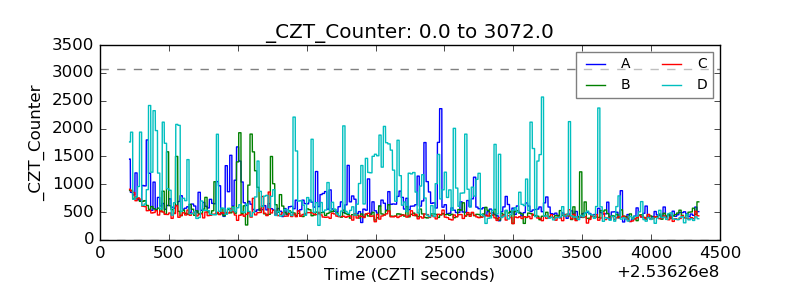 |
| +2.5 Volts monitor |  |
| +5 Volts monitor |  |
| _ROLL_ROT |  |
| _Roll_DEC | 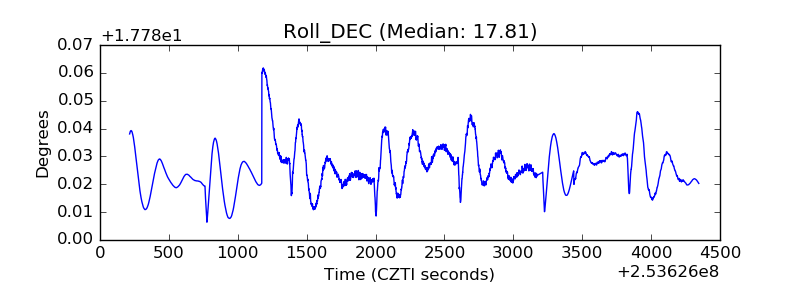 |
| _Roll_RA | 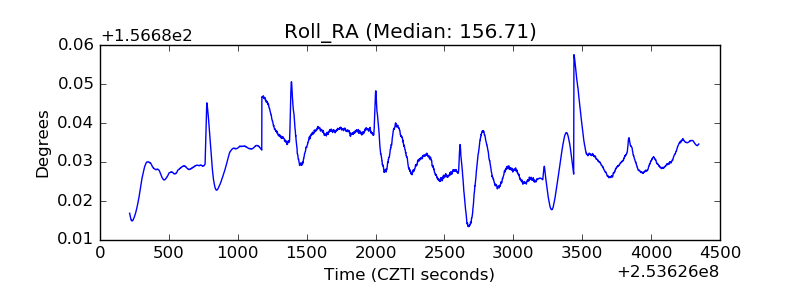 |
| Veto Counter | 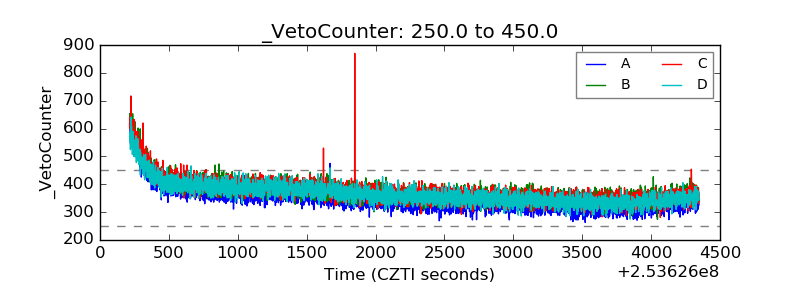 |