| Param | Original file | Final file |
|---|---|---|
| Filename | modeM0/AS1A04_141T01_9000001848_12424cztM0_level2.evt | modeM0/AS1A04_141T01_9000001848_12424cztM0_level2_quad_clean.evt |
| Size (bytes) | 195,845,760 | 25,712,640 |
| Size | 186.8 MB | 24.5 MB |
| Events in quadrant A | 1,592,472 | 148,703 |
| Events in quadrant B | 1,387,474 | 152,161 |
| Events in quadrant C | 1,268,896 | 152,993 |
| Events in quadrant D | 1,510,516 | 144,781 |
| Mode M9 | |||
|---|---|---|---|
| Quadrant | BADHDUFLAG | Total packets | Discarded packets |
| A | 0 | 3 | 0 |
| B | 0 | 3 | 0 |
| C | 0 | 3 | 0 |
| D | 0 | 3 | 0 |
| Mode M0 | |||
|---|---|---|---|
| Quadrant | BADHDUFLAG | Total packets | Discarded packets |
| A | 0 | 6383 | 2 |
| B | 0 | 5657 | 1 |
| C | 0 | 5371 | 1 |
| D | 0 | 6085 | 1 |
| Mode SS | |||
|---|---|---|---|
| Quadrant | BADHDUFLAG | Total packets | Discarded packets |
| A | 0 | 52 | 0 |
| B | 0 | 52 | 0 |
| C | 0 | 52 | 0 |
| D | 0 | 52 | 0 |
| Quadrant | Total seconds | Saturated seconds | Saturation percentage |
|---|---|---|---|
| A | 2503 | 170 | 6.791850% |
| B | 2503 | 152 | 6.072713% |
| C | 2503 | 71 | 2.836596% |
| D | 2503 | 107 | 4.274870% |
Noise dominated data is calculated using 1-second bins in cleaned event files. If a bin has >2000 counts, and if more than 50% of those come from <1% of pixels, then it is considered to be noise-dominated and hence unusable.
| Quadrant | # 1 sec bins | Bins with >0 counts | Bins with >2000 counts | High rate bins dominated by noise | Noise dominated (total time) | Noise dominated (detector-on time) | Marked lightcurve |
|---|---|---|---|---|---|---|---|
| A | 2744 | 2504 | 4 | 4 | 0.15% | 0.16% | 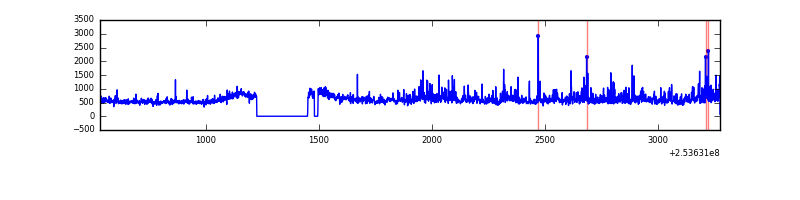 |
| B | 2744 | 2505 | 7 | 7 | 0.26% | 0.28% | 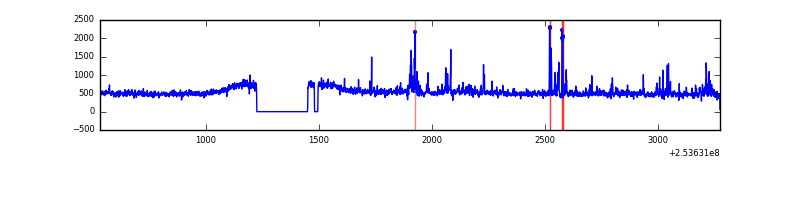 |
| C | 2744 | 2505 | 0 | 0 | 0.00% | 0.00% | 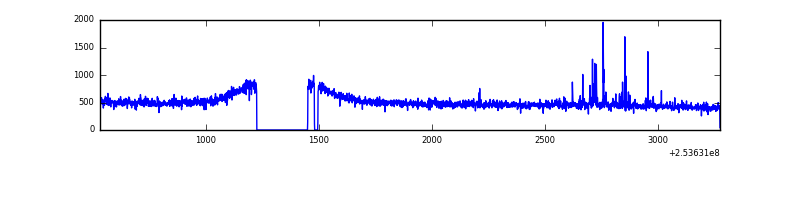 |
| D | 2744 | 2505 | 20 | 20 | 0.73% | 0.80% | 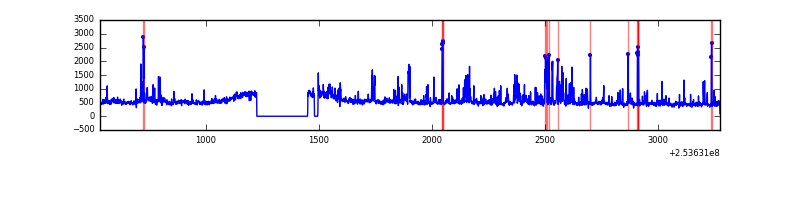 |
Top three noisy pixels from each quadrant. If the there are fewer than three noisy pixels in the level2.evt file, extra rows are filled as -1
| Pixel properties | Quadrant properties | ||||||
|---|---|---|---|---|---|---|---|
| Quadrant | DetID | PixID | Counts | Sigma | Mean | Median | Sigma |
| A | 13 | 251 | 186833 | 2757.04 | 323 | 314 | 67.7 |
| A | 1 | 162 | 56396 | 828.98 | 323 | 314 | 67.7 |
| A | 1 | 178 | 31103 | 455.11 | 323 | 314 | 67.7 |
| B | 4 | 239 | 61235 | 958.45 | 321 | 312 | 63.6 |
| B | 0 | 187 | 23501 | 364.81 | 321 | 312 | 63.6 |
| B | 0 | 190 | 21778 | 337.71 | 321 | 312 | 63.6 |
| C | 15 | 208 | 27439 | 357.01 | 316 | 316 | 76.0 |
| C | 8 | 128 | 3576 | 42.91 | 316 | 316 | 76.0 |
| C | 13 | 61 | 2299 | 26.1 | 316 | 316 | 76.0 |
| D | 1 | 52 | 204342 | 2609.27 | 317 | 307 | 78.2 |
| D | 13 | 104 | 29318 | 371.0 | 317 | 307 | 78.2 |
| D | 8 | 195 | 19855 | 249.99 | 317 | 307 | 78.2 |
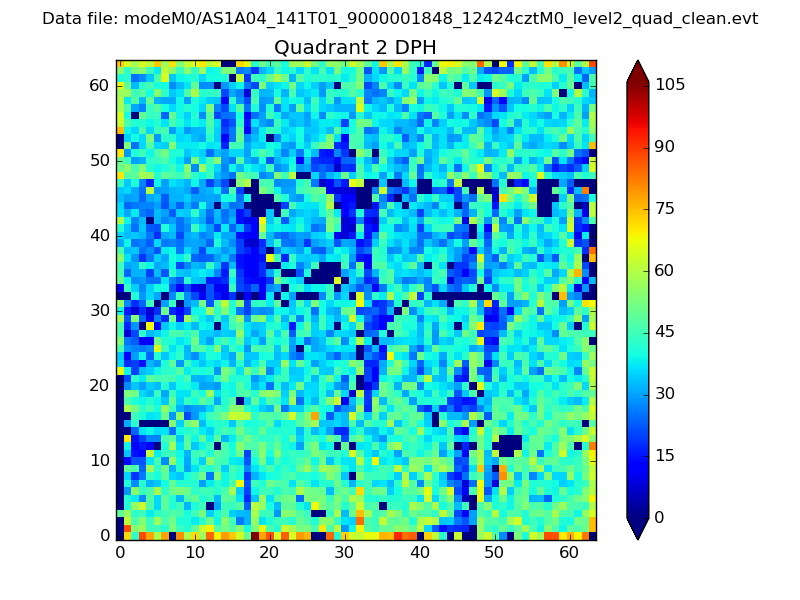
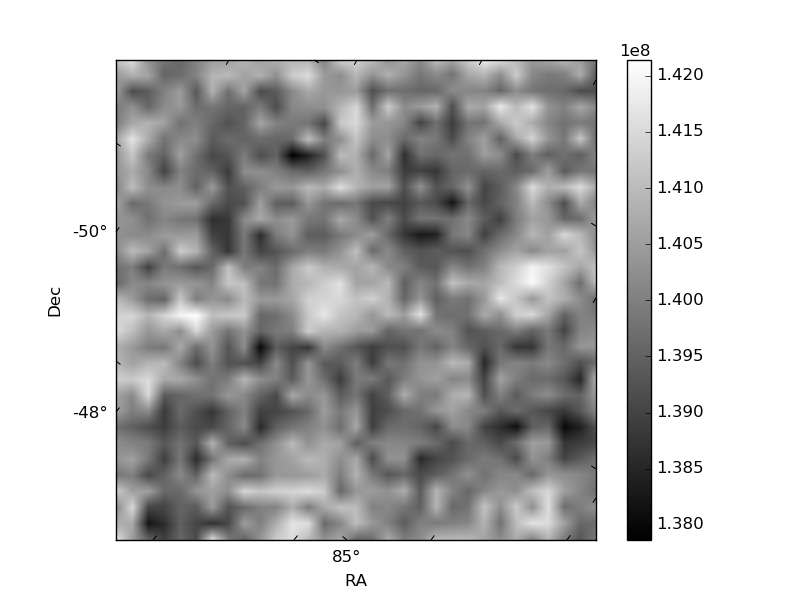
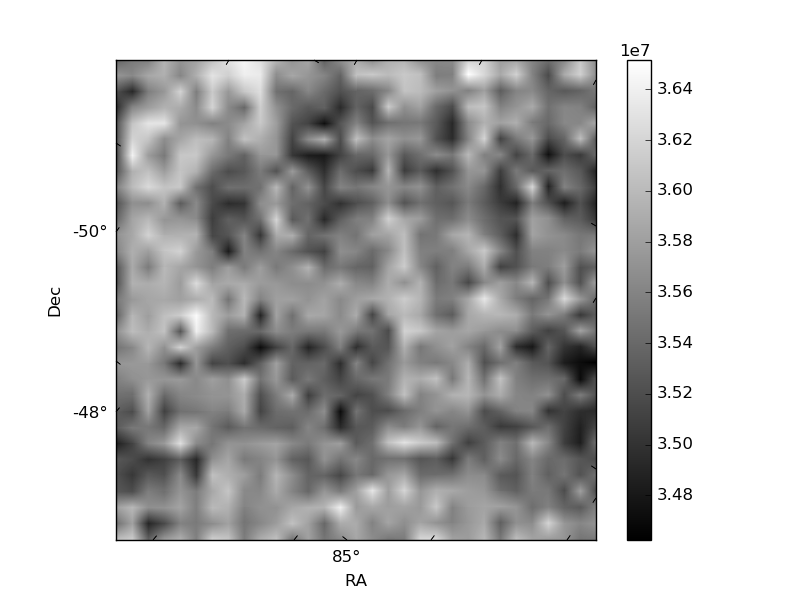
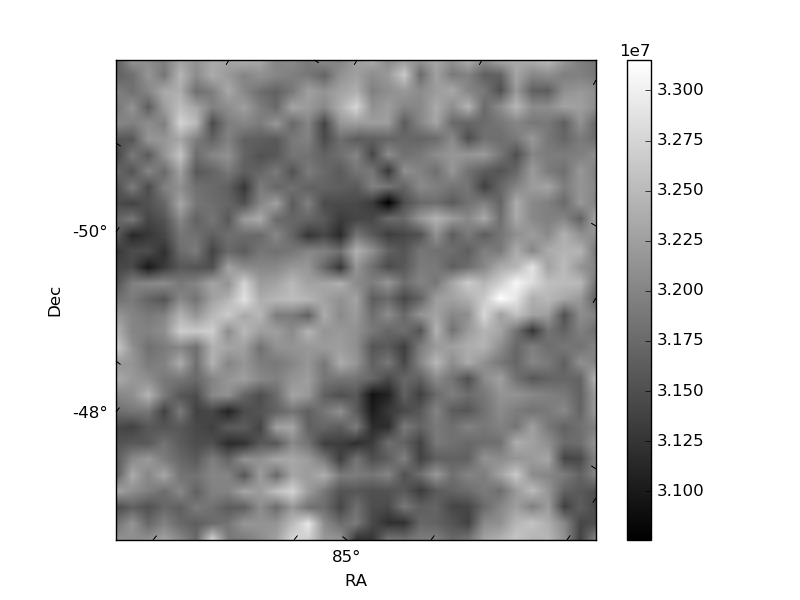
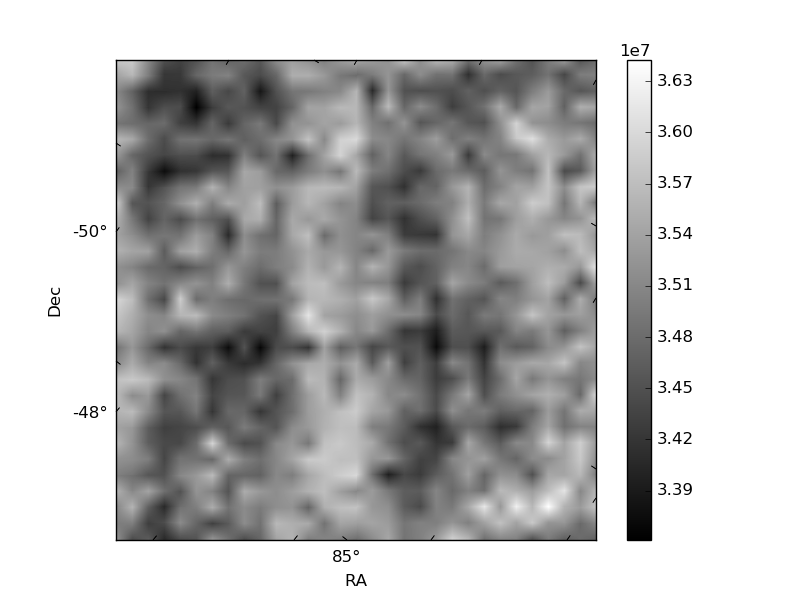
Histogram calculated using DETX and DETY for each event in the final _common_clean file
| Quadrant A | 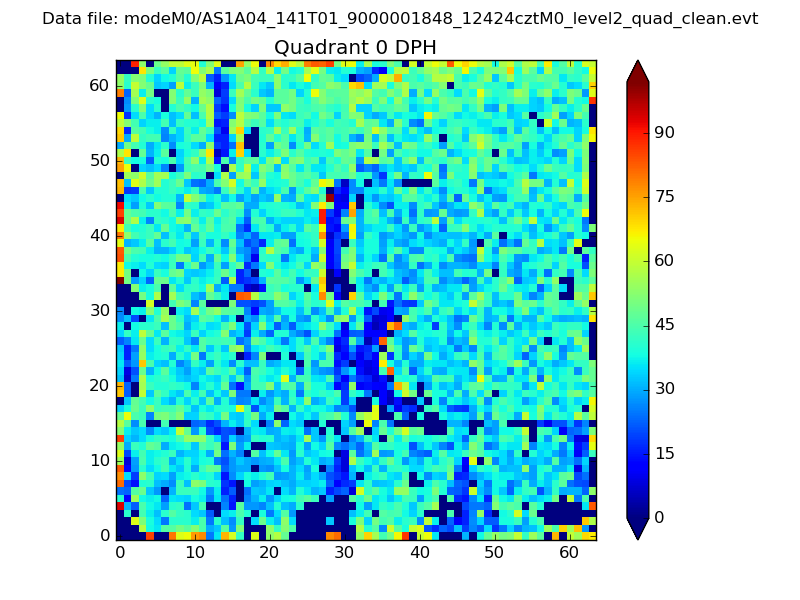 |
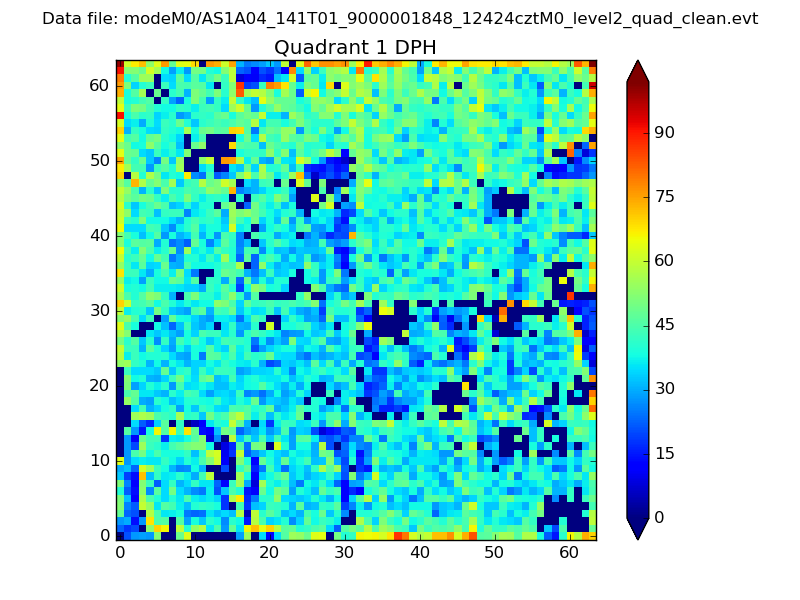 |
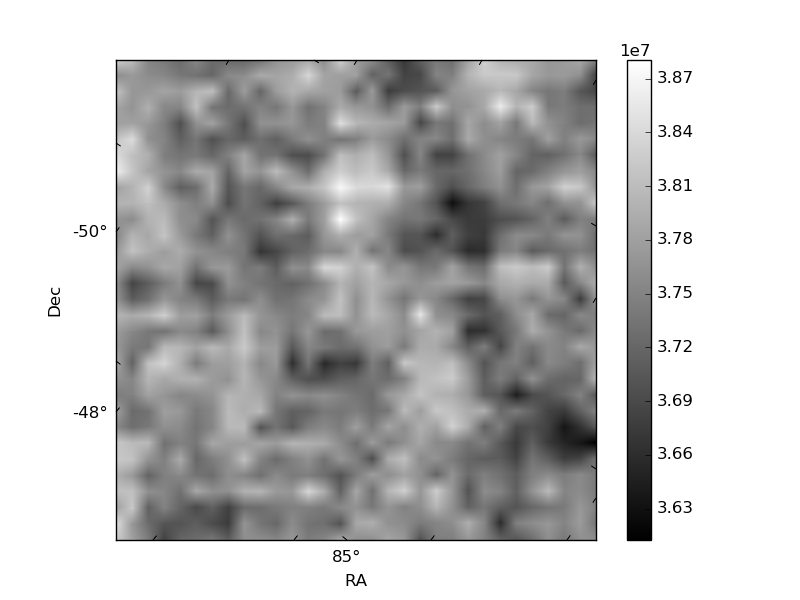
Quadrant B |
|---|---|---|---|
| Quadrant D | 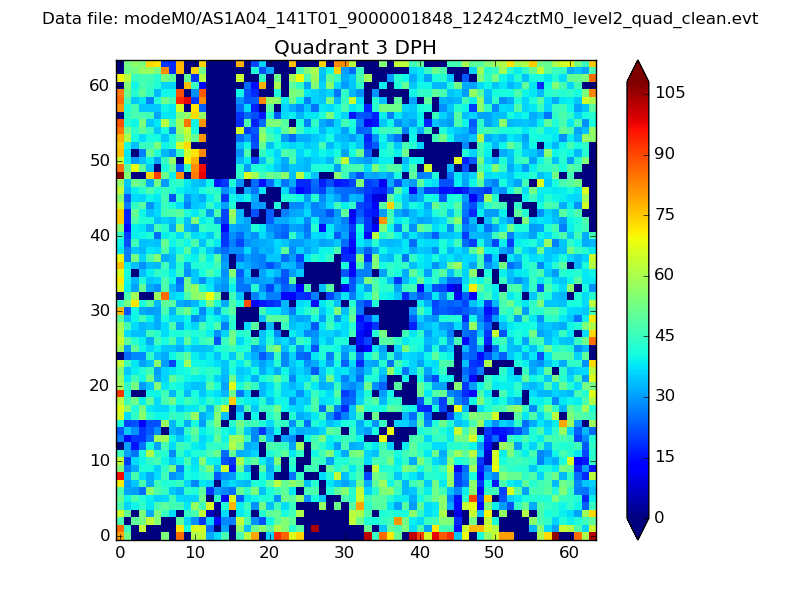 |
 |
Quadrant C |
| Plot type | Count rate plots | Images |
|---|---|---|
| Comparison with Poisson distribution Blue bars denote a histogram of data divided into 1 sec bins. Red curve is a Poisson curve with rate = median count rate of data. |
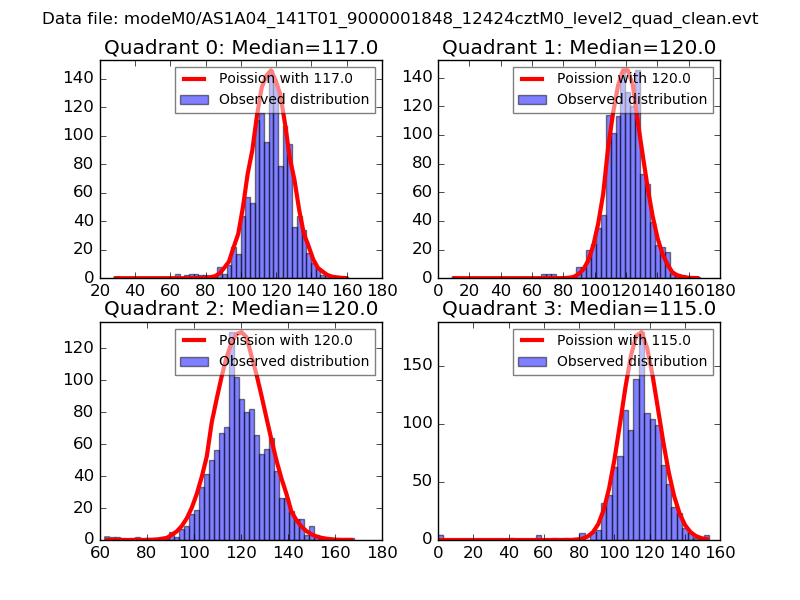 |
 |
| Quadrant-wise count rates Data is divided into 100 sec bins |
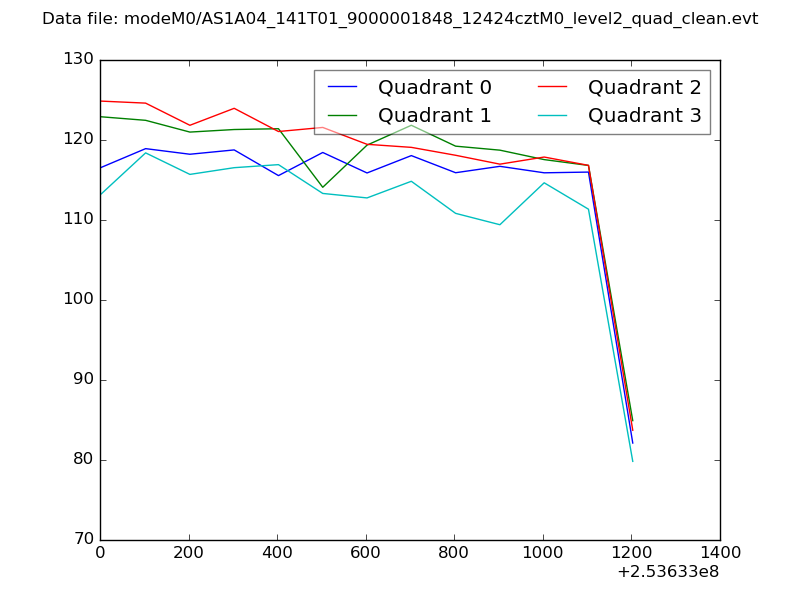 |
|
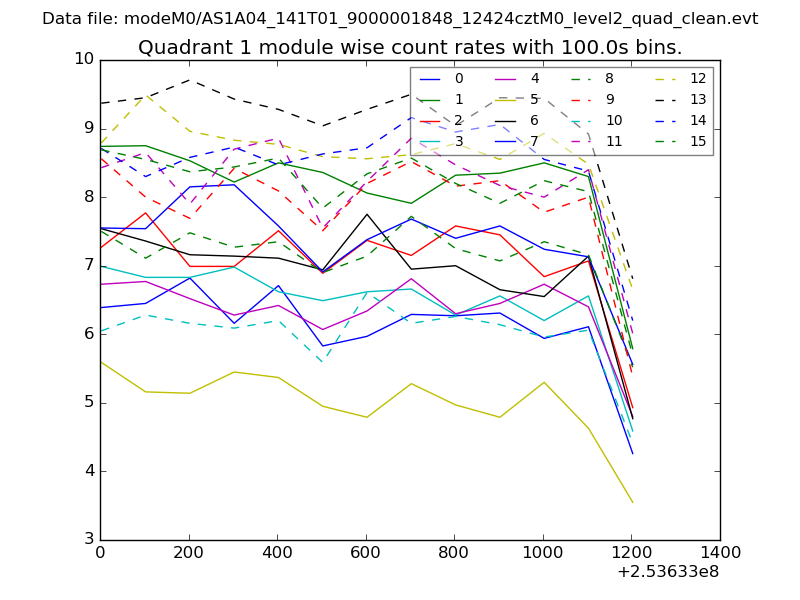
| Module-wise count rates for Quadrant A Data is divided into 100 sec bins |
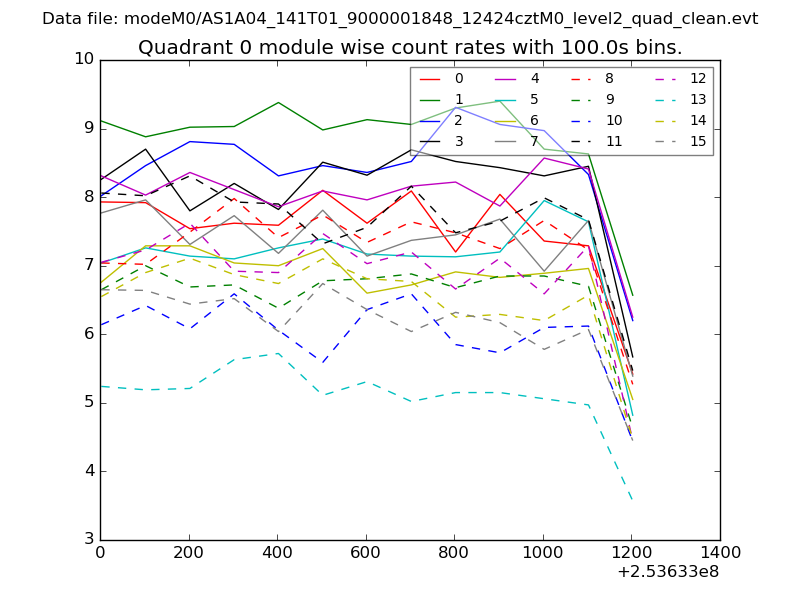 |
 |
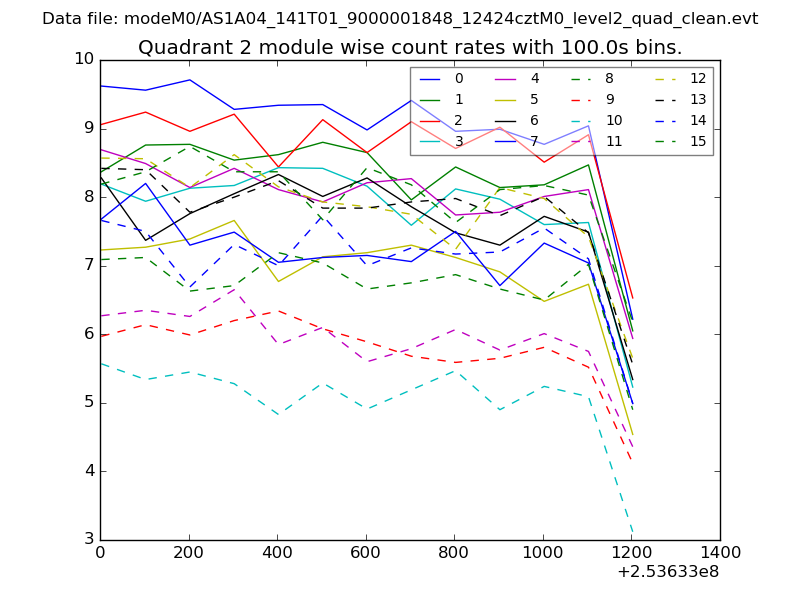
| Module-wise count rates for Quadrant B Data is divided into 100 sec bins |
 |
 |
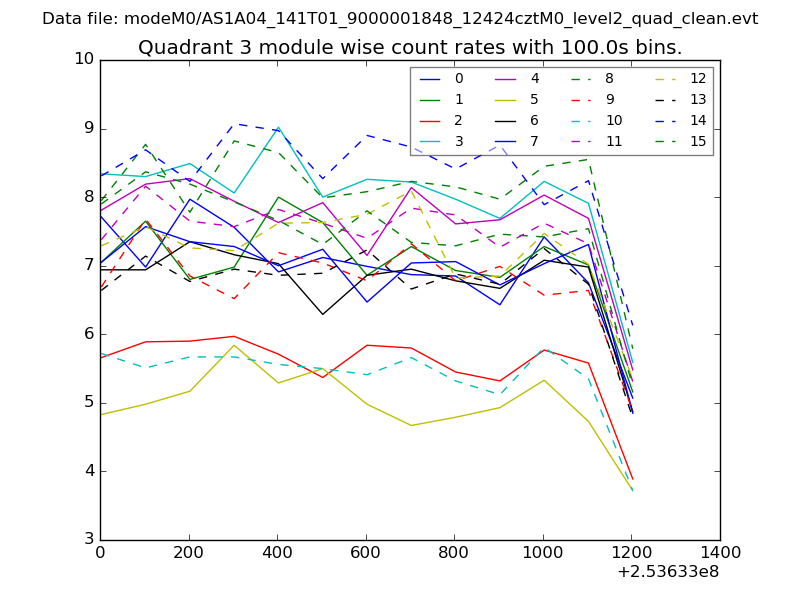
| Module-wise count rates for Quadrant C Data is divided into 100 sec bins |
 |
 |
| Module-wise count rates for Quadrant D Data is divided into 100 sec bins |
 |
 |
| Parameter | Plot |
|---|---|
| CZT HV Monitor | 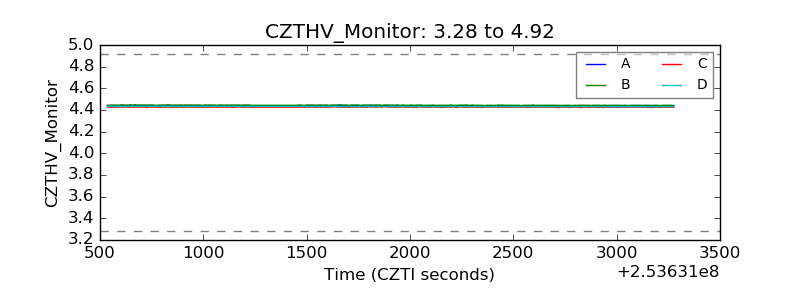 |
| D_VDD | 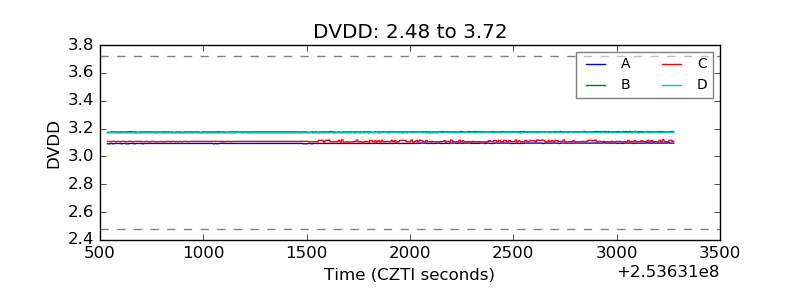 |
| Temperature 1 | 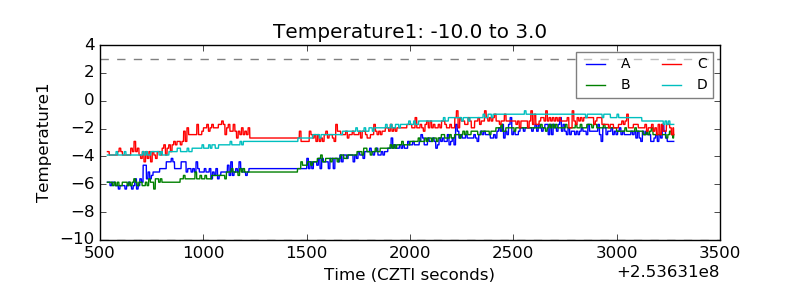 |
| Veto HV Monitor | 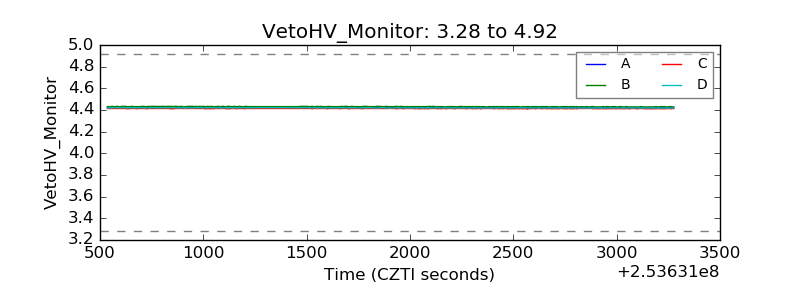 |
| Veto LLD | 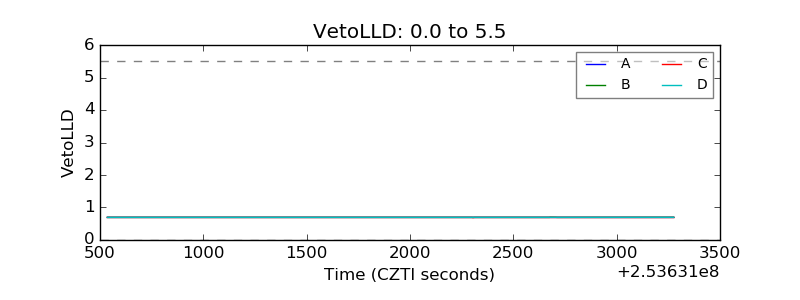 |
| Alpha Counter | 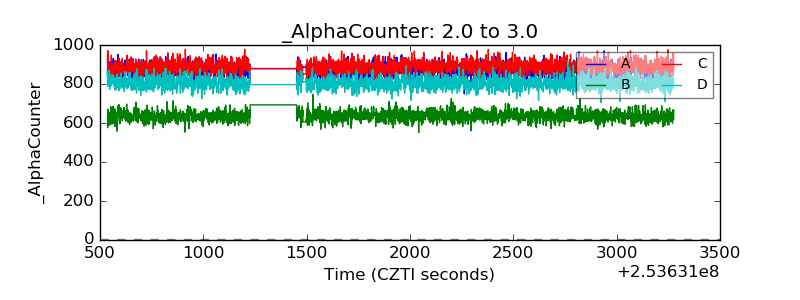 |
| _CPM_Rate | 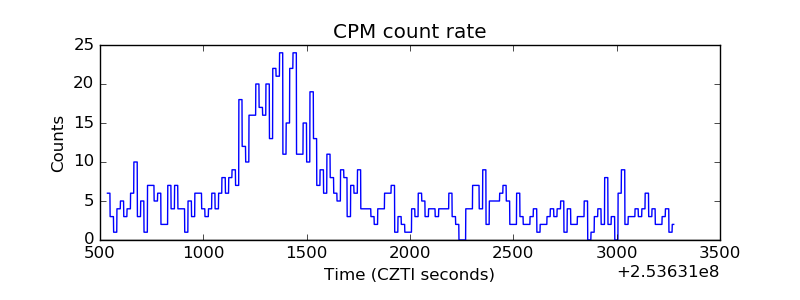 |
| CZT Counter | 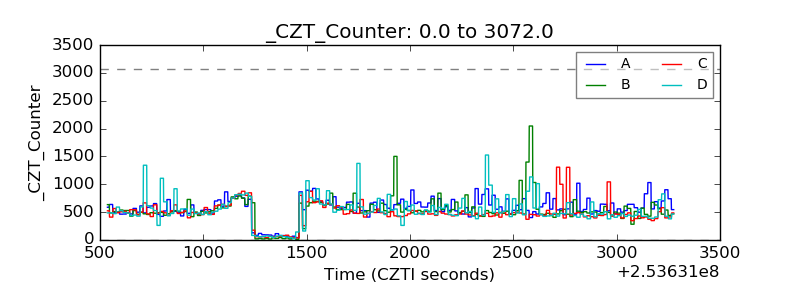 |
| +2.5 Volts monitor | 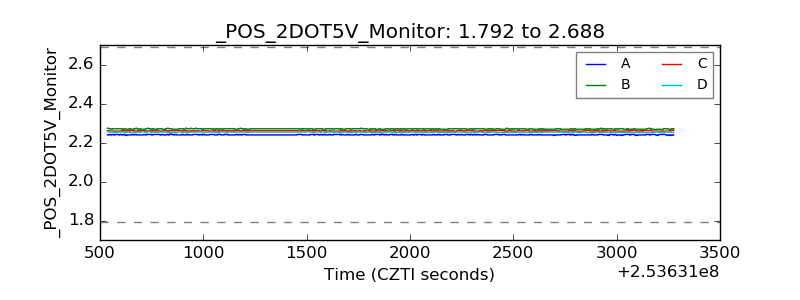 |
| +5 Volts monitor |  |
| _ROLL_ROT | 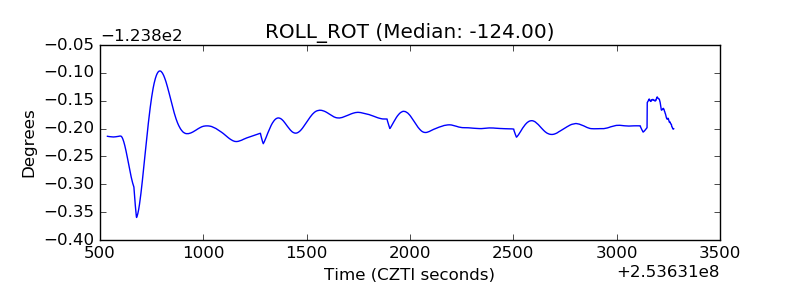 |
| _Roll_DEC | 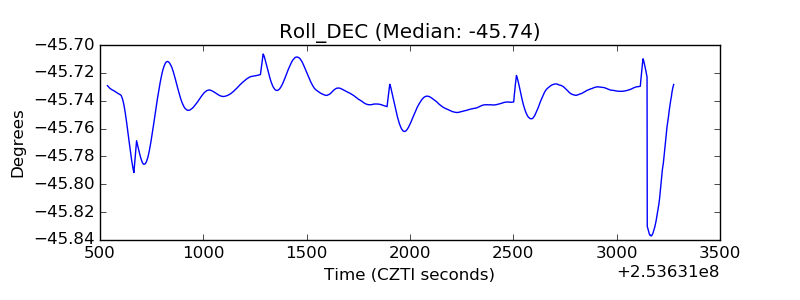 |
| _Roll_RA | 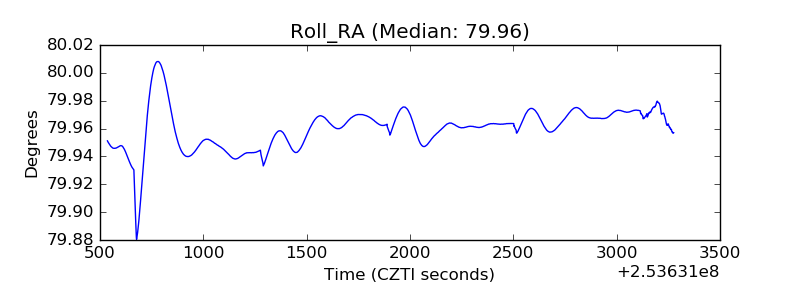 |
| Veto Counter | 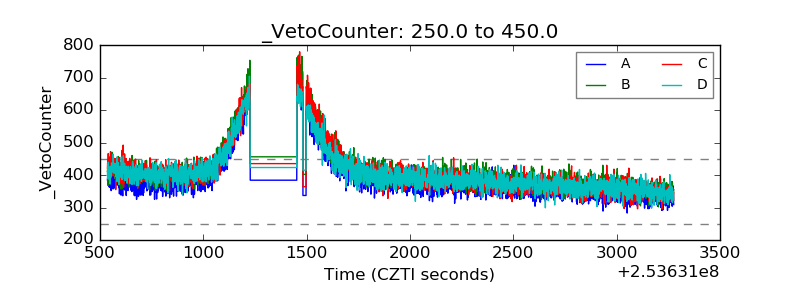 |